Mutational scanning reveals oncogenic CTNNB1 mutations have diverse effects on signaling
CTNNB1 hotspot mutational patterns are tissue-specific
We analyzed 9,248 tumors with CTNNB1 mutations in the COSMIC database (Fig. 1a, Supplementary Fig. 1b and Supplementary Table 1). As previously reported6, the majority of mutations (86%) were missense substitutions. Of these, 88% occurred in the L31–G48 hotspot region encoded by exon 3 (Fig. 1a,b and Supplementary Table 1). Residues T41 and S45 were most frequently affected, comprising 27% and 25% of hotspot missense mutations, respectively, followed by S37, S33, D32 and G34 (Supplementary Fig. 1b).
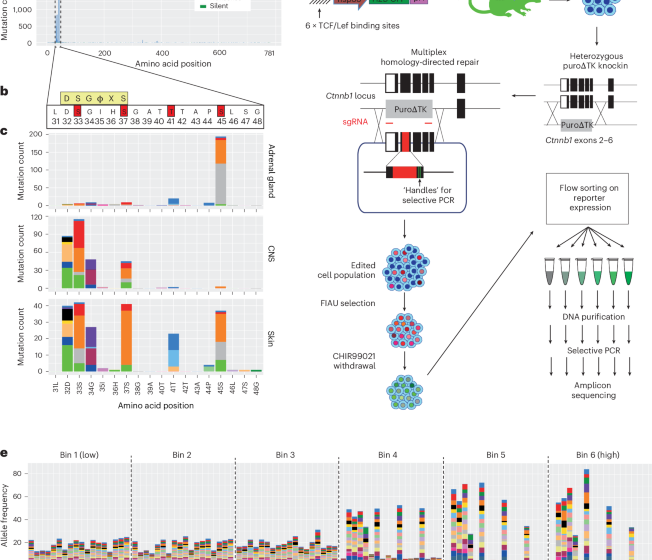
a, Histogram showing the frequency of mutations at each amino acid position of human CTNNB1 across all tumors present in the COSMIC database. Blue boxes represent the positions of armadillo repeat domains, and the red box indicates the degron and mutation hotspot, which is expanded in c. b, The amino acid sequence of the CTNNB1 mutation hotspot. The consensus docking site for the β-TRCP E3 ligase substrate receptor is shown in a yellow box; ϕ indicates any hydrophobic amino acid, and X indicates any amino acid. Phosphorylation sites known to be critical for β-catenin turnover are highlighted in red boxes. c, Histograms show distinct distributions of mutations within the CTNNB1 mutation hotspot for COSMIC tumors of the adrenal gland, central nervous system (CNS) and skin. Data from other primary tissue sites are shown in Supplementary Fig. 2. d, Schematic overview of the mutational scanning assay. A β-catenin signaling activity reporter construct was integrated randomly into the genome to generate transgenic mice23. Primary ES cells were derived, and a region spanning exons 2–6 of Ctnnb1 was replaced with a puro∆TK selection cassette on one of two alleles. A plasmid library was generated for homology-directed repair, encoding each of 342 possible single amino acid substitutions spanning codons 31 to 48 of β-catenin, together with silent mutations to allow selective PCR amplification of edited alleles from genomic DNA. This was transfected into multiplex-ready mouse ES cells together with sgRNAs that cut in an allele-specific manner on either side of the selection cassette. After recovery, transfected cells were cultured in the presence of FIAU to kill those in which the selection cassette had not been removed. Multiplex-ready cells were routinely cultured under 2i conditions51 to compensate for hemizygous CTNNB1 expression, but the GSK3β inhibitor (CHIR99021) was withdrawn 2 days before sorting to allow β-catenin signaling to return to a baseline state. Cells were then subject to fluorescence-activated cell sorting based on the level of GFP reporter expression, before extraction of genomic DNA, amplification of Ctnnb1 exon 3 by PCR and Illumina sequencing. Further methodological information is detailed in the Methods. e, The frequency of individual missense mutations across each position in the mutation hotspot in cell populations sorted according to the scheme shown in d, expressed relative to their frequency in the unsorted pool sample. The color scheme used to represent different missense mutations is shown to the right.
Analysis across tissues revealed tissue-specific mutation preferences (Fig. 1c and Supplementary Fig. 2). S45 mutations are greatly enriched in adrenal and kidney tumors, whereas mutations within the β-TCRP docking motif predominated in the central nervous system (Fig. 1c and Supplementary Fig. 2). Liver and skin showed a broader profile, encompassing all six of the most frequently mutated positions (Fig. 1c and Supplementary Fig. 2). Specific amino acid substitutions at each residue also varied by tissue. For example, 99% of soft tissue tumors with T41 mutations (1,201 out of 1,217) carried T41A, whereas in pituitary gland, 89% of T41 mutations (77 out of 87) were T41I (Supplementary Fig. 2). Overall, CTNNB1 hotspot mutational patterns are highly diverse and tissue-dependent.
Mutational scanning reveals diverse consequences of Ctnnb1 hotspot mutations
To systematically measure the consequences of CTNNB1 hotspot mutations on β-catenin signaling, we devised a multiplexed CRISPR homology-directed repair (HDR) assay covering all 342 possible single amino acid substitutions across positions 31–48 (Fig. 1d). This assay enables phenotypic analysis of variants expressed from the endogenous mouse Ctnnb1 locus, which is 100% conserved with human exon 3 at the amino acid level. Variant function was measured in parallel under normal regulatory control20,21,22, providing a sensitive and comprehensive assessment of hotspot mutant phenotypes. A library of HDR templates was synthesized, each encoding a single amino acid substitution and flanking synonymous changes to enable selective PCR amplification of edited alleles20,21 (Fig. 1d).
To analyze individual hotspot mutations at the single-cell level, we derived embryonic stem (ES) cells from the Tcf/Lef-H2B–GFP transgenic mouse line23,24, then replaced exons 2–6 of Ctnnb1 with a negative counter-selection cassette on one allele (Fig. 1d). Specifically targeting and replacing the selection cassette with a multiplexed HDR template library, combined with fluorescence-activated cell sorting (Supplementary Fig. 3a), enabled efficient quantification of the functional output of each edited allele (Fig. 1d). ES cells were chosen for their high HDR efficiency and intact canonical WNT signaling, in contrast to most tumor lines.
After editing and selection, a subset of cells displayed elevated Tcf/Lef-H2B–GFP reporter expression (Supplementary Fig. 3a), consistent with canonical Wnt pathway activation. Cells were sorted into six equally log-spaced bins (P1–P6) based on increasing reporter GFP signal (Supplementary Fig. 3a), and genomic DNA was subjected to amplicon deep sequencing across the Ctnnb1 hotspot region using primers specific for HDR-edited alleles (Fig. 1d). Amplicon sequencing was also performed on the untransfected HDR donor library (‘plasmid’) and edited but unsorted cells (‘pool’; Supplementary Fig. 3b), enabling quantification of Ctnnb1 variant frequencies across reporter activity bins relative to their frequency in the total cell population (Fig. 1e). Normalized mutant allele frequencies showed high correlations between biological replicates (Pearson’s r, range 0.54–0.89; Supplementary Fig. 3c) and were merged for downstream analysis. Frequencies also correlated well between plasmid and pool samples (Pearson’s r, 0.63), indicating consistent and unbiased HDR efficiency throughout the targeted region (Supplementary Fig. 3c).
The mutation frequency was relatively constant across positions in the unsorted cell population (Supplementary Fig. 3b), whereas it varied substantially across cells with different GFP levels (Fig. 1e). Substitutions at codon positions that are frequently mutated in tumors (D32, S33, G34, S37, T41 and S45) were rarely observed in low activity bins but frequently observed in bins of higher activity (Fig. 1e), validating this system’s ability to functionally classify CTNNB1 mutations.
Calculation and validation of mutation effect scores
For each variant, we calculated a mutational effect score (MES) by integrating allele frequencies and reporter activation levels across bins25 (Supplementary Methods). This procedure provided a metric to compare the phenotypic consequences of each substitution and gain insight into β-catenin regulation (Fig. 2a and Supplementary Table 2).
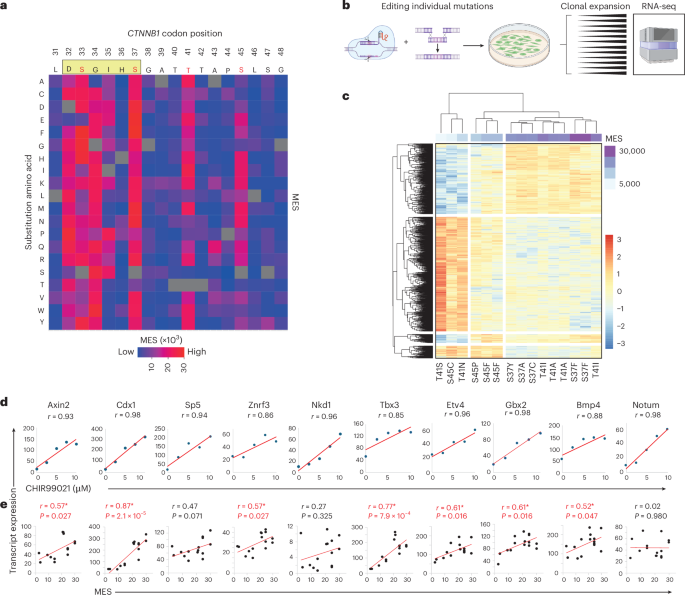
a, Heatmap representation of MESs, showing the activity profile for every possible amino acid substitution at the CTNNB1 mutation hotspot, reconstructed from data shown in Fig. 1e. Individual scores are provided in Supplementary Table 2. The consensus motif for β-TRCP docking is shown in a beige rectangle above the heatmap, with known phosphorylation sites highlighted in red. b, Schematic to illustrate the derivation of clonal mouse ES cell lines genome-edited to express individual Ctnnb1 exon 3 mutations. Created in BioRender.com. c, Unsupervised clustering of Ctnnb-mutant clones based on global RNA-seq expression profiling shows co-clustering of clones with mutations of similar MES values (purple bar). d,e, Ten endogenous β-catenin target genes were selected based on the high correlation (>0.85) between transcript expression and dose of the GSK3β inhibitor CHIR99021 (d); transcript expression also correlated with MES values of the relevant exon 3 mutations (e). All r values and P values are from Pearson tests (two-sided); P values of <0.05 are highlighted in red.
We first compared the MES values with scores produced by 50 computational variant effect predictors (VEPs) for the same substitutions26 (Supplementary Table 3). The strongest correlation was observed for EVE, which uses deep generative models to calculate variant effect scores from evolutionary sequence information27. The correlation between EVE and MES scores for the CTNNB1 hotspot (Spearman’s ρ, 0.662) was higher than any other EVE–deep mutational scanning (DMS) combination and all but three of 1,430 VEP–DMS comparisons in a prior benchmarking study26. Although correlation with VEP scores is not a definitive measure of DMS reliability, the strong concordance supports the high quality of the current dataset.
We next tested the ability of MES scores to predict endogenous β-catenin target activation. Using multiplex-ready ES cells, we generated 15 clonal cell lines (Fig. 2b), each heterozygous for one of 11 mutations spanning a range of MES values, focusing on substitutions at the three most frequently mutated positions in human cancer. Transcriptional responses were measured using bulk 3′ RNA sequencing (RNA-seq), with GSK3β inhibition by CHIR99021 serving as a positive control. Unsupervised hierarchical clustering classified cell lines into low, medium and high MES categories (Fig. 2c). Ten β-catenin targets that showed dose-responsive activation by CHIR99021 (Pearson r > 0.85; Fig. 2d) also displayed positive correlations between transcript levels and the relevant MES value (Fig. 2e; median Pearson r = 0.57; range, 0.02–0.87; P < 0.05 for seven out of ten target genes).
MES values also predicted endogenous β-catenin target gene expression in human fetal liver organoids. A previous study introduced one of four exon 3 mutations (D32G, S33F, T41A or S45P) homozygously at the endogenous CTNNB1 locus (Supplementary Fig. 4a)28. RNA-seq data from these organoids showed positive correlations between MES values and β-catenin target genes in nine out of ten cases (median Pearson r = 0.65; range, −0.5 to 0.96; Supplementary Fig. 4b). As outlined further below, MES scores also predicted the strength of β-catenin target activation in two independent human HCC cohorts. Altogether, these data show that MES values predict the degree to which endogenous β-catenin target genes are activated by different exon 3 mutations in both mouse ES cells and hepatocytes.
Refining genotype–phenotype correlations within the CTNNB1 hotspot
The current model of genotype–phenotype relationships within the exon 3 hotspot proposes that missense mutations exert position-dependent effects on β-catenin signaling: S45 mutations activate weakly, T41 mutations activate moderately and mutations within the core β-TRCP docking motif (positions 32–37) activate strongly19. Our derivation of MES values for all 19 possible missense mutations across the hotspot region enabled testing and refinement of this model. Notably, of the 342 possible amino acid changes, only 105 can arise by a single nucleotide substitution (median of six changes per site; Fig. 3a). As expected, this group accounts for >98% of the single amino acid substitutions in the COSMIC database (Supplementary Table 1).
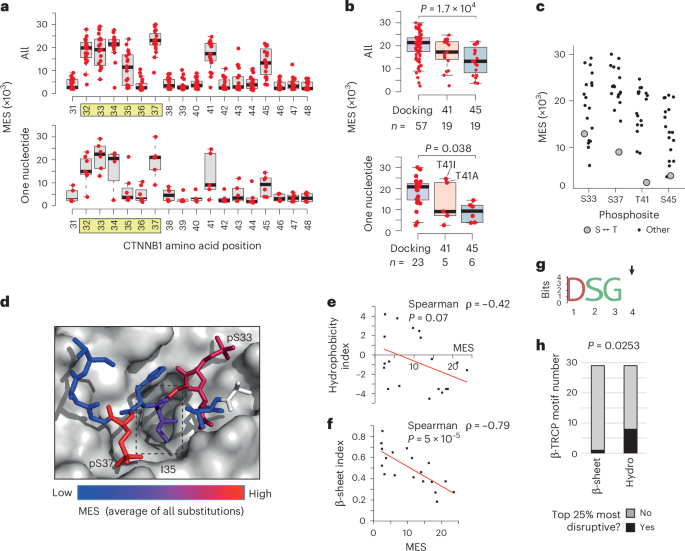
a, The distribution of MES values is shown by codon position for all 19 missense substitutions (top) or just the subset that can be reached by a single nucleotide mutation in the human genome (bottom). The core β-TRCP docking motif is highlighted in yellow. For boxplots in a and b, horizontal lines show the median value, boxes show the second and third quartiles and whiskers show the range. b, The distribution of all MES values (top) or just the single nucleotide subset (bottom) for invariable positions within the β-TRCP docking motif (combined for D32, S33, G34, S37: ‘Docking’), T41 and the CK1 target site at position 45. The two most common T41 mutations in human cancer are labeled in the bottom panel. P values show one-way ANOVA with post hoc Tukey’s honestly significant difference test. c, The distribution of MES values for all amino acid substitutions is shown for individual phosphosites, with serine–threonine substitutions highlighted. d, Structure of human β-TRCP (shown in surface mode) in complex with the phosphorylated degron peptide of β-catenin (amino acids 30–40 are shown) based on PDB 1P22. Individual β-catenin residues are colored according to the mean MES value across all substitutions at that position. The box indicates position I35. e, Correlation between MES values for individual substitutions at position I35 with the Kyte–Doolittle hydrophobicity scale34. f, Correlation between MES values for individual substitutions at position I35 with the Chou–Fasman β-sheet scale36. P values in e and f show Spearman’s rank tests (two-tailed). g, Amino acid logo generated from n = 29 high-confidence β-TRCP docking sites containing the ‘DSGX’ motif37. Position 4, equivalent to I35 in β-catenin, is highlighted with an arrow. h, Stacked bar chart showing the proportion of high-confidence β-TRCP motifs (n = 29), with position 4 residues that rank in the top 25% most disruptive based on the hydrophobicity and β-sheet indices detailed above. P value shows Fisher’s exact test (two-tailed).
Consistent with the current model, we found that S45 mutations generally produced weaker activation than mutations in the docking motif, both among single-nucleotide variants and across all substitutions (Fig. 3b). Nonetheless, MES values at the same position varied substantially (Fig. 3a,c). For example, S45T and T41S were well tolerated (Fig. 3c), reflecting the ability of CK1α and GSK3β to phosphorylate either serine or threonine29. Substitution of S45 for small amino acids (alanine, glycine) was also well tolerated (Fig. 2a). It has previously been reported that in-frame deletions at S45 still permit phosphorylation at T41, S37 and S33 in colon cancer cells30,31. Collectively, the data thus suggest that the absence of a large side chain at S45 enables β-catenin degron function without CK1α priming32.
Although the average effect of all T41 substitutions was intermediate, >98% in the COSMIC database are substitutions for alanine or isoleucine, which were the two strongest activating substitutions identified at this position. Both substitutions can be reached by one nucleotide change (Fig. 3c). This contrasts with S45, for which all eight strongest amino acid substitutions require at least two nucleotide changes (Fig. 3c). Therefore, strong activating S45 mutations are theoretically possible (for example, S45M, S45K) but are rarely observed in cancer, probably because they require at least two nucleotide changes.
Extending the current model19, our data show that T41A and T41I activate β-catenin more than many commonly observed docking-motif variants (for example, D32V, D32Y, D32H, S33P, G34R). Other mutations at T41 (T41N, T41P), which are rare but still recurrent in human cancer (Supplementary Table 1), elicit weaker activation in the lower range of S45 mutations. It is therefore evident that different substitutions at the same position can elicit markedly different effects on β-catenin signaling, refining our understanding of CTNNB1 mutational diversity.
I35 lies at the center of the docking motif, directly contacting β-TRCP, and is thought to require a hydrophobic amino acid side chain6,33. The I35 side chain projects into a cavity on the β-TRCP surface33 (Fig. 3d). MES values for I35 substitutions were broadly distributed (Figs. 2a and 3a) and negatively correlated with a hydrophobicity index at this position34 (Spearman ρ = −0.42; Fig. 3e). However, substitution of isoleucine for several polar amino acids (for example, threonine, asparagine, tyrosine) yielded low MES values (Fig. 2a), indicating that hydrophobicity is not essential. By screening 566 amino acid property indices35, we observed that the strongest correlations with I35 MES values were nearly all related to secondary structure propensities. A Spearman correlation of −0.79 was observed with the ‘normalized frequency of β-sheet’ index36 (Fig. 3f). Although residue I35 does not form a β-sheet in any available crystal structure, its dihedral angles place it clearly in the β region of a Ramachandran plot.
To ask whether this secondary structure requirement extended to other β-TRCP docking sites, we analyzed 28 high-confidence β-TRCP-dependent degrons containing the ‘DSGX’ motif37 (Supplementary Table 4). Position 4 residues in this motif (corresponding to I35 in β-catenin) were variable across substrates (Fig. 3g). Numerous substrates (eight out of 28) had position 4 amino acids that ranked in the 25% most disruptive on the hydrophobicity scale, whereas only one out of 28 featured in the same bracket of the β-sheet scale (Fisher’s exact test, P = 0.0248). Therefore, an extended backbone conformation, rather than side chain hydrophobicity, better explains the effects of I35 substitutions and potentially analogous positions in other β-TRCP docking motifs.
Tissue-specific CTNNB1 mutation patterns are driven by selection for optimal levels of β-catenin signaling
The frequency of CTNNB1 hotspot mutations varies across tumor types (Fig. 1c and Supplementary Fig. 1), probably reflecting multiple contributing factors. Stem cells in different tissues experience different genotoxic insults, which affect overall mutational spectra38,39 as well as the probability that specific CTNNB1 missense mutations become available for selection. Alternatively, or in addition, different tissue environments might favor selection for missense mutations causing levels of activation that are optimal, or ‘just-right’, for their spatio-temporal context2. The current data provide an opportunity to distinguish these possibilities.
Mutational probability, calculated from background nucleotide substitution rates, is a poor predictor of CTNNB1 mutation patterns in cancer40, suggesting a strong influence of selection. We computed ‘mutational likelihood scores’ (MLSs) for each of 342 hotspot missense mutations, using the background rates of nucleotide substitution in HCC and endometrial carcinoma whole-exome sequencing data (Supplementary Fig. 5a,b). These scores represent the probability of an amino acid substitution, given the dominant mutational biases seen genome-wide in coding sequences of CTNNB1-mutant tumors. MLS values correlated positively across tissues (Pearson r = 0.920 for all mutations, r = 0.655 for the single-nucleotide group; Fig. 4a) but did not predict observed mutation frequencies (Fig. 4b; negative binomial generalized linear model, no improvement over null model; PLRT = 0.77 and 0.60, respectively). Therefore, tissue-specific CTNNB1 mutation patterns cannot be explained solely by mutation rates.
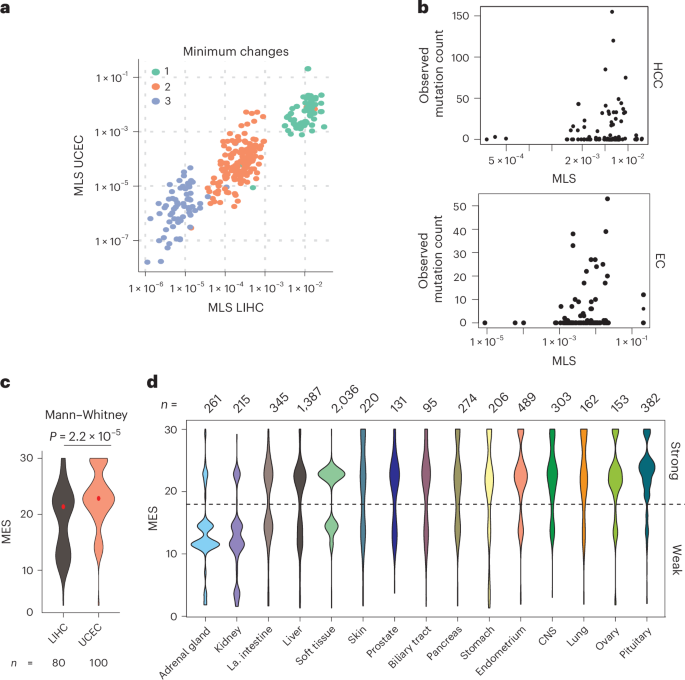
a, Relationship between MLSs (see Supplementary Fig. 5) in exomes of HCC (LIHC) and endometrial carcinoma (UCEC) tumors from TCGA. Scores are shown for all 342 possible amino acid changes, colored according to the minimum number of nucleotide substitutions required. b, Relationship between the observed frequency of specific CTNNB1 hotspot amino acid substitutions in the COSMIC database and MLSs calculated from LIHC and UCEC exomes from TCGA (see Supplementary Fig. 5). Only amino acid substitutions that can be reached by a single nucleotide mutation (>98% of observed mutations) are shown. EC, endometrial carcinoma. c, Violin plots show the distribution of MES values of CTNNB1 exon 3 hotspot mutations in LIHC and UCEC tumors from TCGA. P value shows two-tailed Mann–Whitney test without adjustment for MLS. d, The distribution of MES values in tumors from different primary sites in the COSMIC dataset. All tissue sites with >100 CTNNB1 exon 3 mutations are shown. Tissues are ordered according to the ratio of weak to strong hotspot mutations.
We next tested whether tumors arising in different tissues select for hotspot mutations that activate β-catenin signaling to different degrees. Mutations in The Cancer Genome Atlas (TCGA) endometrial carcinoma cohort (Uterine Corpus Endometrial Carcinoma, UCEC) were enriched for higher MES values (Mann–Whitney test, P = 2.2 × 10⁻⁵), whereas in TCGA HCC cohort (Liver Hepatocellular Carcinoma, LIHC), mutations spanned a broader range (Fig. 4c). This difference persisted following adjustment for tissue-specific background rates of mutation within coding sequences (P = 3.2 × 10⁻⁵). Given that mutation bias does not explain the tissue-specific difference in observed mutation frequencies, we postulate that they arise through natural selection for different optimal β-catenin signaling2.
Even greater variation in MES values was observed in the larger COSMIC dataset (Supplementary Table 1) across CTNNB1-mutant tumors from diverse tissue origins (Fig. 4d; one-way ANOVA, P < 2 × 10⁻¹⁹). Using MES distributions, tissues could be categorized as favoring high-effect mutations (for example, central nervous system), low-effect mutations (for example, kidney) or a broad or bimodal distribution (Fig. 4c). Bimodal distributions, observed in tissues such as large intestine and liver, comprised a lower-effect group, with mutations at S45 and weaker mutations within the β-TRCP docking motif (for example, H36P, D32Y, S33P), and a higher-effect group containing S33, G34, S37 and T41 mutations. These distributions highlight the potential for phenotypic variation arising from different CTNNB1 mutations among tumors with the same site of origin.
CTNNB1 mutation strength correlates with signaling activation and immune exclusion in HCC
To investigate how CTNNB1 mutation strength influences signaling and immune exclusion in human cancer, we focused on HCC, which shows frequent exon 3 mutations. Patients with single exon 3 missense mutations and available RNA-seq data in TCGA HCC cohort8 (n = 80) were initially stratified into low and high groups based solely on the MES value of their mutation (Supplementary Fig. 6a). However, copy number gains spanning CTNNB1 enhance signaling, especially for S45 mutant alleles19, so six patients with copy number gains spanning mutant alleles in the low MES group were reassigned (Supplementary Fig. 6b). This produced 53 patients predicted to have strong and 27 with predicted weak β-catenin pathway activation (Fig. 5a and Supplemental Fig. 6b). For patients in the weak group, 48% had mutations in the docking motif, compared to 77% of the strong group (P = 0.012; Fig. 5b)
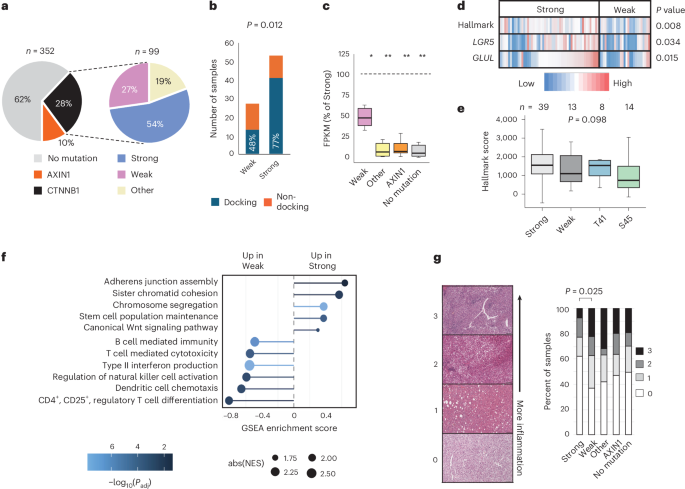
a, Proportion of HCC samples from TCGA cohort with CTNNB1 missense or AXIN1 coding mutations (left). The CTNNB1 missense mutations are then further divided into three categories (right): strong and weak mutations within the exon 3 hotspot (Supplementary Fig. 6b) and mutations that occurred elsewhere in the gene (other). A total of 18 further samples fell into more than one category or had deletions within CTNNB1; therefore, they were excluded. TCGA sample IDs and classifications are listed in Supplementary Table 9. b, Stacked histograms show the frequency and proportion of CTNNB1 exon 3 mutations from TCGA HCC cohort classified as weak or strong that lie in the docking site for β-TRCP (positions 32–37) versus elsewhere in the mutation hotspot. P value shows Fisher’s exact test (two-sided). c, Expression of n = 10 β-catenin target genes in HCC stratified by β-catenin pathway mutation status. For each gene, the median expression value was calculated across all samples in the indicated patient group, then expressed as a percentage of the median value for the same gene in the strong group (indicated by the dashed horizontal line at 100%). FPKM, fragments per kilobase per million. Solid horizontal lines show the median percentage value across all ten genes, boxes show the upper and lower quartiles and whiskers show the range. *P < 4 × 10⁻³, **P < 1 × 10⁻⁴ from negative binomial generalized linear model (two-sided), with Tukey’s adjustment for a family of five estimates. Gene-level data are shown in Supplementary Fig. 7a. d, Heatmap representation of β-catenin pathway activation for TCGA HCC samples with exon 3 hotspot mutations separated into weak and strong categories. LGR5 and GLUL are individual HCC targets. ‘Hallmark’ indicates a multi-gene score calculated across 42 genes known to be activated by the accumulation of β-catenin (Hallmark wnt_b-Catenin gene set, MSigDB). P values show one-tailed t-tests. e, Boxplots show Hallmark β-catenin target gene set activation in TCGA tumors with strong or weak mutations in the docking motif, compared to those with mutations at T41 or S45. Horizontal lines show the median value, boxes show the second and third quartiles and whiskers show the range. Samples with copy number gain spanning lower-effect mutations (n = 6) were excluded. Differences between groups were not significant in a one-way ANOVA (P = 0.098). f, Enrichment of Gene Ontology terms in transcripts ranked among the most upregulated in pairwise comparisons between strong and weak CTNNB1-mutant HCC samples from TCGA. Terms were selected from the full list shown in Supplementary Table 6. Normalized enrichment scores (NES) show enrichment scores normalized to the size of the gene set. P value estimation is based on an adaptive multi-level split Monte Carlo scheme, adjusted for multiple testing using Benjamini–Hochberg correction. GSEA, gene set enrichment analysis. g, H&E tumor sections from TCGA were scored using an ordinal scale according to the level of inflammatory infiltrate from zero (no visible immune cells) to three (diffuse or nodular aggregates of immune cells), then scores were compared across patients based on β-catenin pathway mutation status. P value shows Fisher’s exact test (two-way) for differences between weak and strong groups in the fraction of patients with an immune score of zero versus one or greater. Statistical analysis was not performed on other groups.
To assess the effects of other mutations in the β-catenin pathway, we compared transcript levels for ten liver β-catenin target genes in HCC tumors with hotspot missense mutations versus no CTNNB1 pathway mutation. We included missense mutations in CTNNB1 outside the hotspot region (‘other’; n = 19; Fig. 5a), including positions 335, 383 and 387, which disrupt interaction with the destruction complex subunit APC41, giving a total of 99 CTNNB1 missense mutation cases in the TCGA HCC cohort (n = 80 hotspot, n = 19 other). A further 10% of the cohort had coding mutations in AXIN1 (n = 36), another destruction complex subunit and known HCC driver8,42. The remainder of the cohort had no CTNNB1 or AXIN1 mutation (‘no mutation’; n = 217).
Tumors in either the weak or strong hotspot class showed markedly higher β-catenin target gene expression compared to the ‘no mutation’ group (Fig. 5c and Supplementary Fig. 7a). Tumors with ‘other’ mutations in CTNNB1, or AXIN1 mutations, expressed these targets at levels comparable to the ‘no mutation’ samples (Fig. 5c and Supplementary Fig. 7a). Therefore, although AXIN1 and non-hotspot CTNNB1 mutations contribute to HCC development, their effects on β-catenin target gene expression differ from both weak and strong hotspot mutations16,42,43,44.
As predicted by our screen, β-catenin targets were expressed at significantly higher levels in tumors from the strong versus weak patient group (Fig. 5c,d and Supplementary Fig. 7a). This was observed across all ten liver target genes in the curated set (median 49% reduction in transcript levels for the weak group (Fig. 5c and Supplementary Fig. 7a). Tumors with weak exon 3 mutations also displayed significantly lower expression scores for the Hallmark CTNNB1 target gene set from MSigDB (37% median reduction, P < 0.01; Fig. 5d). The same trend was confirmed in a second independent HCC cohort (Montironi cohort)14 (Supplementary Fig. 7b). β-catenin pathway activation in tumors with T41 mutations was comparable to that of strong β-TRCP docking motif variants, with both groups showing non-significant trends towards higher activation than tumors with the weak docking motif or S45 mutations (one-way ANOVA, P = 0.098; Fig. 5e). Overall, weak mutations still activated β-catenin targets, but at intermediate levels compared to strong mutations and non-mutated tumors (Fig. 5c and Supplementary Fig. 7a).
Transcriptome-wide, genes upregulated in strong versus weak HCC samples were significantly enriched for the Gene Ontology term ‘canonical Wnt signaling pathway’ as well as terms associated with proliferation and stem cell function (Fig. 5f, Supplementary Fig. 8 and Supplementary Tables 5 and 6). Notably, the telomerase subunit TERT was among the most significantly upregulated genes (Supplementary Table 5). TERT may be a direct transcriptional target of β-catenin regulation45, and activating mutations in the TERT promoter are among the most frequent HCC driver mutations8,46.
Genes upregulated in tumors with weak versus strong exon 3 mutations were significantly enriched for terms associated with immune cell infiltration (Fig. 5f and Supplementary Table 6). Given that β-catenin signaling activation is a major immune escape pathway in several tumor types, including HCC15,47, weaker pathway activation may permit greater immune engagement, with potential implications for patient stratification and targeted therapy15,48,49. Consistent with this idea, tumors with weak CTNNB1 mutations showed upregulation of canonical T cell transcripts (Supplementary Fig. 9) to levels similar to tumors lacking CTNNB1 mutations. In addition, histology confirmed more frequent immune cell infiltration in weak versus strong mutant tumors (65 vs 38% with a score of >1, Fisher’s exact test, P = 0.0245; Fig. 5g). Altogether, CTNNB1 exon 3 hotspot MES scores derived from a cell-autonomous reporter assay predict not only β-catenin signaling strength in HCC, but also clinically relevant phenotypes associated with the tumor microenvironment (Fig. 5f,g and Supplementary Fig. 9).
First Appeared on
Source link

