Aging clocks delineate neuron types vulnerable or resilient to neurodegeneration and identify neuroprotective interventions
C. elegans culture
Nematodes were cultured on nematode growth medium (NGM) agar plates at 20 °C under standard conditions unless stated otherwise. All age statements given in this publication consider the first day of adulthood as day 1. A complete strain list can be found in the Supplementary Information.
Special care was exerted for maintaining the cultures (specifically for maintaining the strains carrying extrachromosomal arrays): To maintain good expression levels in each population, healthy-looking adults with strong, but not extreme, fluorescence were passaged. Without this careful selection, the fluorescence signals were lost over the course of a few generations.
Age synchronization for experiments was achieved by L4 picking. For all experiments, individuals displaying a medium to strong fluorescence were selected (this group consists of about 85% of the fluorescent nematodes); individuals with neither exceptionally strong fluorescence (≈3–5% of the fluorescent nematodes) nor weak fluorescence (≈5–10% of the fluorescent nematodes) were selected for experiments or passaging. The same criteria were applied when L3 larvae were selected for experiments.
Neurite imaging
Nematodes were synchronized by L4 picking and grown for 1 day, 4 days or 7 days. For imaging, nematodes were placed in a drop of 250 mM NaN3 on a 2% agarose pad. Imaging was performed on a Zeiss Imager.M2 at a magnification of ×400. z-stacks of nematode heads/tails were acquired using 2-µm step width. Acquisition time was set between 100 ms to 3 s per plane to achieve a good signal-to-noise ratio.
Scoring of neurite degeneration
Recorded z-stack images of neurons were analyzed manually, counting blebs, large spherical outgrowths, branching, breaks and necrosis on the dendrites of the analyzed neurons. Images were classified according to the degree of aberration: necrotic neurons, broken or truncated neurons, neurons with ≥10 blebs or ≥3 outgrowths were scored as ‘severely damaged’; neurons with 5–9 blebs, or 2 outgrowths were classified as ‘mildly damaged’; and neurons with <5 blebs or <2 outgrowths were classified as ‘healthy’. See Fig. 2b for exemplary images.
Ordinal regression analysis—CLM
To statistically assess neuronal damage across conditions and time points, we used CLMs using the ordinal package in R. A logit link function was applied to estimate the cumulative probabilities of increasing damage severity. For neuron-specific analyses of damage progression over time, the time point was modeled as a numeric predictor (L4 = 0, day (D) 1 = 1, D4 = 4, D7 = 7), and separate CLMs were fit for each neuron type. Observed neuron counts per category were incorporated as weights using the weights argument. P values for the slope term were adjusted for multiple testing across neurons using the Benjamini–Hochberg method. To compare damage susceptibility between neuron types, a full model including neuron identity, time point and their interaction was fit (score ~ neuron × age). Estimated marginal means were computed using the emmeans package, and Tukey-adjusted P values were reported for all pairwise neuron contrasts. For comparisons between two conditions (for example, treatment versus control), we modeled the score as a function of the condition only (score ~ condition), again using CLMs with logit link and frequency weights. Multiple-testing correction across neurons was performed using the Benjamini–Hochberg method, where applicable.
Compound treatment
Standard NGM plates, seeded with OP50, were inactivated with 500 mJ/cm2 of 251-nm UV-C light (Stratalinker 2400) and afterward were subjected to compound coating by dropwise addition of compounds directly to the agar surface. Plates were dried for at least 1 h before transferring L4-stage nematodes onto them. Nematodes were incubated with the compounds for 24 h and then used for neurite imaging. The final concentration of compounds was: CHX, 2 mM; syringic acid, 2.5 mM; vanoxerine, 10 nM; WAY-100635, 25 nM; (S)-(−)-Bay K8644, 250 µM; resveratrol, 200 µM. Control nematodes were incubated on appropriate solvent control-coated plates (either water, for syringic acid and WAY-100635, ≤5‰ DMSO, for CHX and vanoxerine, or 1‰ ethanol, for resveratrol).
Pathogen avoidance assay
S. marcescens Db11 bacteria were inoculated into LB medium with kanamycin, tetracycline and streptomycin from glycerol stock and incubated overnight with shaking at 150 rpm at 25 °C. Control E. coli OP50 bacteria were grown in LB medium without antibiotics and incubated overnight with shaking at 150 rpm at 37 °C. NGM plates (6 cm) were cast 3 days before seeding. The plates were seeded with 350 µl bacterial solution, generating a perfect round spot in the middle of the plate and allowed to dry for 2 h. For compound treatment, 2.5 mM syringic acid or 25 nM WAY-100635 was added before seeding and allowed to dry. Around 15–30 L4-stage nematodes of strains JKM10, IG10 and MT21910 were added directly into the bacterial lawn and incubated for 48 h. Nematodes were scored for their presence on or avoidance of the lawn. Five independent cohorts of 4–5 plates each were analyzed, and the position of the nematodes was checked four times with a 5-min interval time. The aversion index was calculated as the number of nematodes outside the lawn divided by total number of nematodes. Potential compound metabolization by the living Db11 bacteria has been tested in prior experiments.
Testing compound metabolization
For testing compounds and pathogen avoidance from S. marcescens Db11, bacteria could not be inactivated with UV irradiation because it would negate the aversion behavior. To test whether Db11 bacteria would metabolize the compounds, a test treatment was performed: 2.5 mM syringic acid or 25 µM WAY-100635 was incubated with living or dead Db11 bacteria for 2 days; afterward, bacteria were removed by sterile filtration and the compound-containing flowthrough was applied on UV-inactivated OP50. L4-stage JKM10 nematodes were placed on these plates, and neurodegeneration was assessed 24 h later. There was no significant difference between the compounds that were pretreated with living or dead Db11 bacteria (Extended Data Fig. 6h–j).
Salt aversive conditioning assay
Adapted from Lim et al.25, nematodes were synchronized by L4 picking and grown for an additional day to their first day of adulthood, then nematodes were rinsed off the plates with M9 medium and washed twice with M9. The nematodes were split into two groups and salt-free conditioning medium or salt-containing conditioning medium (1 mM CaCl2, 1 mM MgCl2, 5 mM KPO42− pH 6.0, ±20 mM NaCl) was added. Subsequently, nematodes were incubated at 20 °C rotating at 20 rpm for 3 h.
Assay plates (3.5 cm; 2% (wt/vol) ager, 1 mM CaCl2, 1 mM MgSO4, 5 mM KPO42− pH 6.0) were cast 2 days before the experiment. To establish the NaCl gradient on the assay plates, agar plugs containing 100 mM NaCl (2% (wt/vol) agar, 100 mM NaCl, 1 mM CaCl2, 1 mM MgSO4, 5 mM KPO42− pH 6.0) were placed on one side on the plate and incubated at 23 °C for 3 h. After the gradient was established, salt-agar plugs were removed and 3 µl 500 mM NaN3 was added to the spot where the plug was placed. An additional 3 µl 500 mM NaN3 was added to the opposite site of the plate, and the plates were directly used for the assay.
After 3 h of conditioning, excessive medium was removed, and nematodes were transferred onto the center of the prepared salt-gradient assay plates. Nematodes were allowed to crawl freely on the plate according to their preferences for 30 min and at 20 °C. Afterward, nematodes that remained on the origin, that moved toward high salt and those that moved toward low salt were counted, and the chemotaxis index was calculated as: ci = (number on high salt – number on low salt) / (total number – number on origin).
For CHX treatment, nematodes were synchronized by L4 picking and placed on an OP50-seeded NGM plate, coated with 2 mM CHX, for 24 h. After compound incubation, the nematodes were processed as described above.
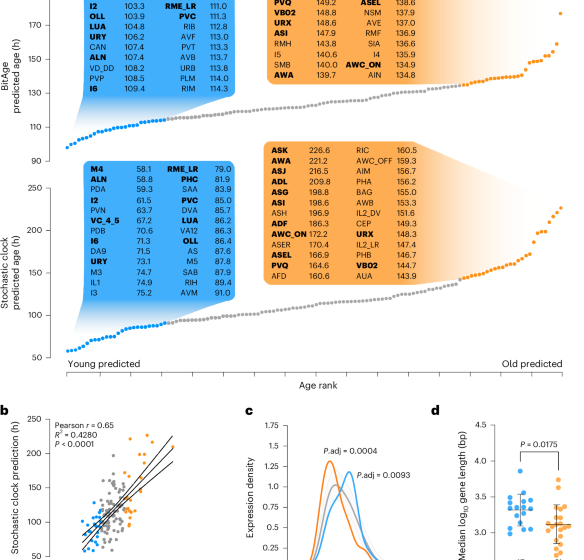
BitAge prediction
The BitAge clock10 was used as described previously. Briefly, each sample was binarized, that is, genes higher than the median expression value within each sample after removing genes with zero counts, were set to 1, and the remaining genes to 0. The BitAge coefficients for the 576 clock genes are added up for all genes in a given sample that is 1 after binarization. After adding the BitAge intercept, the results show the predicted biological age. For the Calico dataset, only single-neuron types were considered, that is, cells annotated as multiple neuron types were excluded. For neuron types with two biological replicates, the predicted biological ages of the replicates were averaged to obtain a single age prediction per neuron type.
Stochastic data-based clock
The Stochastic Clock was used as described previously12. Briefly, each sample was log10-transformed after the addition of one pseudo-count. Subsequently, the samples were min–max normalized to bring each sample within the range (0, 1), and then binarized as described above. The normalized counts were then added up for all 1,010 stochastic data-based clock genes. For the Calico dataset, where some neuron types had two biological replicates, the predicted biological ages of the replicates were averaged to obtain a single age prediction per neuron type. Note that the Stochastic Clock might result in slightly different genes every time a clock is trained.
Gene length analysis
First, we downloaded the differentially expressed genes for each neuron type and all other cells in the CeNGEN14 dataset (https://cengen.shinyapps.io/CengenApp/) with the statistical test ‘Wilcoxon on single cells’. This gives a list of genes with logFC, and percentage expression in the specific neuron type and all other cells. We further filtered this list of significant genes by requiring that the gene is expressed in at least 90% of cells of the specific neuron type and at most 10% in all other cell types. In total, 39 neuron types had no genes with these requirements, that is, 89 neuron types were used for further analysis. Next, we used the such-defined marker genes of the 20% oldest (57 genes) and respective 20% youngest neurons (67 genes) and calculated the density distribution of the log10-normalized gene lengths. To calculate a two-sided permutation test, we calculated the median log10 gene length of the genes and compared it to the 100,000-permutation median. The permutation for the old marker genes used 57 genes, while the permutation for the young marker genes used 67 genes of all marker genes (303) of the 89 neuron types.
In a complementary analysis, we calculated the median log10 gene length of the marker genes for each of the neuron types individually. These median values were correlated with the predicted biological age using a Pearson correlation and visualized with a linear regression plot.
Definition of NeuronAge
To quantify transcriptomic aging patterns across neuronal cell types, we defined NeuronAge as the correlation between gene expression and predicted biological age with BitAge. TPM values for all 128 neuron types were obtained from the CeNGEN transcriptomic dataset, and each of the 18,475 genes was z-score normalized across all 128 neuron types. Predicted ages for the same neurons were derived using the BitAge clock. For every gene, we calculated the Pearson correlation between its z-scored TPM values and the predicted ages across all 128 neuronal cell types. The resulting correlation coefficients represent the NeuronAge transcriptional signature.
Neuronal connectome mapping
We downloaded and adapted the Cytoscape file from Cook et al.26 by adding head neurons, deleting nonneuronal cell types and color coding neurons by their predicted Age with BitAge on the CeNGEN dataset.
Median total number of synapses calculation
The NeuroType.xlsx file was downloaded from https://www.wormatlas.org/neuronalwiring.html. For each of the 128 neuron types, we summed the median total number of synapses in the head, tail and mid-body.
Fuzzy clustering
To identify transcriptional patterns associated with the predicted neuronal age, we ranked the 128 neuron types based on their predicted age and grouped them into five bins: (1) [97, 110], (2) [110, 120], (3) [120, 130], (4) [130, 140] and (5) [140, 180]. Within each bin, we computed the median expression level for each gene. To make the genes comparable and bring them onto the same scale, we calculated the z-score across the five bins for each of the 9,950 genes with nonzero standard deviation. Next, we used fuzzy clustering with Mfuzz (v2.58.0)74 to identify transcriptional clusters across the predicted age bins. The elbow method was computed with the Dmin function of Mfuzz and indicated an optimal number of four clusters. The genes belonging to each cluster were subsequently used for a pathway enrichment analysis with clusterprofiler (v4.9.2.002)75, with maxGSSize = 500 and the list of all 9,950 genes as the background gene list. All significantly enriched pathways (adjusted P < 0.05) were identified, and redundant pathways were collapsed using semantic similarity filtering. Although this procedure substantially reduced redundancy, the remaining number of nonoverlapping pathways was still too large to display comprehensively in a single figure. For visualization purposes, we therefore selected a representative subset of pathways from each cluster based on (i) statistical significance, (ii) effect size and (iii) biological interpretability.
Heat map
We processed several public datasets (GTEx dataset48, the TMS dataset76 and an additional mouse hypothalamus aging cohort (GSE157025), young serum injections77, platelet factor PF4 (ref. 78), sport in humans79, krill oil in C. elegans80) for the heat map:
-
1.
TPM-normalized gene expression values for human brain tissues from the GTEx v8 data81 release (that is, amygdala, anterior cingulate cortex, caudate basal ganglia, cerebellar hemisphere, cerebellum, cortex, frontal cortex, hippocampus, hypothalamus, nuclear accumbens basal, putamen basal ganglia, substantia nigra) were correlated with the chronological age (the midpoints of the publicly available age bins).
-
2.
The mouse aging time course for hypothalamus data from GSE157025 was downloaded and a gene-wise correlation with the chronological age calculated.
-
3.
Whole-brain data from the TMS (GSE132040) was downloaded and edgeR (v3.40.2)82 was used to calculate normalized expression values. The normalized expression values were correlated to the chronological age.
-
4.
Differentially expressed genes for mouse hippocampus data treated with the platelet factor PF4 or saline control were downloaded from GSE173254. We multiplied the logFCs by −1 to always compare treatment versus control, instead of control versus treatment.
-
5.
Differentially expressed genes for mouse hippocampus data treated with young serum or sham were downloaded from GSE234667.
-
6.
C. elegans whole-nematode data treated with krill oil from GSE207152. We used edgeR (v3.40.2)82 to calculate normalized expression values and calculated z-scores for each gene over all samples. The z-score-normalized expression values were used for a regression model: \({\rm{expression}}=\,{\beta }_{0}+{\beta }_{1}\times {\rm{Age}}+{\beta }_{2}\times {\rm{Krilloil}}+{\beta }_{3}\times ({\rm{Age}}\times {\rm{Krilloil}})\), where \({\beta }_{0}\) is the intercept term, \({\beta }_{1}\) is the coefficient for the Age variable, \({\beta }_{2}\) is the coefficient for the Krilloil-treatment variable, and \({\beta }_{3}\) is the coefficient for the interaction between Age and Krilloil, that is, the difference in the slope over age.
-
7.
Differential expressed genes upon physical activity were downloaded from the supplementary data (Supplemental Table 2) from Berchtold et al.79.
The Pearson correlation values of all genes of (1)–(3), the logFC of all genes for (4) and (5) and the \({\beta }_{3}\) coefficients for (6) were used to calculate enriched pathways analysis with fgseaMultilevel from the fgsea R package83 and with nPermSimple = 1,000 for all conserved KEGG pathways between C. elegans, mouse and humans. For (7), the ‘anti-aging/Alzheimer’s disease’ genes were split into genes that are upregulated and, respectively, downregulated upon exercise. Both gene sets were used for an enrichment analysis with enricher from enrichplot v1.18.0 with maxGSSize = 500 and minGSSize = 5, and all genes were quantified in the supplementary data from Berchtold et al.79 as the background gene list. For both enrichment analyses, the enrichment fold change, that is, the number of observed genes per pathway divided by the number of expected genes per pathway, was calculated. Finally, the fold changes were combined, that is, pathways with a bigger fold-change enrichment in the downregulated genes were multiplied by −1.
The clustering was done on the normalized enrichment scores for (1)–(6) and the fold change enrichment score for (7) with the Ward method and a correlation distance matrix.
Heat map with logFC
For the heat map with differentialy expressed genes, we processed the data in the following way:
-
1.
CeNGENApp (https://cengen.shinyapps.io/CengenApp/) was used to find differentially expressed genes between the ten oldest predicted CeNGEN neurons (according to BitAge) and the ten youngest predicted neurons. The differentialy expressed genes were calculated with the ‘Pseudobulk:Wilcoxon’ statistical test.
-
2.
Raw gene expression values for human brain tissues from the GTEx v8 data81 release (that is, amygdala, anterior cingulate cortex, caudate basal ganglia, cerebellar hemisphere, cerebellum, cortex, frontal cortex, hippocampus, hypothalamus, nuclear accumbens basal, putamen basal ganglia, substantia nigra) were normalized with edgeR and differentially expressed genes calculated between old (≥70 years) and young (≤40 years).
-
3.
The whole-brain data from the TMS (GSE132040) were normalized with edgeR (v3.40.2)82, and differentially expressed genes were calculated between old (≥21 months) and young (1 month) mice.
-
4.
The mouse aging time course data for the hypothalamus from GSE157025 were normalized with edgeR (v3.40.2)82, and differentially expressed genes were calculated between old (24 months) and young (5 day) mice.
The enriched pathways were computed as described above.
CMAP
The CMAP resource uses the L1000 array, which measures 978 landmark transcripts, which can be used to infer most of the remaining transcriptome with high accuracy13. Here we used all available L1000 datasets for a human differentiated neuronal cell line. We downloaded the aggregated level 5 L1000 Connectivity Map13 data from GSE92742 and performed pathway enrichment analysis with fgseaMultilevel from the fgsea R package83 with nPermSimple = 1,000 and the conserved KEGG pathways between human and C. elegans for each of the samples in the level 5 dataset. To compare it to the NeuronAge pattern, we first calculated the z-score of each gene that has at least some gene counts across the 128 neurons of the CeNGEN dataset. We correlated these z-score-normalized genes with the biological age prediction from BitAge. The resulting Pearson correlation values for all genes were used for a pathway enrichment analysis with fgseaMultilevel and the conserved KEGG pathways between human and C. elegans. To identify whether any compound might revert the NeuronAge gene expression pattern on the pathway level, we correlated the normalized enrichment scores of the NeuronAge KEGG pathway enrichment analysis with all the normalized enrichment scores that we calculated from the CMAP dataset. Next, we filtered for only compounds that were tested in the neuronal cell line (‘NEU’). Compounds had to be tested at least twice, with all measurements resulting in correlations in the same direction. Additionally, we filtered for compounds that were measured at 24 h and 6 h and took only those compounds that showed a stronger correlation into the same direction at the 24-h time point compared to the 6-h time point. Lastly, we filtered out those compounds that had no information available at PubCHEM and used a correlation threshold of 0.25 (respective −0.25).
The assignment of known protective or detrimental compounds is based on literature reports: The glycogen synthase kinase 3 (GSK3) inhibitor AR-A014418 was shown to inhibit beta-amyloid-induced neurodegeneration84; the selective serotonin reuptake inhibitor fluoxetine protects against neurotoxicity and neurodegeneration85; the PPAR-alpha activator gemfibrozil exhibits neuroprotective effects via upregulating pro-survival factors and suppressing inflammation86; the kinase inhibitor sorafenib protects against neurodegeneration in C. elegans87; the selective aryl hydrocarbon receptor modulator 3,3’-diindolylmethane is neuroprotective and promotes brain-derived neurotrophic factor88; the insulin-sensitizing agent rosiglitazone exhibits neuroprotective effects in the eye and the brain89; the p38 MAPK inhibitor SB202190 was shown to reduce hippocampal apoptosis and rescue spatial learning as well as memory deficits in rats90; dibutyryl-cAMP-Na (dBcAMP) elevates cAMP levels and protects against neurodegeneration in stab wound or kainic acid injuries91; and the catecholamine-O-methyltransferase inhibitor tolcapone was shown to improve cognitive function92.
Bay K8644 is described to be neurotoxic70; and amiodarone induces neuronal apoptosis93 and is known to induce adverse neurological effects94. Tacedinaline/CI-994 is a class I histone deacetylase inhibitor, correlates positively with NeuronAge, and was shown to promote functional recovery following spinal cord injury95, and to enhance synaptic and structural neuroplasticity96. Likewise, resveratrol is potentially neuroprotective due to a hormetic response97, while there is evidence that it could lead to impaired brain integrity73.
Correlation of neurodegeneration and GFP expression
To test whether GFP expression induces neuronal aberrations, we correlated GFP expression intensity and blebbing. In brief, fluorescence images of PY6457 (ASK neurons) and OE3010 (ASJ neurons) nematodes at the first day of adulthood were recorded using an epifluorescence microscope. PY6457 and OE3010 were selected because they carry the neuron-type-specific GFP marker as an extrachromosomal array that has a strongly varying expressivity between individuals. Blebbing was observed as the major degeneration hallmark in ASJ and ASK neurons and, therefore, used as single correlation criterion. Four cohorts of 10–20 nematodes per strain were accumulated in single plots and the correlation was analyzed by Pearson’s correlation.
Analysis of stochasticity of neuron damage
To test if bleb appearance is fully random or linked to development of conserved structures along neurites, bleb distance from neurite start (at the site of the mouth) was measured using Fiji for every bleb on each neurite analyzed from three cohorts of 10–20 individual nematodes each. Relative positions of blebs were calculated by dividing the observed bleb’s position (for example, 55 µm) by the total length of the analyzed neurite (for example, 98 µm). Relative positions were displayed as a histogram using 12 bins, and data from three cohorts were aggregated. A Pearson correlation versus 100 random data tracks was done using GraphPad Prism 10.
To calculate 100 tracks of a random damage distribution, a Python script was used with the following assumptions: (1) a random number of blebs (in 8–20) can appear, matching observed biological variability; (2) new blebs appear primarily at random but are slightly more likely to occur near previously formed blebs, reflecting spatial clustering seen in vivo; (3) already established blebs increase chances of blebs in their vicinity; (4) blebs cannot appear at the same position; (5) the proximal 10% of the neurite corresponds to the ciliary region, where structural complexity and imaging artifacts reduce the detectability of blebs, and this was modeled by suppressing bleb placement in this region; (5) neurite lengths were randomly sampled within the empirically observed range (80–100 µm).
All simulation parameters, including neurite length distributions, bleb counts, clustering strength and the extent of the protected proximal region, were derived directly from empirical measurements of ASJ, ASK and OLL neurons imaged in vivo. For each simulated neurite, bleb positions were generated iteratively and normalized to neurite length to match the experimental measurements. The resulting 100 simulated tracks were aggregated and compared to the observed data.
Neuron survival
Nematodes of strains JKM10 (URY neurons), OH1422 (OLL neurons), NY2067 (ASE neurons), MT21910 (I2 neurons) and PY6457 (ASK neurons) were synchronized by L4 picking. Only nematodes that showed a easily visible fluorescence under a dissecting microscope were selected and singled onto OP50-seeded NGM plates.
The presence of the neurons was scored daily. Nematodes were passaged every second day to a fresh plate. Individuals were tracked over the course of 12 days or until they died, or until all GFP-marked neurons disappeared.
Neuron loss was analyzed according to Kaplan–Meier using the accumulated data from three cohorts of each of the 12 individuals (totaling 36 nematodes per strain), and significant differences were assessed by a log-rank test.
Additionally, the first day a neuron degenerated in every single individual was scored and plotted as a histogram showing the incidence of first neuron death.
SUnSET assay
Wild-type nematodes were synchronized by L4 picking (≈75 nematodes per cohort and condition) and placed on OP50-seeded NGM plates coated with 2 mM CHX or DMSO as control. After 24 h, plates were rinsed with S-Basal, and nematodes were collected in 1.5-ml tubes. Nematodes were washed once with S-Basal. Freshly grown OP50 bacteria were pelleted by centrifugation (20 min at 4,000 rpm at 12 °C) and resuspended in 0.1 Vol. S-Basal.
Nematodes were resuspended with 200 µl of the concentrated bacteria. Puromycin was added to a final concentration of 500 µg ml−1 and topped up to 1 ml with S-Basal. CHX-treated samples were supplemented with 2 mM CHX additionally. Puromycin labeling was performed for 3 h, and nematodes were rotating at 20 rpm on a spin wheel at 20 °C.
Afterward, nematodes were washed thrice with S-Basal to remove residual puromycin. Finally, nematodes were resuspended in 30 µl 4xSDS-Sample buffer, boiled at 95 °C for 5 min and then stored at −20 °C.
Frozen samples were thawed and boiled at 95 °C for 5 min. In total, 15 µl of lysate was loaded on a 12% SDS–PAGE and run at 30 mA for 2 h. Western blot transfer onto a nitrocellulose membrane was performed using Trans-blot Turbo (Bio-Rad) according to the manufacturer’s specifications (running at 2.0 A for 10 min).
Membrane was rinsed with TBS-T, Ponceau stain was applied, and imaging was performed. Ponceau staining was washed out three times with TBS-T. Membrane was blocked for 2 h in TBS-T + 5% (wt/vol) milk powder. Primary antibody incubation was done with 4G11 anti-puromycin antibody from mouse (1:1,000 dilution) in TBS-T + 2.5% (wt/vol) milk powder at 4 °C with shaking overnight. Afterward, membrane was washed three times with TBS-T and incubated with horseradish peroxidase-conjugated anti-mouse antibody (1:5,000 dilution) for 2 h. Blot was developed using ECL solution (Pierce) in an Amersham Imager 600. The acquisition time was ≈2 min.
Fluorimetry on CHX-treated nematodes
Nematodes of strains JKM10 (URY neurons), OH1422 (OLL neurons), NY2067 (ASE neurons) and PY6457 (ASK neurons) were synchronized by L4 picking. Three cohorts per strain and condition (totaling 28–52 nematodes) were used for epifluorescence microscopy. Nematodes were prescreened to find the highest fluorescence intensity per strain; imaging settings were adjusted to not overexpose the nematode with the strongest fluorescence per strain. Imaging was performed on L4 larvae; the remaining L4 larvae from synchronization were subjected onto OP50-seeded NGM plates coated with 2 mM CHX or DMSO control and imaged after 24 h. Imaging settings were kept constant within strains. Imaging settings were kept constant between cohorts. Background fluorescence was subtracted. The mean ± s.d. was displayed as a swarm plot, and ANOVA + Tukey post hoc test were performed.
Longitudinal CHX treatment
Three cohorts of nematodes expressing GFP in ASE, ASJ, ASK or OLL neurons have been treated with 2 mM CHX for either 24 h or 96 h starting from stage L4 onward. Neurite imaging was performed on day 4 of adulthood. Damage classification in ‘healthy’, ‘damaged’ and ‘severely damaged’ neurons was done as described in the main text. Ordinal regression (CLM) was used to test for significant differences (using Python 3.12 library: statsmodels: 0.14.3).
Statistics and reproducibility
All data are presented as the mean ± s.d. Number of cohorts (ℕ), individuals (n) and technical replicates (N) are stated in the figures and their respective figure legends. The applied statistical tests are mentioned in the figure legends, and the respective P values are directly reported in the diagrams. All statistics are two sided unless stated otherwise. Data normality was assessed by the Shapiro–Wilk test. Independent t-tests were calculated with Python’s SciPy98 v1.5.1 stats.ttest_ind function. One-way ANOVA’s were calculated with Python’s pingouin99 v0.3.6 ANOVA function and the parameter ss_type = 2. Cohen’s h100 as a measure of effect size was calculated by hand with Python’s NumPy101 v1.18.5. Plots were generated with Python’s Seaborn102 v.0.11.0, matplotlib103 v.3.3.0 or GraphPad Prism 10. Scatterplots showing a linear regression model fit are shown with a 95% confidence interval. No statistical method was used to predetermine sample size. Sample sizes were determined based on established practices in the field and on empirical considerations. Group sizes of 10–30 animals were used for neurite degeneration scoring, and for chemotaxis assays 50–100 animals were used to balance practical feasibility and the ability to detect meaningful biological effects. No method of randomization was used to assign nematodes to experimental groups. Researchers were blinded during data analysis (folders/images were listed and assigned random alphanumeric IDs before analysis; after analysis, files were named back accordingly). If nematodes were damaged during handling, results from them were censored; whole-nematode cohorts were excluded if less than 80% of the desired animals survived until analysis day, or if nematodes were growing slowly (delayed by at least a day compared to usual growth rate of the respective strain) or were apparently sick (slow movements, begging, lethargic; this affected one cohort of MT21910 L4s in Fig. 2c and one subgroup of JKM10 in Fig. 6e).
Reporting summary
Further information on research design is available in the Nature Portfolio Reporting Summary linked to this article.
First Appeared on
Source link

