Tumour–brain crosstalk restrains cancer immunity via a sensory–sympathetic axis
Mice and in vivo procedures
KrasLSL−G12D/+; p53fl/fl (KP) mice have been described previously55. KP mice were crossed with Rosa26LSL−tdTomato mice to generate KP; LSL-tdTomato mice. Wild-type C57BL/6 J, Trpv1-cre, Rosa26LSL−DTR (LSL-DTR), Vglut2-cre, Baf53b-cre, Pparγfl/fl and CD11c-cre mice were purchased from The Jackson Laboratory. Trpv1-cre and LSL-DTR mice were crossed to produce Trpv1-cre; LSL-DTR mice. Npy2r-IRES-cre and P2ry1-IRES-cre mice have been previously described14; they were crossed with LSL-DTR mice to produce Npy2r-IRES-cre; LSL-DTR and P2ry1-IRES-cre; LSL-DTR mice, respectively. Cryopreserved sperms of Trpv1-DTR mice were provided by M. Hoon (National Institute of Dental and Craniofacial Research); rederived Trpv1-DTR mice were crossed with KP mice to produce KP; Trpv1-DTR mice. BATF3-knockout mice were generously provided by M. Haldar. ADRB2 knockout mice were a gift from S. Thomas; they were crossed with Trpv1-cre; LSL-DTR mice to produce Trpv1-cre; LSL-DTR; Adrb2−/− mice.
For tumour induction in the autochthonous model, KP mice were intratracheally injected with 2.5 × 10⁸ plaque-forming units of Ad5mSPC-Cre virus (Viral Vector Core, University of Iowa). Tissues were collected 12–16 weeks post tumour initiation. In the orthotopic transplant model, 1.5 × 10⁵ KP cells were intravenously injected into the tail vein. The KP cell line was derived from autochthonously arising lung tumours in KP mice and stocked at low passage; they were cultured in DMEM (Corning) supplemented with fetal bovine serum (FBS, 10%; Gibco), L-glutamine (2 mM; Gibco), Penicillin-Streptomycin (50 U/mL; Gibco) at 37 °C with 5% CO2. Before injection, cells were washed 3 times with Hank’s balanced salt solution (HBSS) and resuspended at a density of 1.5 × 10⁶ cells/mL in endotoxin-free HBSS. Cells were tested negative for mycoplasma before use in all experiments. Tissues were collected 24–32 days post tumour cell inoculation.
For bone marrow chimera experiments, Npy2r-IRES-cre; LSL-DTR or Trpv1-cre; LSL-DTR mice were lethally irradiated with a Gammacell-40 Irradiator (5.5 Gy x 2, 3.5 h apart) and then retro-orbitally injected with 4-8 million bone marrow cells from donor mice. Sulfatrim (Pharmaceutical Associates, Inc) water was given for 2 weeks and changed twice weekly. Fecal pellets from unirradiated littermates were transferred to the chimeric mice for a period of 4 weeks after the removal of sulfatrim water to restore normal microbiota. Specifically, for mixed bone marrow chimera experiments, bone marrow cells from wild-type CD45.1 donors or Adrb2−/− donors were mixed in a 1:1 ratio with cells from CD11c-cre; Ppargfl/fl donors and then injected into the recipient mice as described above. Tumour induction was performed 7 weeks post bone marrow reconstitution. Reconstitution efficiency was confirmed by congenic markers to be above 95% in all experiments.
For DT-mediated ablation of VSNs, vagal nodose ganglia were surgically exposed under anaesthesia. Briefly, an incision was made along the ventral surface of the neck, and blunt dissection was applied. A micropipette containing 20 ng DT (Sigma-Aldrich) in 120 nL phosphate-buffered saline (PBS) as well as 0.05% Fast Green (Sigma-Aldrich) was inserted into the nodose/jugular complex. DT solution was injected using a Nanoject II injector (Drummond Scientific Company). The process was repeated for the VNG on the other side of the body. Surgical wounds were closed with CP Medical Sutures (661B, CP Medical). Subcutaneous injection of sustained release Meloxicam was provided as postoperative care. Mice were allowed to recover from surgery for 2-3 weeks before proceeding to downstream experimental procedures.
For chemical denervation of Trpv1+ VSNs, VNG were surgically exposed as described above. Each mouse was injected with 25 ng RTX (Santa Cruz) or vehicle (PBS) as well as 0.05% Fast Green per ganglion. The injection was repeated for the VNG on the other side of the body. Mice were allowed to recover from surgery for 3 to 4 weeks before proceeding to downstream experimental procedures.
For anterograde tracing of VSNs in lung tumours, VNG were surgically exposed as described above. A micropipette containing AAV-flex-tdTomato (Addgene 28306-AAV9) or AAV-eGFP (UNC AV5221), as well as 0.05% Fast Green FCF (Sigma-Aldrich) was inserted into the nodose/jugular complex. The process was repeated for the VNG on the other side of the body. Mice were allowed to recover for 2 weeks from surgery before proceeding to downstream experimental procedures. For retrograde tracing of lung-innervating sensory nerves, 5 μl of AAVretro-hSyn-flex-mCherry (Addgene 50459-AAVrg) was mixed with 45 μl of PBS and intratracheally injected to the lungs of tumour-bearing mice.
For chemogenetic manipulation of RVLM neurons, 200 nl AAV2/9-syn-DIO-hM4Di-mcherry or AAV2/9-CAG-Flex-GFP (Boston Children’s Hospital Viral Core) was injected into the RVLM at anterior–posterior −6.35, medial–lateral ±1.35, dorsal–ventral –6.3 relative to bregma (coordinates were identified using the Paxinos Mouse Brain Atlas). Subcutaneous injection of sustained release Meloxicam was provided as postoperative care. Mice were allowed to recover from the stereotaxic surgery before initiation of any experiments; mice with little or no reporter expression in the brain indicative of technical issues were removed from analyses. CNO (Fisher Scientific, A3317-50) was injected peritoneally (1 mg kg−1) twice daily starting on the same day of tumour inoculation.
For chemogenetic silencing of lung-innervating VSNs, 5 μl of AAVretro-hSyn-flex-mCherry (Addgene 50459-AAVrg), or AAVretro-hSyn-flex-hM4Di-mCherry (Addgene 44362-AAVrg) was mixed with 45 μl of PBS and intratracheally injected to mice. CNO was injected intraperitoneally (1 mg kg−1) twice daily starting 5 days post tumour inoculation and continuing till experimental endpoints. For chemogenetic activation of lung-innervating VSNs in healthy mice, 5 μl of AAVretro-hSyn-flex-mCherry (Addgene 50459-AAVrg), or AAVretro-hSyn-flex-hM3Dq-mCherry (Addgene 44361-AAVrg), was mixed with 45 μl of PBS and intratracheally injected. One dose of CNO was injected intraperitoneally (1 mg kg−1) 90 min before tissue collection.
For systemic CGRP blockade, BIBN4096 (Tocris) was intraperitoneally injected at 2 mg kg−1 daily; for lung local CGRP blockade, BIBN4096 (Tocris) was intratracheally injected at 3 µg per mouse every other day. Treatment was started one week post tumour inoculation or two days before tumour inoculation and lasted until the experimental endpoint.
For aerosolized salbutamol treatment, salbutamol sulfate (Selleck Chemicals) was dissolved in sterile saline to a concentration of 5 mg ml−1. Mice were placed into an aerosolized chamber connected to a PRONEB Max Aerosol Delivery System (PARI Respiratory Equipment) and treated with the salbutamol solution for 45 min daily. Mice in the control group were treated with aerosolized saline. Treatment started 1 day post tumour inoculation and lasted until the experimental endpoint.
For alveolar macrophage depletion, 50 μl of clodronate liposomes or control (Liposoma) was intratracheally injected to mice starting 1 day before tumour inoculation and every three days until the experimental endpoint.
For antibody-mediated T cell depletion, anti-CD4 (GK1.5, BioXCell), anti-CD8 (2.43, BioXCell), or their respective isotype controls were intraperitoneally injected twice weekly at a dose of 200 μg per mouse. Antibody injection was started one week post tumour inoculation and lasted until the experimental endpoint.
Male and female mice were both used at the age of 6 to 24 weeks; sex- and age-matched mice were randomly assigned to different treatment groups. For lung tumour experiments, mice were euthanized when they exhibited clinical signs of morbidity or met the criteria for euthanasia in accordance with IACUC guidelines. No limits were exceeded in any mouse experiments. Mice were housed in specific pathogen-free conditions, in a temperature-controlled (21–24 °C) and humidity-controlled (30–70%) environment maintained on 12 h:12 h light:dark cycles and provided with a standard rodent diet. All animal husbandry and procedures were performed in compliance with the Institutional Animal Care and Use Committee and the Institutional Biosafety Committee of the University of Pennsylvania, Yale University or St Jude’s Children’s Research Hospital.
Flow cytometry and FACS sorting
Mice were injected retro-orbitally with PE-CF594 conjugated anti-CD45 antibody (30-F11, BD Bioscience) 2 min prior to euthanasia to exclude the circulating immune cells from analysis. Lungs were collected, dissociated with the gentleMACS dissociator system (Miltenyibiotec), and digested with 125 U ml−1 Collagenase IV (Worthington Biochemical) and 100 U ml−1 DNase I (Roche) at 37 °C, 100 rpm for 30 min. Digested lung tissue was then filtered with a 100-μm cell strainer. Lymph node samples were grinded up and passed through a 70-μm cell strainer. Red blood cells were lysed with ammonium chloride–potassium bicarbonate (ACK) lysis buffer. After blocking FcR with the Fc block reagent (2.4G2, 1:200, BD Bioscience), single-cell suspensions were stained with the following antibodies: LIVE/DEAD Fixable Blue dye (1:1,000, L23105, Invitrogen), Alexa Fluor 532-I-A/I-E (M5/114.15.2, 1:800, 58-5321-82, invitrogen), Alexa Fluor 647-SIGLECF (E50-2440, 1:600, 562680, BD), Alexa Fluor 647-TCF1 (C63D9, 1:600, 6709S, Cell Signaling Technology), Alexa Fluor 700-Ki67 (B56,1:600, 561277, BD), APC/Cy7-I-A/I-E (M5/114.15.2, 1:2500, 107628, BioLegend), APC/Fire810-B220 (RA3-6B2, 1:800, 103278, BioLegend), APC-IRF8 (V3GYWCH, 1:600, 17-9852-80, Invitrogen), BUV395-CD45.1 (A20, 1:300, 565212, BD), BUV563-CD11c (N418, 1:800, 749040, BD), BUV615-CD44 (IM7, 1:1500, 751414, BD), BUV661-CCR7 (4B12,1:400, 741677, BD), BUV737-Ly6G (1A8, 1:800, 741813, BD), BUV805-CD11b (M1/70, 1:800, 741934, BD), BV421-CD86 (GL-1, 1:600, 105005, BioLegend), eFlour450-TCRd (GL3, 1:300, 48-5711-80, Invitrogen), BV570-CD8a (53-6.7, 1:600, 100740, BioLegend), BV570-CD90.2 (30-H12, 1:600, 105329, BioLegend), BV605-CD45.1 (A20, 1:1,000, 110736, BioLegend), BV605-CD45.2 (104, 1:400, 109841, BioLegend), BV605-CD45.2 (104, 1:600, 109836, BioLegend), BV605-TIM-3 (RMT3-23, 1:400, 119721, BioLegend), BV605-TNF (MP6-XT22, 1:1,000, 506329, BioLegend), PE-TNF (MP6-XT22, 1:1500, 506306, BioLegend), BV650-IL-17A (TC11-18H10.1, 1:600, 506930, BioLegend), BV650-XCR1 (ZET, 1:600, 148220, BioLegend), BV711- I-A/I-E (M5/114.15.2, 1:2,500, 107643, BioLegend), BV711-KLRG1 (2F1/KLRG1, 1:800, 138427, BioLegend), BV711-NK1.1 (PK136, 1:600, 108745, BioLegend), BV711-TIM-3 (RMT3-23, 1:300, 119727, BioLegend), BV750-CD11b (M1/70, 1:3,000, 101267, BioLegend), BV750-CD4 (GK1.5, 1:600, 100467, BioLegend), BV750-CD45.2 (104, 1:600, 109857, BioLegend), BV785-CD4 (GK1.5, 1:800, 100467, BioLegend), BV785-PD-1 (29 F.1A12, 1:800, 135225, BioLegend), BV786-SIGLECF (E50-2440, 1:500, 740956, BD), PE-Cy7-CD101 (Moushi101, 1:800, 25-1011-82, Invitrogen), APC-RORγt (B2D, 1:600, 17-6981-82, Invitrogen), eFluor450-ARG1 (A1exF5, 1:1,200, 48-3697-82, Invitrogen), PE-ARG1(A1exF5, 1:2,000, 12-3697-82, Invitrogen), FITC-CD103 (2E7, 1:500, 121419, BioLegend), FITC-IFNγ (XMG1.2, 1:500, 505806, BioLegend), FITC-Ly6C (AL-2T, 1:1,000, 127645, BioLegend), Alexa Fluor 488-TCF1 (C63D9, 1:600, 2203S, Cell Signaling Technology), PE/CF594-CD45 (30-F11, 1:200, 562420, BD), PE/Cy5-PD-L1 (10F.9G2, 1:2,400, 124344, BioLegend), PE/Cy7-PD-1 (RMP1-30, 1:600, 109110, BioLegend), PE-CD80 (16-10A1, 1:1,500, 555769, BD), PE-IL-12p40 (C15.6, 1:600, 554479, BD), PerCP/eFluor710-CD172a (P84, 1:1,000, 46-1721-82, eBioscience), PerCP/eFluor710-EOMES (Dan11mag, 1:700, 46-4875-82, eBioscience), PerCP-Ly6C (HK1.4, 1:800, 128028, BioLegend), Spark Blue 550-CD8 (53-6.7, 1:600, 100780, BioLegend), PE/Cy5-CD127(A7R34, 1:400, 15-1271-81, Invitrogen). For intracellular cytokine staining, cells were pre-incubated with the Cell Stimulation Cocktail (eBioscience) and the Protein Transport Inhibitor Cocktail (eBioscience) for 4 h at 37 °C before surface staining. Transcription factor staining was performed using the Foxp3 Fixation/Permeabilization Solution Kit (eBioscience). Flow cytometry was performed on the Cytek Aurora (Cytek Bioscience), and data were analysed using SpectroFlow (v.3.0.3, Cytek) and FlowJo software (v.10.5.3, Treestar).
For sorting, mouse lung tissues were digested as described above. Dissociated lung tissue was then filtered through a 100-μm cell strainer and single-cell suspensions were stained with surface antibodies on ice for 30 min before sorting. Dead cells were stained with the Zombie NIR fixable dye. FACS sorting was performed on a Cytek Aurora CS (Cytek Bioscience) and sorted cells were subjected to downstream RNA analyses.
Alveolar macrophage culture
Mouse bone marrow cells were cultured and differentiated into alveolar macrophage-like cells in Dulbecco’s Modified Eagle Medium (DMEM, Corning) medium supplemented with 10% heat-inactivated fetal bovine serum (FBS, Gibco), penicillin/streptomycin (Gibco), and L-glutamine (Gibco), mouse TGFβ (Peprotech, 2 ng ml−1) and mouse GM-CSF (Peprotech, 20 ng ml−1) for 9 days. Differentiated alveolar macrophages were treated with 10 μM noradrenaline (Sigma-Aldrich) only or together with TES prepared from autochthonous KP tumours. Cells were washed with Dulbecco’s PBS (DPBS) and collected 6 h after stimulation for RNA extraction.
VSN culture
Mouse VNGs were dissected out and first dissociated in HEPES buffered saline (Sigma) containing 1 μg μl−1 collagenase P (Roche) and incubated for 21 min at 37 °C. They were then dissociated in 0.25% trypsin (Gibco) at 37 °C for 10 min and neutralized with FBS-supplemented DMEM medium. Neurons in the cell suspensions were triturated with pipettes of decreasing size, then plated on laminin (114956-81-9, Sigma)-coated coverslips at 1 × 10³ cells per coverslip. Cells were analysed 36 to 40 h after treatment with LES, TCM or TES.
TES was prepared from lung tumours that were minced and digested in 2 mg ml−1 collagenase Type IV (Worthington Biochemical) plus 40 U ml−1 Dnase I (Roche) in RPMI at 37 °C. The digested tissue was then filtered through a 70-μm mesh screen. Cells were resuspended at 107 cells per ml concentration and cultured overnight in 24 wells with 1 ml complete medium supplemented with Hepes, penicillin-streptomycin and heat-inactivated FBS. Cell supernatant was collected the next day and spun down at 350g. For LES, the same procedures were carried out using healthy lung tissue. For TCM, KP tumour cell line was cultured until reaching 80% confluence. Cells were trypsinized, washed with PBS, resuspended with plain OptiMEM (ThermoFisher) to 7 × 10⁵ cells per ml, and plated at 10 ml per 10 cm dish. Cell supernatant was collected 24 h later, spun down at 350g, and filtered through a 0.22-μm filter.
For VSN and tumour cell co-culture, VSNs were seeded in laminin-coated coverslips together with KP tumour cells in 96-well-plates and cells were analysed 36 to 40 h after seeding. NGF-knockout tumour cells were generated by transducing KP cell line with lentivirus expressing CAS9 and sgRNA targeting NGF (GATCAGAGTGTAGAACAACATGG); KP tumour cells transduced with sgRNA targeting Rosa26 locus (GAAGATGGGCGGGAGTCTTC) were used as controls (sgCtrl). Efficient NGF deletion was confirmed by Western blot using anti-NGF antibody (Alomone Labs, AN-240).
For each VSN culture experiment, nodose ganglia neurons from 6–8 mice were pooled and plated with three technical replicates per treatment. To analyse neurite outgrowth from cultured VSNs, cells were fixed and stained for TUBB3. Immunofluorescence images were acquired using a Leica SP8 fluorescent microscope. For quantification, we randomly selected a minimum of six imaging fields per condition (at least two imaging fields per replicate) and analysed all neurons within those fields. Neurite length was measured for each VSN using a validated ImageJ tracer SNT macro10,56 (Fiji, v.2.9.0), and all image acquisition and analysis were performed in a double-blind manner.
Noradrenaline treatment of tumour cells
KP tumour cells were recovered from a frozen stock and passaged for 1 week before use. 10 μM noradrenaline was added to the KP tumour cells every 24 h. Adherent cells were collected after 3 days and the cell number was determined by haemacytometer-based counting.
Histology and immunofluorescence staining of lung tissue
Mouse lungs were fixed in 4% paraformaldehyde (PFA; Sigma) overnight and embedded in paraffin. H&E staining was performed by the Penn Vet Comparative Pathology Core at the University of Pennsylvania. H&E-stained slides were digitally scanned at 20× magnification with Aperio Console DX (v.102.0.4.46) using the Aperio ScanScope AT2 system, and tumour burden and tumour grade were blindly quantified from scanned images. Tumour burden was assessed by calculating the percentage of tumour area to the total lung tissue area using the QuPath software (https://qupath.github.io/); all five lobes were analysed for each mouse.
For immunofluorescence staining, 5-μm-thick sections of FFPE lungs were baked and deparaffinized with xylene (Sigma) and rehydrated using graded series of alcohol. Antigen retrieval was performed with a pressure cooker using 1 mM EDTA buffer (pH 8.0). After blocking, slides were stained with anti-ARG1 monoclonal antibody (93668, 1:250, Cell Signaling Technology) or anti-CD8a monoclonal antibody (4SM15, 1:250, Invitrogen). Images were acquired with ZEN3.1 (blue edition) using a ZEISS Axioscan 7.
Immunofluorescence staining of brain tissue
Mouse brain samples were fixed in 4% PFA (Sigma) overnight, dehydrated with sucrose, and embedded in OCT compound (23-730-571, Fisher Scientific). Cryosections were permeabilized with 0.1% Triton X-100, stained, and mounted with Fluoromount-G with DAPI (00-4959-52, Invitrogen). Antibodies used for immunofluorescence staining include anti-TH (AB1542, 1:500, Abcam) and anti-cFOS (2250, 1:300, Cell Signaling Technology). Images were acquired with LAS X (5.3.0) using a Leica Stellaris 8.
Immunofluorescence staining of ganglia
Mouse vagal nodose ganglia, DRG, or T3–5 sympathetic ganglia were fixed in 4% PFA (Sigma) overnight, dehydrated with sucrose, and embedded in OCT compound (23-730-571, Fisher Scientific). Cryosections were permeabilized with 0.1% Triton X-100, stained, and mounted with Fluoromount-G with DAPI (00-4959-52, Invitrogen). Antibodies used for immunofluorescence staining include anti-TUBB3 (ab190575, 1:1,000, Abcam), anti-HB-EGF (AF-259-NA, 1:800, R&D system, to detect DTR), anti-TRPV1 (ACC-030, 1:1,000, Alomone Labs), and anti-cFOS (ab222699, 1:1,000, Abcam). Images were acquired with LAS X (5.3.0) using a Leica Stellaris 8.
RNAscope in situ hybridization, imaging and quantification
RNAscope Multiplex Fluorescent v.2 assays (Advanced Cell Diagnostics) were performed according to the manufacturer’s instructions. Mice were transcardially perfused with freshly prepared 4% PFA. Brains were post-fixed in 4% PFA for 24 h at 4 °C before cryoprotection in a 10–20–30% sucrose gradient. Coronal sections (10 µm) containing the RVLM were cut on a cryostat (Leica) at –20 °C and mounted directly onto glass slides. Sections were pretreated using the protease-based RNAscope protocol, including hydrogen peroxide treatment, target retrieval, and Protease III incubation. Probe hybridization was performed using Mm-Fos (316921-C1) and Mm-Slc17a6 (319171-C3) probes, followed by labelling with Opal 520 and Opal 650 (Akoya Biosciences). Slides were imaged on a Leica SP8 confocal microscope equipped with a motorized stage, PMT and HyD SP detectors, four laser lines (405, 488, 552 and 638 nm), and a 10×/0.4 Plan Apo objective. For freshly frozen vagal nodose ganglion sections, Mm-Trpv1 (313331-C1) and Mm-Npy2r (315951-C2) probes were used, labelled with Opal 520 and Opal 690, respectively.
Whole-mount clearing and immunofluorescence staining
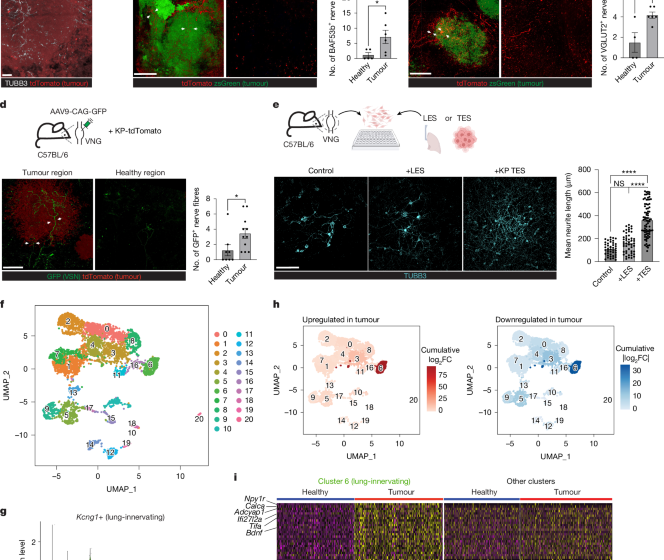
To visualize BAF53b+ or VGLUT2+ nerve fibres or VSNs, mouse lung tissue was cleared using the CUBIC protocol as described previously57 and stained with the following antibodies: anti-RFP (1:200, Rockland) and anti-GFP (1:200, Aves labs). Stained lung tissue was uniformly compressed to a thickness of approximately 1 mm using a customized chamber. Three-dimensional images were acquired by Imaris (v.10.1, Oxford Instruments) with 5-μm z-steps through an approximately 500 μm thickness and imported into FIJI for quantification. Because soluble proteins and peptide ligands generally act over a 100–250 µm paracrine range in vivo58, we used 100 µm as a boundary to define ‘tumour-associated’ fibres. To avoid over-scoring very small lesions, an adaptive rule was applied: for tumour nodules <100 µm in diameter, only fibres within a distance equal to the tumour’s radius (D/2) are counted; for larger tumours, the 100 µm limit is retained. The number of nerve fibres within 100 μm of the tumour regions or randomly selected tumour-free alveoli regions with a radius of 100 μm was quantified.
To visualize TH+ and VAChT+ nerve fibres, mouse lung tissue was cleared using the iDISCO protocol as described previously59 and stained with the following antibody: anti-RFP (1:250, Rockland), anti-TH (1:250, Abcam), and anti-VAChT (1:250, Synaptic Systems). Images were acquired by Imaris with 2-μm z-steps through an approximately 1.5 mm thickness. The number of TH+ nerves within 100 μm of tumours was quantified for each individual tumour, and the average number of TH+ nerve fibres per tumour in each mouse was calculated.
Multiplex volumetric imaging with clearing-enhanced 3D
Mouse lungs were fixed with BD CytoFix/CytoPerm (BD Biosciences, 554714) diluted in PBS solution (1:4) for 1 day at 4 °C. Following fixation, all tissues were washed briefly (5 min per wash) in PBS and incubated in 30% sucrose for 1 day at 4 °C before embedding in OCT compound (Sakura Finetek, 4583). Frozen samples were sectioned at 300 μm with a CM1950 cryostat (Leica Biosystems). The samples were hydrated and washed with PBS to remove OCT in a 24-well plate. Samples were incubated for at least 12 h in BD Perm/Wash Buffer (BD Bioscience) containing 1% mouse Fc block (BD Bioscience, 553142) and stained with titrated antibodies in BD Perm/Wash Buffer (BD Bioscience, 554723) containing 1% Fc block for 24 h at room temperature on a shaker. Antibodies used include CD11c (1:50, eBioscience), MHC-II (1:200, BioLegend), TUBB3 (1:100, BioLegend), CD3 (1:50, BioLegend), CD45 (1:50, Novus), and CD103 (1:200, R&D). Stained samples were washed with BD Perm/Wash Buffer 3 times for at least 20 min at room temperature on a shaker, fixed with 1% PFA for 10 min, and further washed with PBS for 20 min. Samples were transferred on a slide with 2 silicon isolators (Grace Bio-Labs, 664407) and treated with 200 μl of Ce3D medium (1.82 g Histodenz (Millipore Sigma, D2158-100G), 0.1% saponin (Millipore Sigma, SAE0073-25G), and 0.5% thioglycerol (Millipore Sigma, M1753) per 1 mL 40% N-methylacetamide (Millipore Sigma, M26305–500 G) in PBS) inside a chemical fume hood and sealed with a cover slip (Electron Microscopy Sciences, 63766-01) and incubated at room temperature on a shaker overnight. After removing the old Ce3D, cleared samples were mounted with 40 μl of new Ce3D and sealed with a coverslip with 2 SecureSeal Imaging Spacers (654002, Grace Bio-Labs). Images were acquired using an inverted Leica Stellaris 8 confocal microscope equipped with a 20× oil objective with 3 HyD X and 2 HyD S detectors and a white light laser that produces a continuous spectral output between 440 to 790 nm as well as a 405-nm laser. Images were acquired with 3-μm z-steps through a 300 μm thickness. Images were converted to.ims files with Imaris File Converter (Oxford Instruments). The Channel Arithmetics function of Imaris was used to remove spectral spillover and autofluorescence. Gaussian filters were applied to denoise.
Noradrenaline measurement
Mouse lung tissue was homogenized in 1 M perchloric acid using Tissuelyzer (Qiagen). The homogenate was centrifuged at 20,000g for 5 min and the supernatant was transferred to a clean tube. The supernatant was then neutralized with half volume of 2 M KOH/200 mM MOPS and centrifuged at 20,000g for 5 min to remove the KClO4 precipitants. The supernatant was then analysed with an HPLC/ECD system (HPLC, Agilent 1260 Infinity II Quaternary System; Column: Waters ACQUITY UPLC BEH C18 1.7 μm 10 ×100 mm; ECD, Antec DECADE Elite; Electrochemical flow cell, Antec SenCell). The mobile phase consisted of 100 mM acetic acid, 20 mM citric acid, 0.2 mM EDTA, 7.5% methanol, 2 mM NaCl, 500 mg l−1 sodium octyl sulfate, pH 4.86. The working potential of the flow cell was set at 0.5 V.
RT–qPCR
Total RNA was isolated using TRIzol (Invitrogen). cDNAs were then reverse transcribed using Superscript II (Invitrogen) and random primers following the instructions provided by the manufacturer. Quantitative PCR (qPCR) was performed using SYBR green (Bio-Rad Laboratories). Data were collected and analysed on a ViiA 7 Real-Time PCR system (ThermoFisher Scientific). The Gapdh housekeeping gene was used to normalize samples. The following primers were used: Gapdh forward, 5′-CATCACTGCCACCCAGAAGACTG-3′; Gapdh reverse, 5′-ATGCCAGTGAGCTTCCCGTTCAG-3′; Arg1 forward, 5′-CTCCAAGCCAAAGTCCTTAGAG-3′; Arg1 reverse, 5′-AGGAGCTGTCATTAGGGACATC-3′; Adrb1 forward, 5′-CTCATCGTGGTGGGTAACGTG-3′; Adrb1 reverse, 5′-ACACACAGCACATCTACCGAA-3′; Adrb2 forward, 5′-TAGCGATCCACTGCAATCAC-3′; and Adrb2 reverse, 5′-ATTTTGGCAACTTCT-3′.
scRNA-seq and analysis
Both left and right vagal nodose ganglia were collected from seven healthy mice and seven tumour-bearing mice (age and gender matched, three weeks post tumour inoculation for tumour-bearing mice). VSNs were isolated and enriched as previously described15,23. Approximately 5,000–10,000 VSNs were loaded in each channel of the Chromium Next GEM Chip G (10X Genomics). Single-cell cDNA libraries were prepared at the Yale Center for Genomic Analysis (YCGA) and sequenced using an Illumina NovaSeq S4 sequencer. Raw sequencing data for RNA expression were aligned to the mm10 reference mouse transcriptome. Low-quality cells were filtered and the remaining cells were clustered using the R package Seurat v.3 as described previously15. 9,015 cells from the healthy group and 13,073 cells from the tumour-bearing group were sequenced. VSNs were identified by Phox2b expression. Lung-innervating VSNs were defined by Kcng1 expression and by label transfer from the previously characterized lung-innervating VSN populations as described15 (publicly available under the accession GSE192987). Label transfer was performed in Seurat (v.5.0.2) using the FindTransferAnchors function to identify anchors between the reference and query datasets, followed by TransferData to assign cell identities based on the reference ‘seurat_cluster’ labels. DEGs were identified using the FindMarkers function with the Wilcoxon rank-sum test. Genes were considered significantly differentially expressed if they met the following criteria: adjusted P < 0.05, |log2(fold change)| > 1, and expressed in at least 10% of cells.
Clinical data analysis
For survival analysis, RNA-seq gene expression profiles and associated clinical data from 518 LUAD patients were obtained from TCGA (https://portal.gdc.cancer.gov/). The combination of VSN and sympathetic nerve signature genes were translated to human gene symbols (Ensembl) and were used to score individual TCGA tumour expression profiles through single-sample Gene Set Enrichment Analysis (ssGSEA), implemented via GenePattern (https://cloud.genepattern.org/gp/pages/index.jsf). Based on median ssGSEA scores, patients were stratified into high (top 50%) and low (bottom 50%) scoring groups. Kaplan–Meier survival curves were then generated to compare survival outcomes between these groups, with statistical significance assessed using the log-rank test. All survival analyses were performed using the survival package in R (v.3.6-4). The relationship between the expression of combined VSN-sympathetic signature genes and CD8 T cell related genes in LUAD patients was analysed by Pearson correlation based on ssGSEA scores, with linear model smoothing applied to visualize trends. To compare the CD8 signature between VSN-Low, sympathetic-Low and VSN-High, sympathetic-High patient groups, ssGSEA was applied to each patient using a defined CD8 gene set. Wilcoxon rank-sum test was performed to assess the difference in ssGSEA scores between the two patient groups.
Statistics
All statistical analyses were performed using GraphPad Prism software version 10 (GraphPad Software). Results were expressed as mean ± s.e.m. unless otherwise indicated. Unpaired two-tailed Student’s t-test was used for two-group comparison; one-way ANOVA followed by Tukey post hoc test was used for multiple-group comparison. *P <0.05; **P<0.01; ***P<0.001; ****P< 0.0001, NS not significant. Exact sample sizes (n), statistical tests used, and exact P values are reported in the figure legends. Exact P values for the statistical comparisons shown in Fig. 5e–g are as follows. Figure 5e: lung tumour burden was assessed as tumour/tissue area (G1 versus G2: P = 0.0001; G3 versus G4: P = 0.9080; G1 versus G3: P = 0.0027; G2 versus G4: P = 0.8884) and total lung mass (G1 versus G2: P < 0.0001; G3 versus G4: P = 0.4029; G1 versus G3: P = 0.0009; G2 versus G4: P = 0.8149). Figure 5f, for ARG1+ alveolar macrophages, G1 versus G2: P = 0.0013, G3 versus G4: P = 0.9264, G1 versus G3: P = 0.0066, G2 versus G4: P = 0.9958. Figure 5g, for CD8 T cells, G1 versus G2: P = 0.0116, G3 versus G4: P = 0.4425, G1 versus G3: P = 0.0319, G2 versus G4: P = 0.8297; for CD4 T cells, G1 versus G2: P = 0.0002, G3 versus G4: P = 0.9996, G1 versus G3: P = 0.0006, G2 versus G4: P = 0.8650.
Reporting summary
Further information on research design is available in the Nature Portfolio Reporting Summary linked to this article.
First Appeared on
Source link

