Mitochondrial Ca2+ efflux controls neuronal metabolism and long-term memory across species
Animals
Rodents
The rats used in the study to prepare primary cultures were either male or female, and were of the Sprague–Dawley strain Crl:CD(SD), which are bred worldwide by Charles River Laboratories according to the International Genetic Standardization programme. The experiments conducted in the study at the Paris Brain Institute were conducted at the PHENO-ICMice facility and adhered strictly to the guidelines outlined in the European Directive 2010/63/EU and the French Decree n° 2013-118 for the protection of animals used for scientific purposes. The glutamate uncaging experiments using rat pups (Fig. 1g,h and Extended Data Fig. 1l–o) were performed in accordance with the Max Planck Florida Institute for Neuroscience IACUC regulations (protocol number 22-005). Rats were fed with a standard rat breeding diet (V132400, SSNIFF). C57BL/6J male mice (Charles River, France) of 7–8 weeks of age were used for behavioural studies to facilitate direct comparison of our results with our previous work in hippocampal memory that have predominantly used male mice139,140. Animals were grouped housed and maintained in an environment in which both temperature (20–24 °C) and humidity (40–70%) were controlled. Mice were maintained under a 12-h light–dark cycle with food and water available ad libitum. All the experiments were performed during the dark phase of the light–dark cycle by a trained observer who was blind to experimental conditions. Animal procedures were conducted at the Parque de Investigación Biomédica de Barcelona and were in accordance with the standard guidelines of the European Directive on the protection of animals used for scientific purposes (2010/62/EU) and approved by the Animal Ethics Committee of the Parque de Investigación Biomédica de Barcelona. Mice were fed with the complete breeding vegetal diet for rats, mice and hamsters (SDS RM3 (P), Fibers for Life JRS).
Fly strains
Flies (D. Melanogaster) were maintained on a standard medium consisting of yeast, cornmeal and agar at 18 °C and 60% humidity under a 12-h–12-h light–dark cycle. The UAS-LETM1-RNAi lines correspond to HMS01644 (RNAi no. 1) from the Bloomington Drosophila Stock Center and GD2208 (RNAi no. 2) from the Vienna Drosophila Resource Center; the UAS-PDP-RNAi corresponds to GD31661 from the Vienna Drosophila Resource Center. The double RNAi line Letm1 no. 2, PDP was generated in this study using the above-mentioned RNAi lines. The tub-Gal80ts, c739-gal4; UAS-Pyronic was generated in this study from the previously described lines: UAS-Pyronic in Plaçais et al.19 and tub-Gal80ts, c739-gal4 in Turrel et al.141. To limit UAS/GAL4-mediated expression exclusively to the adult stage, the TARGET system was used142. The GAL4 activity was inhibited at 18 °C by a thermosensitive version of GAL80 ubiquitously expressed under the control of the tubulin promoter (tubulin-GAL80ts), as previously reported19. The GAL4 activity was released by transferring adult flies to 30 °C for 2–3 days allowing the expression of the UAS-transgene (RNAi and/or Pyronic FRET sensor). For the generation of the UAS-Mito4x-LA-GCaMP6s Drosophila line, the CMV-Mito4x-LA-GCaMP6s (Addgene, 243810) was cloned into a pJFRC-MUH plasmid (Addgene, 26213)143 using Gibson Cloning. The resulting construct was verified by sequencing. For the generation of the UAS-mCarmine Drosophila line, the mCarmine pcDNA3 plasmid (Addgene, 109486)144 was digested by EcoRI and BamHI. The resulting 746-bp fragment was purified by electrophoresis and cloned into a pJFRC-MUH plasmid (Addgene, 26213)143. The resulting construct was verified by sequencing. The molecular cloning was outsourced to RD-Biotech, France. Transgenic fly strains were obtained by site-specific embryonic injection of the resulting vector in the VK00005 landing site (third chromosome), which was outsourced to Rainbow Transgenic Flies. The tub-Gal80ts, c739-gal4; UAS-mCarmine was generated in this study from the above-described UAS-mCarmine line and tub-Gal80ts, c739-gal4 in Turrel et al.141.
Primary rat co-culture of postnatal neurons and astrocytes
All imaging experiments were performed in primary co-cultures of neurons and astrocytes obtained from the rat hippocampus. Postnatal day 0 (P0) to P2 rats of mixed gender were euthanized and their brains were dissected in a cold HBSS-FBS (1× HBSS, 20% FBS) solution to isolate the hippocampus, excluding the dentate gyrus. Hippocampi were washed with HBSS (Thermo Fisher Scientific, 14185045) and digested in a trypsin-digestion solution containing DNase I (Merck, D5025) for 5 min. Trypsin (Merck, T1005) was neutralized by the addition of HBSS-FBS solution, following which the tissue was washed several times with HBSS solution. The tissue was then transferred to a dissociation (1× HBSS, 5.85 mM MgSO4) solution and was dissociated into single cells by gentle and repeated triturations. Next, as a washing step, the cells were pelleted by centrifugation and resuspended in HBSS solution. The cells were then pelleted again and resuspended in warmed plating media composed of MEM (Thermo Fisher Scientific, 51200038) supplemented with 20 mM glucose, 0.1 mg ml−1 transferrin (Merck, 616420), 1% Glutamax (Thermo Fisher Scientific, 35050061), 24 μg ml−1 insulin (Merck, I6634), 10% FBS (Thermo Fisher Scientific, 10082147) and 2% N-21 (Bio-Techne, AR008). Finally, the cells were counted, and 38,000 cells were plated into 4.7-mm-diameter cloning cylinders attached onto coverslips coated with poly-ornithine (Merck, P3655). Once the supporting glial cell layer was established 2–4 days after plating, the cells were shifted to ‘feeding media’ composed of MEM supplemented with 20 mM glucose, 0.1 mg ml−1 transferrin, 1% Glutamax, 24 μg ml−1 insulin, 5% FBS, 2% N-21 and 4 μM cytosine β-d-arabinofuranoside (Merck, C6645). Cultures were incubated at 37 °C in a 95% air/5% CO2 humidified incubator. At 5–8 days in vitro (DIV), neurons were transfected using the calcium phosphate method based on a previously published protocol145. In brief, transfection was initiated by changing the medium to basal Advanced DMEM (Thermo Fisher Scientific, 12634-010) without any supplements. The cells were then returned to the incubator for 1 h to equilibrate in the new media. During this time, the DNA–calcium (Ca2+)–phosphate (PO4) mixture was prepared according to a previously published recipe146. The mixture was incubated for 30 min to allow formation of the DNA–Ca2+–PO4 precipitate, which was then added to the cells ~1 h after media change. The cells were incubated with the precipitate for 1 h after which the medium was changed back to feeding medium. The cells were maintained in the incubator up to 14–21 DIV before imaging. These mixed cultures are composed of 12.4% neurons, 75% astrocytes and 12.6% of cells that could be identified as neither neurons nor astrocytes (Extended Data Fig. 1a).
For cultures used in glutamate uncaging experiments shown in Fig. 1g,h and Extended Data Fig. 1l–o, conditions were as follows: hippocampal regions were dissected in artificial cerebrospinal fluid containing: 124 mM NaCl, 5 mM KCl, 1.3 mM MgSO4:7H2O, 1.25 mM NaH2PO4:H2O, 2 mM CaCl2, 26 mM NaHCO3 and 11 mM glucose (stored at 4 °C) and stored in hibernate E buffer (BrainBits, stored at 4 °C). Dissected hippocampi were dissociated using the Papain Dissociation System (Worthington Biochemical Corporation, stored at 4 °C) with a modified manufacturer’s protocol. In brief, hippocampi were digested in papain solution (20 units of papain per ml in 1 mM l-cysteine with 0.5 mM EDTA) supplemented with DNase I (final concentration 95 units per ml) and shaken for 30–60 min at 37 °C at 900 rpm. Digested tissue was triturated and set for 3 min, following which the supernatant devoid of tissue chunks was collected. The supernatant was centrifuged at 300g for 5 min and the pellet was resuspended in resuspension buffer (1 mg of ovomucoid inhibitor, 1 mg of albumin and 95 units of DNase I per ml in EBSS). The cells were forced to pass through a discontinuous density gradient formed by the resuspension buffer and the Ovomucoid protease inhibitor (10 mg per ml) with bovine serum albumin (BSA; 10 mg per ml) by centrifuging at 70g for 6 min. The final cell pellet devoid of membrane fragments was resuspended in Neurobasal-A medium (Gibco, stored at 4 °C) supplemented with Glutamax (Gibco, stored at −20 °C) and B27 (Gibco, stored at −20 °C). Cells were plated on poly-d-lysine-coated coverslips mounted on MatTek dishes at a density of 30,000–50,000 cells per cm2. Cultures were maintained at 37 °C and 5% CO2 with feeding every 3 days using the same medium until transfection. Transfections were performed 12 days after plating by magnetofection using Combimag (OZ biosciences, stored at 4 °C) and Lipofectamine 2000 (Invitrogen, stored at 4 °C) according to the manufacturer’s instructions.
Gene constructs
Constructs to specifically knock down Letm1 expression in primary cultures of rat neurons were designed using the Genetic Perturbation Platform (Broad Institute) and cloned into various versions of the pLKO cloning vector as indicated in Supplementary Table 1. For most imaging experiments the BFP expression version of the Letm1 KD plasmid construct was used to confirm double transfection through fluorescence. In the case of Pyronic experiments, the miRFPnano version was used to avoid spectral overlap with the sensor. The target sequence used for shRNA KD of Letm1 in rats (pLKO-U6-sh1-Letm1(rat)-hPGK-mTagBFP2; Addgene, 212664) was 5′-CCTTCCAGAAATTGTGGCAAA-3′. Rat Letm1 presents three very similar isoforms (Canonical, ENSRNOT00000099794.2, Letm1-202, 760 amino acids long; ENSRNOT00000022540.8 Letm1-201, 739 amino acids long; ENSRNOT00000147310.1, Letm1-203, 734 amino acids long). Our target sequence is located in exon 8, which is identical in all three isoforms. The target sequence against rat Pdp1 for shRNA KD was 5′-ATTATTGCCTACAGCATGGCG-3′, which was expressed in the same pLKO vector under the H1 promoter together with the Letm1 shRNA under the U6 promoter. For the rescue experiments, Mito4x-GCaMP6f was cloned into a plasmid with a CaMKII promoter and an IRES2 sequence to express two coding sequences. This was done by the Gibson cloning method using NEBuilder HiFi DNA Assembly Master Mix (E2621, NEB). Individual rat Letm1 and Drosophila Letm1 protein-coding sequences were obtained from the Ensembl genome browser, and plasmids containing these sequences were synthesized using Invitrogen GeneArt Gene Synthesis. Site-directed mutagenesis using the Q5 Site-Directed Mutagenesis Kit (NEB) was performed to inactivate the Ca2+ coordinating amino acids in the EF-hand of Letm1. The aspartate (D) amino acids at positions 276 and 280 were replaced by alanine. We designed the Letm1–mRFP1 construct to express rat Letm1, followed by a short linker (RPVVAV) and mRFP1 and synthesized this construct at GeneArt (Thermo Fisher Scientific), where it was cloned into pcDNA3.1 to be expressed under the CMV promoter. In the multiple cloning site located after the IRES2 sequence, the synthesized shRNA-resistant Letm1 coding sequences were cloned using restriction enzyme cloning, generating the following constructs: CamKII-Mito4x-GCaMP6f-IRES2-MCS, CamKII-Mito4x-GCaMP6f-IRES2-rat-Letm1, CamKII-Mito4x-GCaMP6f-IRES2-rat-Letm1-ΔEF-hand and CamKII-Mito4x-GCaMP6f-Drosophila-Letm1. For the mouse behaviour experiments, the microRNA encoding plasmids and AAVs—pAAV-Camk2a(short)-mRFP1.Letm1[miR-30-shRNA]-WPRE, pAAV-Camk2a(short)-mRFP1.Scramble[miR-30-shRNA]-WPRE and GCaMP6s p.AspD362Ile—were designed in the lab and generated by VectorBuilder (Supplementary Table 1). Mouse Letm1 has only one major protein-coding isoform (ENSMUST00000005431.6 Letm1-201, 738 amino acids long). Other annotated mouse transcripts are truncated or non-coding. Therefore, the target sequence is present in the main mouse isoform, and a single western blot band corresponding to this isoform is expected.
Synthetic DNA oligonucleotides were purchased from Integrated DNA technologies. Q5 high fidelity DNA polymerase (New England Biolabs, NEB) was used for all PCR amplifications. Isothermal assembly reactions were performed with a NEBuilder HiFi kit (NEB). Small-scale DNA isolation was performed with QIAprep Spin Miniprep Kit (Qiagen). The pRSET vector backbone was acquired from Life Technologies. Inserts and vector backbones were amplified by PCR amplification. Vector backbones and inserts were assembled by isothermal assembly with 10–30-base-pair overlap, and sequence verified by Sanger sequencing (Azenta Life Sciences) or by nanopore full-plasmid sequencing (Plasmidsaurus). pRSET plasmids encoding GCaMP6s147 and GCaMP6-150 (ref. 62) were used from an in-house source (Janelia Research Campus). Other plasmids used in this study, which have been previously described, are listed in Supplementary Table 1.
Protein expression and purification of GCaMP6s, GCaMP-150 and GCaMP6s p.AspD362Ile
For expression and purification of proteins, T7 express cells (NEB) were transformed with pRSET plasmids encoding the protein of interest. The bacteria were grown in auto-induction media using the Studier method148 with antibiotics at 30 °C for 48 h with shaking at 200 rpm. Cell pellets were collected by centrifugation, lysed in Tris-buffered saline (TBS; 19.98 mM Tris, 136 mM NaCl, pH 8.0), with n-octyl-β-d-thioglucopyranoside (5 g l−1)). Aggregations were disrupted by sonication and the lysate cleared by centrifugation. Protein purification was performed on an N-terminal poly-histidine (His6) tag using HisPur Ni-NTA resin (Thermo Fisher Scientific), according to the manufacturer’s recommendations. Purified proteins were buffer exchanged into TBS using Amicon concentration filters (Merck). Protein aliquots were stored at 4 °C.
Calcium titrations in purified protein
To determine the calcium affinity and cooperativity of the calcium indicators, calcium titrations were performed in a buffer system made from ethylene glycol tetraacetic acid (EGTA) and Ca2+/EGTA from the Calcium Calibration Buffer Kit no. 1 (Invitrogen) or nitrilotriacetic acid (NTA) and Ca2+/NTA prepared using the pH titration method described by Tsien and Pozzan149. The solutions were mixed in specific ratios to generate known free calcium concentrations. The free Ca2+ concentration was calculated assuming the dissociation constant of EGTA for Ca2+ to be 150 nM at 22 °C and pH 7.2, and assuming the dissociation constant of NTA for Ca2+ to be 67 µM. In total, 2 µl of purified protein at around 20 µM was diluted into 98 µl of a pre-mixed solution of Ca2+/EGTA or Ca2+/NTA in black 96-well plates. Fluorescence intensities were read on a plate reader (Tecan Spark 20 M). Fluorescence intensity was measured at 26 °C and 37 °C. The excitation was set to 488 nm and emission was 525 nm. All bandwidths were set to 10 nm. Changes in fluorescence after addition of Ca2+ were calculated in Microsoft Excel. The fluorescence (y) was plotted against the free calcium concentration (x) and a four-parameter dose–response curve (variable slope) using GraphPad Prism software was fit where a is the value of fluorescence at the bottom of the curve, b is the value of fluorescence at the top of the curve, EC50 is the concentration of agonist that gives a response halfway between bottom and the top, and (n) is the hill or cooperative coefficient according to equation (1):
$$y(x)=a+\frac{{x}^{n}(b-a)}{{x}^{n}+{{{\rm{EC}}}_{50}}^{n}}$$
(1)
Lentivirus production
HEK 293T cells were purchased from the American Type Culture Collection (CRL-3216). They were transfected with the pLKO shRNA vector plasmid along with third-generation packaging, transfer and envelope plasmids, using the vesicular stomatitis virus G glycoprotein as the envelope protein with transient transfection in a medium containing chloroquine (Merck). The medium was replaced after 6 h and the supernatant was collected after 36 h. The supernatant was treated with DNase I (Roche) and then ultracentrifugation was carried out at 60,000g for 90 min. The resulting pellet was resuspended in 0.1 M PBS, aliquoted and frozen at −80 °C until use. Lentivirus was produced at the iVector facility at the Paris Brain Institute in BSL2 facilities. The lentivirus production presented a titre of 4.01 × 10⁹ viral particles per μl, measured by ELISA using the p24 ZeptoMetrix kit (Merck).
Primary culture of embryonic rat neurons for western blotting
To assess the efficiency of Letm1-targeted shRNA specifically in neurons, we used primary cultures of rat embryonic neurons, which do not present astrocytes, allowing the assessment of Letm1 levels only from neurons. Pregnant rats (embryonic day 18) were euthanized by CO2 asphyxiation, and the embryos were then isolated onto sterile ice-cold HBSS solution, followed by the dissection of the cortex and the hippocampus. After removal of meninges, the tissue was digested with papain (Worthington Biochemical, LK003178) to isolate single cells. The dissociated cells were plated onto six-well plates coated with poly-d-lysine (Merck, P2636). Around 0.5 M cells were plated per well in plating media (prepared according to a previously published recipe150). At 5 DIV, half of the medium was replaced with maintenance media composed of BrainPhys Neuronal Medium supplemented with 2% (vol/vol) SM1 (STEMCELL Technologies, 05792) and 12.5 mM d-(+)-glucose (Merck, G8270) in addition to 10 μM 5’-fluoro-2’-deoxyuridine (Fisher Scientific, 10144760). Media replacement was carried out every 4–5 days. At 8 DIV, for assessing the different KD conditions, neurons were transduced with lentiviruses expressing the plKO-Letm1 shRNA or plKO-PDP1-shRNA-Letm1 shRNA constructs at a multiplicity of infection of 50.
Immunocytochemistry
Immunocytochemistry was performed on co-cultures at 17 DIV. Briefly, cells were fixed in 4% paraformaldehyde solution in PBS, washed, permeabilized using PBS 0.2% Triton X-100 (PBS-T) and blocked in PBS-T containing 3% BSA. Primary antibodies used were anti-MAP-2 (AB183830, Abcam) and anti-GFAP (173008, Synaptic Systems), diluted at 1:200 in blocking solution overnight at 4 °C. Secondary antibodies used were Goat anti-mouse IgG coupled to Alexa Fluor Plus 555 (A32727, Invitrogen) and Goat anti-rabbit IgG coupled to Alexa Fluor 488 (A11034, Invitrogen), diluted at 1:200 in blocking solution at room temperature for 2 h. Cells were washed in PBS three times after each antibody incubation. DAPI was included in the final wash. Cells were mounted in slides with fluorescence mounting media (F4680, Sigma-Aldrich). Images were acquired in a widefield Apotome Zeiss microscope at ×10 magnification covering the whole area containing cells. Analysis was performed manually using ImageJ by counting the total number of nuclei, the number of nuclei corresponding with the neuronal marker MAP-2 and the number of nuclei corresponding with the astrocytic marker GFAP. The percentage of neurons, astrocytes and unidentified cells was determined for every image and averaged for all images for each coverslip.
Western blotting
For analysis of protein levels of neurons in culture, lysates of embryonic neurons were prepared using RIPA buffer supplemented with 1× protease inhibitor cocktail (from 100×; Merck, P8849) and 1 mM phenylmethylsulfonyl fluoride (Roche, 10837091001) at 18 DIV. Lysates with 30 μg of protein were loaded onto SDS–PAGE gels and transferred onto nitrocellulose membranes after separation. The blots were probed with anti-Letm1 (514136, Santa Cruz Biotechnology), anti-synaptophysin 1 (101011, Synaptic Systems), anti-Total OXPHOS (110413, Abcam) and anti-PDP1 (84612-3-RR, Proteintech), and β-actin (PA5-85271, Thermo Fisher Scientific) was used as the loading control.
For analysis of protein levels of mouse hippocampus, mice were stereotaxically injected as described below with control virus (pAAV[mir-30]-CamK2(short)>mRFP1: scramble) or shLETM1 virus (pAAV[mir-30]-CamK2-mir-30-shRNA no. 1]: WPRE). Mice were euthanized and hippocampi were obtained. Given that mRFP1 has a naturally visible red colour due to its chromophore, we dissected the dorsal region of the hippocampus that appeared red by eye and prepared lysates using RIPA buffer supplemented with 1× protease inhibitor cocktail (from 100×; Merck, P8849) and 1 mM phenylmethylsulfonyl fluoride (Roche, 10837091001). Lysates with 30 μg of protein were loaded onto SDS–PAGE gels and transferred onto nitrocellulose membranes after separation. The blots were probed with anti-Letm1 (514136, Santa Cruz Biotechnology), anti-PDH E1 Alpha (Proteintech, 18068-1-AP), anti phospho-293 PDH (Proteintech, 84612-3-RR) and β-actin (PA5-85271, Thermo Fisher Scientific). Chemiluminescence images of the blots were obtained using Clarity Max ECL Western Blotting Substrate (Bio-Rad, 1705062) and the Chemi-doc Touch imaging system (Bio-Rad) following which the blots were quantified using the Image Lab (Bio-Rad) software.
All primary antibodies were prepared in 10% skimmed milk (Sigma, 70166) dissolved in TBS-Tween 0.2%, except for the anti-Total OXPHOS, which was prepared in 5% BSA in TBS-Tween. The primary antibodies and dilutions used in this study were anti-Letm1 (1:1,000 dilution), anti-PDH E1 Alpha (1:2,000 dilution), anti phospho-293 PDH (1:1,000 dilution), anti-synaptophysin1 (1:2,000 dilution), anti-Total OXPHOS (1:2,000 dilution), anti-PDP1 (1:1,000 dilution) and anti-β-actin (1:4,000 dilution). As secondary antibodies, we used Goat anti-Rabbit or Goat anti-Mouse IgG (Bio-Rad, 1706516) using a 1:5,000 dilution in 10% milk.
Western blot molecular weight assignment
Each blot was run with a pre-stained protein molecular weight ladder (PageRuler 10–180 kDa, Thermo Fisher, 26616). Immediately after transfer and before blocking, the PVDF membrane was photographed in colour to record the ladder positions. After chemiluminescence detection, the ECL exposure was registered to the colour image in Fiji/ImageJ, enabling assignment of apparent molecular weights by interpolation from molecular weight versus relative migration standard curve. For all targets, the detected bands matched the expected sizes from UniProt.
Live imaging of primary neurons
Unless otherwise noted, primary hippocampal neurons were transfected using Ca2+ phosphate at 7 DIV as described above and in previous work89, and were imaged from 14 to 21 DIV. Experiments using an shRNA against Letm1 were always performed at least 10 days after transfection to ensure protein turnover at mitochondria4. Imaging experiments were performed using a custom-built laser-illuminated epifluorescence microscope (Zeiss Axio Observer 3) coupled to an Andor iXon Ultra camera (model no. DU-897U-CSO-#BV), whose chip temperature is cooled down to −90 °C to reduce noise in the measurements using the Oasis UC160 Cooling System. Illumination using fibre-coupled lasers of wavelengths 488 (Coherent OBIS 488 nm LX 30 mW) and 561 (Coherent OBIS 561 nm LS 80 mW) was combined through using the Coherent Galaxy Beam Combiner, and laser illumination was controlled using a custom Arduino-based circuit coupling imaging and illumination. Primary neuron–astrocyte cultures were grown on poly-ornithine-coated coverslips (D = 0.17 mm, Warner instruments), mounted onto an RC-21BRFS imaging chamber for field stimulation (Warner Instruments) and imaged through a ×40 Zeiss oil objective ‘Plan-Neofluar’ with an NA of 1.30 (WD = 0.21 mm). Imaging frequencies used in experiments were 5 Hz for Mito4x-GCaMP6f, 100 Hz for cytosolic GCaMP8f and 2 Hz for all the others. The temperature of all experiments was clamped at 36.5 °C and was kept constant by heating the chamber through a platform (PH-2, warner instruments) together with an in-line solution heater (SHM-6, Warner Instruments), through which solutions flowed at 0.35 ml min−1. The temperature was kept constant using a feedback loop temperature controller (TC-344C, Warner Instruments). External Ca2+ in the medium was maintained constant at a level of 2 mM across all experiments. We identified axons as neuronal projections extending beyond ~500 μm from the cell body, while dendrites were identified by being thick proximal projections presenting spines. In axons, mitochondria are also easily recognized relative to dendrites because they are typically smaller and more rounded49,51.
In the case of glutamate uncaging experiments, live cell imaging was conducted between 18 and 19 days after plating. Experiments were performed at 37 °C and in a modified E4 imaging buffer containing 120 mM NaCl, 3 mM KCl, 10 mM HEPES (buffered to pH 7.4), 4 mM CaCl2 and 10 mM glucose. Imaging during glutamate uncaging was performed using a custom-built inverted spinning-disk confocal microscope (3i Imaging Systems, CSU-W1) with an Andor iXon Life 888 for confocal fluorescence imaging. Image acquisition was controlled by SlideBook 2023 software. Images were acquired with a Plan-Apochromat ×63/1.4-NA oil objective, M27 with DIC III prism, using a CSU-W1 Dichroic for 488/561-nm excitation with a Quad emitter and individual emitters. During imaging, the temperature was maintained at 37 °C using an Okolab stage top incubator with temperature control.
All experiments in cultured cells were performed in continuously flowing Tyrode’s solution containing 2 mM Ca2+. Unless otherwise noted, Tyrode’s solution contained the following components: 119 mM NaCl, 2.5 mM KCl, 2 mM CaCl2, 2 mM MgCl2, 20 mM glucose, 10 μM CNQX and 50 μM AP5, buffered to pH 7.4 at 37 °C using 25 mM HEPES. However, key experiments were replicated in the same Tyrode’s solution but containing 1.2 mM glucose and 43.8 mM HEPES to avoid possible contributions of high glucose to results. Experiments using 1.2 mM glucose are shown in Fig. 1e and Extended Data Figs. 1g–l, 2a–d and 5d,e. Experiments in Fig. 2 and Extended Data Fig. 3a,b,g,h were done in a Tyrode’s solution containing no glucose but lactate and pyruvate as fuel, with the following composition: 119 mM NaCl, 2.5 mM KCl, 2 mM CaCl2, 2 mM MgCl2, 0 mM glucose, 1.25 mM lactate, 1.25 mM pyruvate, 10 μM CNQX and 50 μM AP5, buffered to pH 7.4 at 37 °C using 42.5 mM HEPES. None of the Tyrode’s solutions contain glutamine.
NH4Cl solutions for calibrating pHluorin measurements had a similar composition as Tyrode’s buffer except they contained 100 mM NH4Cl and 19 mM NaCl for a pH of 7.4, pH of 7.8 and pH of 8.2 at 37 °C for mitochondrial estimates, and 50 mM NH4Cl and 69 mM NaCl for a pH of 7.4 at 37 °C for synaptic vesicle pH estimates. Chronic incubation with TTX (Tocris) was performed by adding a 1 µM final concentration of TTX in the culture media one day after transfection, and it was refreshed 5 days after the initial addition and maintained until synaptic ATP levels were measured using Syn-ATP. Luminescence imaging of the presynaptic ATP reporter Syn-ATP was performed as previously described10,25. We did not observe significant differences in pH changes when comparing wild-type neurons and Letm1 KD neurons (Extended Data Fig. 2d); therefore, we did not correct for pH changes in ATP measurements. vGlut-pHluorin signals during electrical stimulation are reported as a percentage of the total vesicle pool, whose fluorescence is obtained by perfusion of a Tyrode’s solution containing 50 mM NH4Cl buffered at pH 7.4 using 25 mM HEPES.
Live FRET imaging of pyruvate or ATP using Pyronic or ATeam 1.03, respectively, was carried out using a widefield inverted Zeiss Axio Observer 7 microscope with an incubation chamber maintained at 37 °C. Cells were imaged in Tyrode’s buffer without AP5 and CNQX. The ×40 LD Plan-Neofluar objective with 0.75 NA was used for image acquisition with excitation at 430 nm and emissions recorded at 480 nm ± 20 nm (mTFP or CFP) and 535 nm ± 15 nm (Venus or YFP). A HXP 120-V metal halide lamp (Leistungselektronik Jena) was used as the illumination source. The inverse FRET ratio (R = mTFP/Venus) was calculated as a measure of pyruvate levels while the Venus/eCFP ratio was calculated as a measure of ATP levels. In the case of Pyronic imaging, the slope was determined automatically using the ‘statelevels’, ‘risetime’ and ‘slewrate’ functions in the MATLAB signal processing toolbox to analyse the ΔR/R0 traces.
Single spine stimulation experiments and analysis
Neurons were transfected with RCaMP1.07 and Mito4x-GCaMP6f10 plasmid constructs, along with the Letm1 shRNA when specified. Transfected neurons were identified by changes in RCaMP1.07 fluorescence in dendrites corresponding to calcium transients. Before glutamate uncaging, neurons were replaced with 1 μM TTX, 2 mM 4-methoxy-7-itroindolinyl-caged-l-glutamate (MNI caged glutamate; Tocris Bioscience, 100 mM stock made in modified E4 buffer) in modified E4 buffer lacking Mg2+ (see above). Glutamate uncaging was performed using a multiphoton laser at 720 nm (Chameleon, Coherent) and a Pockels cell (Conoptics) to control the uncaging pulses. To test a spine’s response to an uncaging pulse, an uncaging spot (2 μm2) close to a spine head was selected and two to three uncaging pulses, each at 10-ms pulse duration per pixel at 5.9–9.6-mW power, were given. Only spines with pulse-specific calcium transients were selected for the following experiments. A single uncaging pulse was given, followed by acquisition.
Image analysis for in vitro experiments
We used the ImageJ plugin Time Series Analyzer V3 for imaging analysis. This involved the selection of 150–250 regions of interest (ROIs) for synaptic boutons, or 10–150 ROIs for responding boutons, and measuring the fluorescence over time. Mitochondrial and cytosolic Ca2+ signals in response to electrical activity (ΔF) were normalized to the resting fluorescence (F0), unless otherwise mentioned in the text.
Mitochondrial calcium measurements
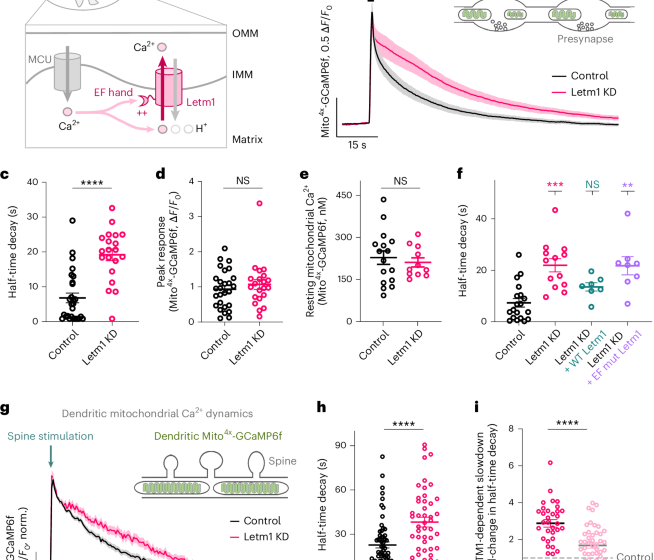
For activity-driven mitochondrial Ca2+ measurements using Mito4x-GCaMP6f, data were obtained from imaging axonal mitochondria responses to electrical stimulation. As previously reported10, in some cases a small fraction of Mito4x-GCaMP6f appeared mislocalized in the cytosol, which would contaminate the quantification of peak mitochondrial responses. Leveraging the kinetic differences of cytosolic and mitochondrial Ca2+ responses, we quantified exclusively mitochondrial Ca2+ by choosing a 1-s delay after the stimulus as the peak response. At this point cytosolic Ca2+ has returned to baseline, allowing a clean estimate of mitochondrial responses without any contribution from possible mislocalized probes. Neurons with apparent cytosolic mislocalization of Mito4x-GCaMP6f were excluded. Based on this criterion, 3 of 51 neurons were excluded from the analysis.
For measuring the rate of efflux, we did not fit our data to any model because mitochondrial Ca2+ decays differently in different conditions. Therefore, we used the time to reach half the peak value that is, half-time decay (t1/2), as a comparable indicator of the rate of Ca2+ efflux across conditions.
Mitochondrial free Ca2+ concentration estimates, one-point calibration protocol
In this method, to estimate free Ca2+ concentration in axonal mitochondria expressing Mito4x-GCaMP6f, we measured fluorescence at saturating [Ca2+] in mitochondria (Fmax). This was obtained by applying Tyrode’s solution containing 500 μM ionomycin, 4 mM CaCl2 and 0 mM MgCl2 at pH 6.9 buffered with 25 mM HEPES, as done previously10,62. Knowing the parameters of purified GCaMP6f147, baseline mitochondrial [Ca2+], [Ca2+]r is calculated from Fmax using equation (2):
$${[{\mathrm{Ca}}^{2+}]}_{r}={\mathrm{EC}}_{50}{\left(\frac{{F}_{r}/{F}_{\rm{max}}-1/{R}_{f}}{1-{F}_{r}/{F}_{\rm{max}}}\right)}^{1/n}$$
(2)
EC50 is the affinity constant of the indicator, Fr is the measured fluorescence at rest, Rf is the dynamic range (Fsat/Fapo) and n is the Hill coefficient. The values for EC50, Rf and n were obtained from those calculated in a previously published paper on GCaMP6f147. Ionomycin application does not produce a change in mitochondrial matrix pH10.
Mitochondrial free Ca2+ concentration estimates, two-point calibration protocol
To avoid relying on the in vitro-determined dynamic range of the indicator, we also performed a two-point calibration that estimates this value in situ. In this method, both the minimum (Fmin) and maximum (Fmax) fluorescence of the sensor were determined directly in axonal mitochondria. Neurons were imaged in basal conditions first using a Tyrode’s solution containing 1.2 mM glucose and 2 mM Ca2+. Before measuring Fmin, neurons were washed with the same Tyrode’s solution but containing no Ca2+. Next, we obtained Fmin by incubating neurons for 8 min with Tyrode’s 0 mM Ca2+, 1.2 mM glucose, 50 μM CCCP and 10 μM BAPTA-AM. Finally, to obtain Fmax, neurons were incubated with Tyrode’s 4 mM Ca2+, 1.2 mM glucose and 50 μM ionomycin, and imaged after a quick increase in fluorescence. Resting fluorescence (F0) was converted into fractional sensor saturation (S) by normalizing between the Fmin and Fmax according to equation (3):
$$S=\frac{{F}_{0}-\,{F}_{\min }}{{F}_{\max }-\,{F}_{\min }}$$
(3)
Under the assumption of a Hill binding model (with dissociation constant EC50 and Hill coefficient n), the fractional saturation is (equation (4)):
$$S=\frac{{[{{\rm{Ca}}}^{2+}]}^{n}}{{{{\rm{EC}}}_{50}}^{n}+{[{{\rm{Ca}}}^{2+}]}^{n}}$$
(4)
This equation can be algebraically inverted to estimate resting free Ca2+ concentration according to equation (5):
$${[{\mathrm{Ca}}^{2+}]}_{r}={\mathrm{EC}}_{50}{\left(\frac{S}{1-S}\right)}^{1/n}$$
(5)
Equation 5 was used to calculate the resting mitochondrial calcium values. The values for EC50, Rf and n were obtained from those calculated in a previously published paper on GCaMP8f66.
Mitochondrial pH measurements
Mitochondrial pH measurements were obtained by measuring Mito4x-pHluorin fluorescence in axonal mitochondria. Neurons were perfused sequentially with three different Tyrode’s solutions containing 100 mM NH4Cl but buffered at pH 7.4, pH 7.8 and pH 8.2 (Extended Data Fig. 2a). After an initial overshoot of fluorescence in the presence of 100 mM NH4Cl, which has been previously described to occur when using endoplasmic reticulum pHluorin62, signals stabilized to equilibrated mitochondrial pH corresponding with those of the Tyrode’s solution. These three fluorescence values in these conditions were used for estimating resting mitochondrial pH using the modified Henderson–Hasselbalch equation according to equation (6):
$${\mathrm{pH}}_{0}={\mathrm{pK}}_{{\rm{a}}}-\frac{1}{n}{{\text{log}}}_{10}\left(\frac{1+{10}^{n({\mathrm{pK}}_{{\rm{a}}}-{\mathrm{pH}}_{{\mathrm{NH}}_{4}\mathrm{Cl},i})}}{{F}_{0}{/}{F}_{{\mathrm{NH}}_{4}\mathrm{Cl},i}}\right)$$
(6)
Using the biophysical properties described for pHluorin151, pKa is the pKa of pHluorin, 7.2, and n is the hill coefficient of pHluorin responsiveness, 1.9. pHNH4Cl,i is the pH of the 100 mM NH4Cl calibration buffer (i = 7.8 or 8.2), F0 is the fluorescence of Mito4x-pHluorin measured before NH4Cl perfusion, FNH4Cl is the fluorescence of Mito4x-pHluorin measured after NH4Cl perfusion when signal is stable in each buffer (i = 7.8 or 8.2). To obtain the final estimates of mitochondrial pH, we averaged results from changes obtained in pH 7.8 and pH 8.2, as these are clearly distinguishable from baseline fluorescence and thus present less noise when measured.
Synaptic vesicle pH measurements
Synaptic vesicle pH measurements were obtained by measuring vGlut-pHluorin fluorescence in axons. Neurons were perfused with a Tyrode’s solutions containing 50 mM NH4Cl buffered at pH 7.4, causing a stable peak in fluorescence corresponding to pH 7.4, as previously described. Synaptic vesicle pH was estimated as described for mitochondria but using the values obtained at pH 7.4.
Cytosolic pH measurements
Cytosolic pH measurements were obtained by measuring cytosolic pHluorin fluorescence in axons. Neurons were perfused sequentially with three different modified Tyrode’s solutions buffered to pH 7.4, 7.8 and 8.2. These solutions lack Na+ and Ca2+ but contain 1.2 mM glucose, 2 mM MgCl2, 123.5 mM KCl, 53.8 mM HEPES, 10 mM CNQX, 50 mM APV and 20 µM nigericin. Fluorescence was stabilized after each perfusion in around 30 s, allowing the measurement of the change in fluorescence in each of the cases. Cytosolic pH was estimated as described for mitochondria, averaging results from fluorescence changes obtained in pH 7.8 and pH 8.2.
Permeabilization and ATP estimates
To enable quantification of ATP from experimental L/F measurements, Syn-ATP was calibrated by determining its response in the presence of 0 mM ATP (L/Fmin) and 5 mM ATP (L/Fmax) under imaging conditions identical to those used in the experiments. Calibration was achieved by permeabilizing neurons by incubation with 1,000 U ml−1 sreptolysin-O (Sigma, 98072-47-0) for 2 min in a permeabilization buffer containing 139 mM KCl, 20 mM PIPES (buffered to pH 7.0 at 37 °C), 5.22 mM MgCl2, 0.186 mM CaCl2 and 0.91 mM EGTA. This experiment was performed four independent times, which allowed obtaining L/Fmin and L/Fmax, defining the dynamic range of the sensor and allowing for normalization of all experimental L/F values as shown in equation (7):
$${\rm{Normalized}}\,L/F=\frac{L/F_{\rm{obs}}-L/F_{\rm{min}}}{L/F_{\rm{max}}-L/F_{\rm{min}}}$$
(7)
The normalized L/F values were then related to ATP concentration using a Michaelis–Menten equation with the apparent affinity (Km) fixed at the published value of 2.3 mM25. The ATP concentration corresponding to each measurement was obtained by solving equation (8):
$$[{\rm{ATP}}]=\frac{({\rm{Normalized}}\,L/F)\times{K}_{\rm{m}}}{1-({\rm{Normalized}}\,L/F)}$$
(8)
Only normalized L/F values within the calibration range were converted. Values above 1 were excluded being above calibration range (1 of 73 measurements).
Estimates of synapse number per axonal distance
Neurons were transfected to express the synaptic marker synapsin1-mRuby and scramble or Letm1 shRNAs. Both shRNA vectors also expressed cytosolic mTagBFP2, which we used as a filler to identify axons. Using ImageJ, we manually drew segmented lines in axons using the BFP channel and generated plot profiles for the corresponding synapsin1-mRuby signals. Synapses were counted as those whose mRuby fluorescence was 3.5 times the fluorescence of the inter-synapse space corresponding to the axon, divided by the distance of the axon drawn and multiplied by 100 to estimate the number of synapses per 100 μm.
Estimates of mitochondrial shape
Different morphological aspects of mitochondria were analysed from the images taken in the mitochondrial calcium measurement experiments in which neurons expressed Mito4x-GCaMP6f and scramble or Letm1 shRNAs. Images were analysed using the ImageJ plugin Trainable Weka Segmentation following the criteria described previously152,153. For cultured neurons, in addition to the global background of the image not containing any cell type, pixels containing astrocytes were also selected as a secondary background, which increased specificity in the mitochondrial shaping measurements performed by the Trainable Weka Segmentation plugin. The morphological aspects of mitochondria analysed for neurons were area, perimeter, circularity and aspect ratio. We averaged the results per neuron for statistical comparison.
Dendritic responses during glutamate uncaging
Image analysis was performed using ImageJ. ROIs of ~2 μm2 were drawn at the base of the stimulated spine to measure the dendritic calcium signal in the 561-nm channel and the mitochondrial matrix signal in the 488-nm channel. For spine calcium measurement, ROIs of ~0.8 μm2 were drawn on the spine and measured in the 561-nm channel. Only dendrites with apparent mitochondrial matrix response were analysed. The average intensity of each ROI was measured, and the background was subtracted using the intensity measured from an adjacent background area. F0 was defined as the average of the intensities measured at the five time points before spine stimulation. For each successive time point during and after stimulation, the normalized intensity (Fnorm) was calculated using the equation: Fnorm = (F − F0)/F0. For normalization to maximum analysis, F/F0 corresponding to each time point was divided by the maximum Fnorm value (Fmax) of the entire time trace. Traces with ectopic peaks following the stimulation pulse or offshoots of Mito4x-GCaMP6f10 fluorescence were excluded from the analysis.
Computational model for neuronal activity and mitochondrial metabolism
We reproduced and adapted a previously published mitochondrial metabolism model90 that simulates some essential components of the TCA and ATP production with eight differential equations using mass action kinetics and irreversible reactions (henceforth referred to as the Nazareth model). The Nazareth model is a minimalist metabolism model that starts with pyruvate and includes acetyl-coenzyme A, citrate, alpha-ketoglutarate, oxaloacetate, nicotinamide adenine dinucleotide (NAD+), ATP and the intrinsic mitochondrial membrane potential (ΔΨ). The levels of these metabolic intermediates are set by the rate at which ATP in the mitochondria is exchanged with the cytosolic ADP, and in the model is controlled by a variable (KANT) that sets the rate constant of the adenine nucleotide translocator.
To simulate the metabolic expense of spiking in neurons, we modulated this variable (KANT) as a function of time. We separated the costs of a neuron into two components, the first of which accounted for the non-spike-related metabolic expenses of a neuron and this remained the same in all our simulations (100/ks). The second component was a per-spike metabolic expense, which was an additional transient increase in this KANT after each spike (0 to 10/ks, followed by a slow delay to 0 with a 100-ms decay constant). Effectively, this guaranteed that the metabolic expenses incurred by a neuron were dependent on the spiking rate of the neuron.
Spikes in our model
To simulate the effect of spiking, we assumed spikes occur either regularly (Fig. 2f), or as a Poisson point process in case of random spikes (Fig. 2g–i). Each spike is merely a point process with no specific details of ionic currents. This serves as a proxy for a detailed neuronal model that is sufficient to explore the phenomenon we wish to observe.
Mitochondrial free Ca2+ and its influence on TCA and ETC reactions
In addition to the ATP expense incurred due to each spike, each spike also added a unitless value of 0.1 to an excess free Ca2+ variable (ca_mito). This variable decayed to 0 over time depending on if it was the case of control (decay constant of 7 s) or if it was the case of Letm1 KD (decay constant of 20 s). In our implementation of the Nazareth model, the excess free Ca2+ variable increased the rate of reactions for the equivalent enzymes of pyruvate, isocitrate and alpha-ketoglutarate dehydrogenases and the complex V according to equation (9):
$${\mathrm{frac}}_{\mathrm{Ca}\_\mathrm{mito}}=\frac{10}{(1+{e}^{-0.5({\mathrm{Ca}\_\mathrm{mito}}^{-9})})}$$
(9)
Where ‘frac’ is the fractional increase of the rate constants due to the Ca2+ binding, and ‘ca_mito’ is the excess free Ca2+ in the mitochondria.
In vivo imaging in D. melanogaster
Crosses for imaging experiments were raised at 23 °C and fly progeny were induced for 3 days at 30.5 °C to drive sufficient expression of the probe (and the desired RNAi) for use in imaging. All in vivo imaging was performed on female flies, which are preferred as their larger size facilitates surgery. Around 30 min to 1 h (for mitochondrial Ca2+ imaging) and 3 h (for pyruvate or mitochondrial Ca2+ imaging) after 1× paired or 1× unpaired olfactory conditioning, flies were gently handled by aspiration without anaesthesia and glued on their dorsal side to a plastic coverslip coated with a thin transparent plastic sheet. The coverslip was then placed on a recording chamber. Surgery was performed to obtain an imaging window on the fly head by removing the cuticle, trachea and fat bodies, thereby exposing the underlying MB neurons. During the procedure, the head capsule is bathed in a drop of artificial haemolymph: 130 mM NaCl (Merck, S9625), 5 mM KCl (Merck, P3911), 2 mM MgCl (Merck, M9272), CaCl2 2 mM (Merck, C3881), 5 mM d-trehalose (Merck, 9531), 30 mM sucrose (Merck, S9378) and 5 mM HEPES hemisodium salt (Merck, H7637). At the end of the procedure, any remaining solution was absorbed and a fresh 90-µl droplet was applied on the preparation.
For measuring mitochondrial Ca2+ levels in vivo, confocal excitation was achieved using dual excitation at 488 nm (Mito4x-LA-GCaMP6s) and 633 nm (mCarmine). Images (512 × 250) were acquired at a rate of one image every 1.5 s. Calcium levels were measured by quantifying Mito4x-LA-GCaMP6s and normalizing it by the mCarmine signal as both are driven by the same GAL4-UAS system. The Mito4x-LA-GCaMP6s and mCarmine signals were recorded for 5 min to calculate the average Mito4x-LA-GCaMP6s/mCarmine ratio over this period. The ROIs were delimited by hand around each visible MB vertical lobe. The final ratios were normalized for each experiment using the average ratio of the unpaired dataset for each genotype. The final normalized ratios were pooled together. The indicated ‘n’ is the number of animals that were assayed in each condition.
For measuring pyruvate fluxes in vivo, two-photon imaging was performed using a Leica TCS-SP5 upright microscope equipped with a ×25, 0.95-NA water immersion objective. Two-photon excitation was achieved using a Mai Tai DeepSee laser tuned to 825 nm. Images (512 × 150) were acquired at a rate of two images per second. Measurements of pyruvate consumption were performed according to a previously well-characterized protocol19. After 1 min of baseline acquisition, 10 μl of a 50 mM sodium azide solution (Merck, 71289; prepared in the same artificial haemolymph solution) were injected into the 90-μl droplet bathing the fly’s brain, bringing sodium azide to a final concentration of 5 mM. Image analysis was performed as previously described19. ROIs were delimited by hand around each visible MB vertical lobe, and the average intensity of the mTFP and Venus channels over each ROI was calculated over time after background subtraction. The Pyronic sensor was designed so that FRET from mTFP to Venus decreases when the pyruvate concentration increases. To obtain a signal that positively correlates with pyruvate concentration, the inverse FRET ratio was computed as mTFP intensity divided by Venus intensity. This ratio was normalized by a baseline value calculated over the 1-min preceding drug injection. The slope was calculated between 10% and 70% of the plateau. The indicated ‘n’ is the number of animals that were assayed in each condition.
Aversive olfactory conditioning and memory test in D. melanogaster
The behavioural experiments, including sample sizes, were conducted similarly to previous studies from our research group19,154. For all experiments, training and testing were performed in a soundproof and odour-proof room at 25 °C and 80% humidity. Experimental flies (male and female) were transferred to fresh bottles containing standard medium on the day before conditioning for the non-induced condition. For the induced condition, flies were transferred 2 days before the experiment at 30.5 °C to allow RNAi expression.
Conditioning
Flies were conditioned by exposure to one odour paired with electric shocks and subsequent exposure to a second odour in the absence of shock. A barrel-type machine was used for simultaneous automated conditioning of six groups of 40–50 flies each. Throughout the conditioning protocol, each barrel was attached to a constant air flow at 2 l min−1. The odorants 3-octanol and 4-methylcyclohexanol, diluted in paraffin oil at 0.360 mM and 0.325 mM, respectively, were alternately used as conditioned stimuli (CS+). For a single cycle of associative training, flies were first exposed to an odorant (the CS+) for 1 min while 12 pulses of 5-s long, 60-V electric shocks were delivered; flies were then exposed 45 s later to a second odorant without shocks (the CS−) for 1 min. Here, the groups of flies were subjected to one of the following olfactory conditioning protocols: 1 cycle training (1×) or five associative cycles spaced by 15-min intertrial intervals (5× spaced conditioning). Non-associative control protocols (unpaired protocols) were also used for in vivo imaging experiments. During unpaired conditioning, the odour and shock stimuli were delivered separately in time, with shocks occurring 3 min before the first odorant. After training and until memory testing, flies were kept on regular food at 25 °C (for 3 h memory test) or at 18 °C (for 24 h memory test).
Memory test
The memory test was performed either 3 h after 1× conditioning or 24 h after 1× or 5× spaced conditioning in a T-maze apparatus comprising a central elevator to transfer the flies to the centre of the maze arms. During the test, flies were exposed simultaneously to both odours (the same concentration as during conditioning) in the T-maze. After 1 min of odorant exposure in the dark, flies were trapped in either T-maze arm, retrieved and counted. A memory score was calculated as follows according to equation (10):
$${\rm{PI}}=\,\frac{{({\rm{\#}}{\rm{CS}}}^{-})-{({\rm{\#}}{\rm{CS}}}^{+})}{{\rm{\#}}{\rm{total}}\,}$$
(10)
where PI is the performance index, #CS− is the number of flies avoiding the conditioned odour, and #CS+ is the number of flies preferring the conditioned odour. A single memory score is the average of two scores obtained from two groups of genotypically identical flies conditioned in two reciprocal experiments, using either odorant (3-octanol or 4-methylcyclohexanol) as the CS+. The indicated ‘n’ is the number of independent memory score values for each genotype.
Odour perception test
The olfactory acuity of flies was tested after conditioning with the CS+, as electric shocks modify their olfactory perceptions. Flies were then immediately tested in a T-maze, where they had to choose between the CS− or its solvent (paraffin oil). Odour concentrations used in this assay were the same as for the memory assays. At these concentrations, both odorants are innately repulsive. The odour-interlaced side was alternated for successively tested groups. After 1 min, flies were counted, and naive odour avoidance was calculated as for the memory test.
Electric shock perception test
During the test, flies must choose between two barrels: one delivering the electric shocks, and one that is neutral. The compartment where the electric shocks are delivered was alternated between two consecutive groups. After 1 min, flies were counted, and shock avoidance was calculated as for the memory test.
Quantitative PCR on D. melanogaster brains
To assess the efficiency of Letm1 RNAi lines to knock down Letm1 in MB neurons, female flies carrying the tubulin-Gal80ts;VT30559-Gal4 MB neuron driver were either crossed with UAS-Letm1 RNAi no. 1 or UAS-Letm1 RNAi no. 2 males, or with CS males for controls. In flies, Letm1 is encoded by three very similar transcripts (FBtr0072348 Letm1-RB, FBtr0072349 Letm1-RC, FBtr0072347 Letm1-RA), all producing the same 1,013 amino acid protein isoform (UniProt P91927, Ensembl Canonical, APPRIS P1). Thus, both RNAi used target the single Letm1 protein isoform expressed in Drosophila. Fly progeny was raised at 23 °C throughout development. Newly hatched flies were transferred to fresh food vials at 30.5 °C for 4 days of induction before RNA extraction, as previously reported155. RNA extraction and cDNA synthesis were performed using the RNeasy Plant Mini Kit (Qiagen), RNA MinElute Cleanup Kit (Qiagen), oligo(dT)20 primers and the SuperScript III First-Strand kit (Thermo Fisher Invitrogen). Amplification was performed using a LightCycler 480 (Roche) and the SYBR Green I Master mix (Roche). Specific primers used for Letm1 cDNA are forward 5′-GCCCAGAATGTCTACAAGCG-3′ and reverse 5′-GCGGGTTCATCTGTGACGTT-3′ and for the reference αTub84B (Tub, CG1913) cDNA: forward 5′- TTGTCGCGTGTGAAACACTTC-3′ and reverse 5′ CTGGACACCAGCCTGACCAAC-3′. The level of Letm1 cDNA was compared against the level of the αTub84B reference cDNA. Each reaction was performed in triplicate. The specificity and size of amplification products were assessed by melting curve analyses. Expression relative to the reference was presented as the fold change compared to the calibrator (relative quantification RQ = 2−ΔΔCt, where Ct is the cycle threshold).
Aversive olfactory conditioning and memory test (Mus musculus)
Drugs
LiCl (Merck, 203637) was dissolved in saline (0.9% NaCl solution) to obtain a working solution of 0.3 M concentration. For the conditioned odour aversion protocol, a banana odour (isoamyl acetate solution at 0.05% in water) and an almond odour (benzaldehyde solution at 0.01% in water) were used.
Stereotaxic surgeries
C57BL/6J male mice of 7–8 weeks of age were anaesthetized with a mixture of ketamine–medetomidine (75:1 mg per kg body weight) and placed in a stereotaxic apparatus. Animals were infused bilaterally in the dorsal hippocampus (ML ± 1.5; AP −2; DV −1.5) with 500 nl of control virus (pAAV[mir-30]-CamK2(short)>mRFP1: scramble) or shLETM1 virus (pAAV[mir-30]-CamK2-mir-30-shRNA no. 1]: WPRE) with a flow rate of 1 nl s−1. At the end of all behavioural tests, animals were anaesthetized with a cocktail mixture of ketamine–xylazine (50:20 mg per kg body weight) and perfused with 4% paraformaldehyde in 0.1 M phosphate buffer. Next, brains were removed to confirm the expression of the viral infection by fluorescence microscopy.
Conditioned odour aversion
Four weeks after the stereotaxic surgeries and before assessing the conditioned odour aversion protocol, mice were placed in a behavioural chamber (25 × 15 cm) to evaluate locomotor activity for 20 min. Subsequent analysis was done by combining DeepLabCut156 and the BehaviorFlow package157, which enables automated behavioural tracking and classification. Next, the conditioned odour aversion was assessed in mice using two odours and LiCl, based on a modified protocol described previously. Briefly, the principle of this task is that if we devalue one of the odours by coupling it with an injection of LiCl (unconditioned stimulus), mice will prefer the non-conditioned odour (conditioned stimulus, CS−) over the devalued one (aversive conditioned stimulus, CS+). During the protocol, mice were individualized only during the 1-h access to the drinking bottles and then returned to grouped housing. Before starting the first day of the protocol, mice were water deprived for 24 h, and this water deprivation lasted for 5 consecutive days of the protocol. During the first 2 days of habituation, individualized mice had access to the two water drinking bottles for 1 h each day. On the third day, mice received two identical bottles of water but containing the banana or almond odours (randomized) and after 1 h, one odour was devalued (CS+) with an intraperitoneal injection of LiCl (0.3 M concentration; 10 ml per kg body weight). LiCl causes gastric malaise that causes a reduction in locomotor activity due to the sickness. On the fourth day, mice had 1 h of access to bottles of water along with the second odour (CS−) and at the end of this session mice were injected intraperitoneally with an innocuous physiological solution (0.9% NaCl). To assess MTM, on the fifth day a two-bottle choice test was conducted, offering access to both water-based odours for 1 h. Preferences were assayed by quantifying consumption of each bottle (Extended Data Fig. 4a). The bottle positions were alternated to avoid bias. To assess LTM, the two-bottle test was repeated after 10 days, following a 24-h water deprivation period and preference was quantified using the same method (Extended Data Fig. 4b). The time points selected to study MTM (1 day) and LTM (10 days) in this study were chosen in mice to be approximately proportional to those tested in Drosophila by relativizing them to species lifespan.
Statistics and reproducibility
Statistical analyses were performed in GraphPad Prism v8 for Windows. For each dataset, distributional assumptions were checked (Shapiro–Wilk test and inspection of residuals) and, based on this, either parametric or non-parametric tests were used appropriately. Exact tests used, sample sizes (n) and exact P values are reported in the figure legends. Data are shown as the mean ± s.e.m. For experiments with more than two groups, analyses included ANOVA (or Kruskal–Wallis for non‑parametric data) with appropriate post hoc multiple‑comparison corrections as specified in the figure legends.
In each figure, n denotes independent biological replicates. For single-neuron measurements, each biological replicate is considered a single neuron. For fly memory tests, each biological replicate is a measurement involving several flies, as indicated in each case. For in vivo fly imaging, each fly used is a biological replicate. For in vivo mouse work, each mouse is a biological replicate. Multiple measurements made from the same biological sample (for example, multiple fields of a single axon or repeated runs from the same lysate) were treated as technical replicates; technical replicates were averaged within each biological replicate and were not used to increase n. All key findings were reproduced in at least three independent experiments unless otherwise indicated. Uncropped western blots corresponding to the cropped panels shown in the figures are provided in the Supplementary Information.
No statistical methods were used to predetermine sample sizes, but our sample sizes are similar to those reported in previous publications10,99,140. No data were excluded from the analyses. Phenotype studies were randomized to minimize potential bias. For each experimental replicate, the order in which phenotypes were analysed was alternated systematically. In cases involving two groups, such as A and B, we ensured that the sequence alternated (for example, A, B, B, A, B, A, A, B) to account for any order effects. The investigators were not blinded to allocation during experiments and outcome assessment. No formal randomization was used. To minimize batch and time‑dependent effects, experiments were blocked by culture preparation/day and data acquisition was interleaved across groups.
Significance is denoted by *P < 0.05, **P < 0.01, ***P < 0.001 and ****P < 0.0001.
First Appeared on
Source link

