A µ-opioid receptor superagonist analgesic with minimal adverse effects
Binding screen
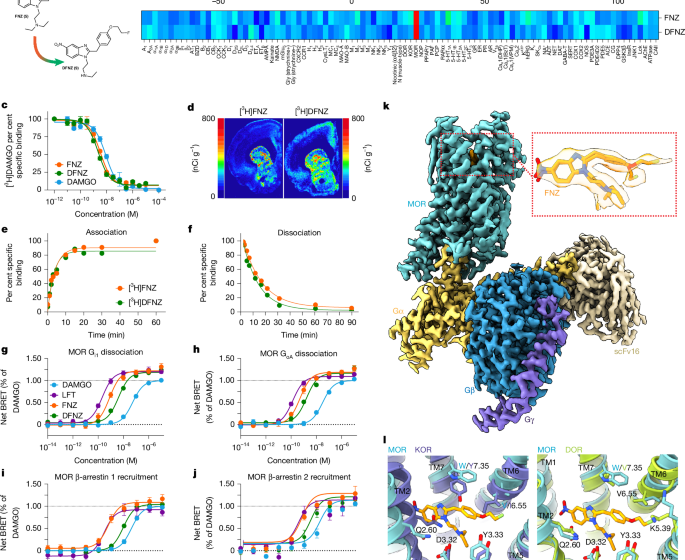
These experiments were performed by a commercial vendor (Eurofins) under contract with the National Institutes of Health (NIH). Membrane homogenates from stable cell lines or animal tissues expressing each protein were incubated with the respective radioligand in the absence or presence of FNZ or DFNZ (100 nM and 10 μM). In each experiment, the respective reference compound was tested concurrently with the test compound to assess the assay reliability. Nonspecific binding was determined in the presence of a specific agonist or antagonist at the target. Following incubation, the samples were filtered rapidly under vacuum through glass fibre filters presoaked in buffer and rinsed several times with an ice-cold buffer using a 48-sample or 96-sample cell harvester. The filters were counted for radioactivity in a scintillation counter using a scintillation cocktail.
Animals
Sprague Dawley rats (6 to 8 weeks old) were purchased from Charles River. C57BL/6 J mice (8 weeks old) were obtained from Charles River or Jackson Laboratory. Adult TH-Cre mice (B6.Cg-7630403G23RikTg(Th-cre)1Tmd/J) (10 to 12 weeks old) were bred at the National Institute on Drug Abuse (NIDA). Oprm1-knockout mice (B6.129S2-Oprm1tm1Kff/J) were obtained from Jackson Laboratory (strain 007559) (6 to 8 weeks old). PGP/BCRP-knockout mice (FVB.129P2-Abcb1atm1BorAbcb1btm1BorAbcg2tm1Ahs) (6 to 8 weeks old) were obtained from Taconic Biosciences. Animals were single or group housed in an environment with stable temperature (21–23 °C) and humidity (35–55%) and maintained on a 12 h:12 h light:dark reverse cycle with ad libitum access to food and water. Experiments and procedures complied with ethical regulations for animal testing and research, followed the NIH guidelines and were conducted according to the guidelines and approved by the Institutional Animal Care and Use Committees at the National Institute on Drug Abuse, the Chobanian and the Avedisian School of Medicine at Boston University and the University of Barcelona. Animals were randomly assigned to experimental groups and treatment conditions. Sample sizes were estimated based on experience from past work. The experimenters were blinded to the group allocation and treatment when applicable and as noted below.
Competition binding assays
Dissected rat brains (minus cerebellum) were suspended in Tris-HCl 50 mM buffer supplemented with protease inhibitor cocktail (1:1,000) and disrupted with a Polytron homogenizer (Kinematica). Homogenates were centrifuged at 48,000g (50 min, 4 °C) and washed twice in the same conditions to isolate the membrane fraction. Protein was quantified by the bicinchoninic acid method (Pierce). Membrane preparations were incubated with 50 mM Tris-HCl (pH 7.4) containing [3H]DAMGO (~5 nM, 46 Ci mmol−1, NIDA Drug Supply) and increasing concentrations (10 nM to 1 mM) of FNZ, DFNZ or DAMGO. Nonspecific binding was determined in the presence of 100 μM of unlabelled DAMGO. Free and membrane-bound radioligand were separated by rapid filtration of 500-μl aliquots in a 96-well plate harvester (PerkinElmer) and washed with 2 ml of ice-cold Tris-HCl buffer. Microscint-20 scintillation liquid (65 μl per well, PerkinElmer) was added to the filter plates, plates were incubated overnight at room temperature, and radioactivity counts were determined in a MicroBeta2 plate counter with an efficiency of 41%. One-site competition curves from three independent experiments with three replicates per experiment were fitted using GraphPad Prism 10 (GraphPad Software). Ki values were calculated using the Cheng–Prusoff equation.
Kinetic binding assays
Association
To each well was added 150 µl membrane preparation from cells expressing human MOR (hMOR) (Revvity, ES-542-M400UA) and 50 µl of naloxone (Tocris) or buffer (50 mM Tris, 10 mM MgCl2, 0.1 mM EDTA (pH 7.4)). The plate was pre-incubated for approximately 30 min. [3H]FNZ (~0.3 nM, 43 Ci mmol−1, Novandi Chemistry) or [3H]DFNZ (~0.3 nM, 54 Ci mmol−1, Novandi Chemistry) solution (50 µl in buffer) was then added over fixed time intervals between 0–120 min.
Disassociation
To each well was added 150 µl hMOR membranes and 50 µl radioligand solution in buffer. In three wells, 50 µl of naloxone was added at the start of the assay to serve as nonspecific binding for all dissociation timepoints. The plate was then incubated for 90 min with gentle agitation to allow equilibrium to be reached. Dissociation was initiated by adding 50 µl of naloxone (10 µM final assay concentration) at various intervals between 0–120 min.
Filtration
All incubations were stopped by vacuum filtration onto presoaked (buffer with 0.1% polyethyleneimine (PEI)) GF/C filters using a 96-well FilterMate harvester, followed by 5 washes with ice-cold wash buffer. Filters were then dried under a warm air stream, sealed in polyethylene, scintillation cocktail added, and the radioactivity counted in a Wallac TriLux 1450 MicroBeta counter.
Data analysis
For each association and dissociation time point, nonspecific binding was subtracted from total binding to give specific binding. Data from two independent experiments with two replicates per experiment was fitted to standard ligand association and dissociation models using the nonlinear curve-fitting routines in GraphPad Prism 10. Dissociation curves were plotted initially to obtain koff and dissociation half-life (t1/2). To plot the association curves, the koff calculated from the dissociation curves was used as an input parameter for the curve-fitting routine.
[3H]FNZ and [3H]DFNZ autoradiography
Frozen rat or mouse brain tissue was sectioned (20 µM) on a cryostat (Leica) and thaw mounted on glass slides and stored at −80 °C until day of experiment. Slides were pre-incubated (10 min, room temperature) in incubation buffer (50 mM Tris-HCl, 1 mM MgCl2, 5 mM KCl, 2 mM CaCl2, pH 7.4), then incubated (60 min, room temperature) in incubation buffer containing 4 nM [3H]FNZ (43 Ci mmol−1) or 4 nM [3H]DFNZ (54 Ci mmol−1). Nonspecific binding was determined in the presence of 10 µM naloxone. The sections were then washed by 2× 30 s washes in their respective Tris buffers. Finally, slides were dipped in ice-cold distilled water to remove salts. The slides were exposed to the phosphor screen for 7 days and then imaged using a Typhoon biomolecular imager (Cytiva). The digitized images were calibrated using 14C standard slides (American Radiolabeled Chemicals).
BRET assays
Plasmids used for G-protein dissociation assays include Gαi1-RLuc8, GαoA-RLuc8, Gβ and Gγ-GFP2, each procured from the Trupath library69 and MOR with an N-terminal haemagglutinin signal sequence and Flag tag. Plasmids used in β-arrestin recruitment assays include GRK2, MOR–Rluc8 and β-arrestin 1/2–mVenus. G-protein signalling data were determined by measuring the decrease in BRET signal following agonist-induced receptor activation and subsequent dissociation of Gα–RLuc8 from Gβ/Gγ–GFP2. Initially, suspension HEK293 cells (sourced from ATCC, untested for mycoplasma contamination) were grown in FreeStyle 293 Expression Medium (ThermoFisher Scientific) to a cell density of ~1.25 × 10⁶ and transfected using PEI and an equimolar mixture of MOR, Gα-RLuc8, Gβ and Gγ-GFP2 plasmids for a total of 600 ng DNA per ml of cells. Transfected cells were grown for 48–72 h. Serial dilutions of agonist were prepared with assay buffer (1× HBSS, 0.1% BSA, and 6 mM MgCl2) and 30 µl was transferred to a 96-well opaque plate (Corning). 1 ml of transfected cells were then centrifuged for 1 min at 700g and resuspended in 7 ml assay buffer with 5 μg ml−1 coelenterazine 400a (Cayman Chemical). The assay was initiated by adding 60 µl of cells into each well for a final volume of 90 µl and read for 15 min using a SpectraMax iD5 plate reader with emission wavelengths of 410/515 nm and an integration of time of 1 s. Similarly, the recruitment of β-arrestin 1 and 2 was monitored via BRET. RLuc8 and mVenus were fused to the C-terminus of MOR and N-terminus of β-arrestin 1/2, respectively. In this assay, BRET increases as β-arrestin is recruited to MOR. Otherwise, methods were identical to those used to measure G-protein dissociation, except cells were transfected with a 1:1:5 ratio of MOR-RLuc8:β-arrestin-mVenus:GRK2, and cells were resuspended with assay buffer containing coelenterazine h (Cayman Chemical) instead of coelenterazine 400a. Finally, the reaction was measured with emission wavelengths of 485/535 nm. Computed BRET ratios (GFP2 or mVenus/RLuc8) at 00:03:50, 00:07:36, and 00:11:23 (hh:mm:ss) were averaged and ligand-free well readings were subtracted from the ligand-treated control well readings for net BRET values. The Emax value of DAMGO (MedChemExpress) was determined by measuring the net BRET tangent to the plateau of the dose–response curve. Each reading was then normalized to the DAMGO Emax value by subtracting the min asymptote of the DAMGO positive control and dividing by the span of the DAMGO positive control (maximum asymptote–minimum asymptote). Normalized values from three independent experiments were then plotted as a function of concentration for each biological triplicate and fit with a three-parameter logistic nonlinear regression model with GraphPad Prism 10.
Kinetic BRET assays
The BRET-based Go (GαoA) protein activation and β-arrestin 2 recruitment assays were performed as described previously46,70. In brief, Go protein activation assay uses Renilla luciferase 8 (Rluc8)-fused GαoA and mVenus-fused Gγ2 as the BRET pair, co-transfected with MYC-tagged hMOR and Gβ1 in the µg ratio 5:1:4:5 (hMOR:GαoA:Gβ1:Gγ2). The β-arrestin 2 recruitment assay uses RLuc8-fused hMOR with a MYC tag and mVenus-fused β-arrestin 2 as the BRET pair, co-transfected with GRK2 in the µg ratio 0.5:6.5:5(hMOR:β-arr2:GRK2)46. HEK293T cells (sourced from ATCC, tested for mycoplasma contamination) were transiently transfected with the above constructs using PEI at a ratio of 2:1 (PEI:total DNA by mass). After ~48 h of transfection, cells were washed, collected and resuspended in PBS + 0.1% glucose + 200 µM sodium bisulfite buffer. Two-hundred thousand cells were then transferred to each well of the 96-well plates (White Lumitrac 200, Greiner Bio-One) followed by addition of 1 µg µl−1 coelenterazine H, a luciferase substrate for BRET. Three minutes after addition of coelenterazine H, ligands were added to each well. For kinetic experiments, cells were incubated at 25 °C within the PHERAstar FSX plate reader with BRET signal measurements collected in 2-min cycles from 2–46 min. BRET ratio was calculated as the ratio of mVenus (535 nm) over RLuc8 (475 nm) emission. Data were collected from at least 9–10 independent experiments performed in triplicate and normalized to maximal basal-subtracted BRET signal by DAMGO (Cayman Chemical) as 100%. Data analysis and statistical testing were performed using GraphPad Prism 10. In brief, we performed three-parameter dose–response regressions for all compounds at each time point. For every tested concentration, we calculated the net BRET ratio by subtracting the minimum response derived from the fitted raw BRET curve. Representative kinetics of maximum net BRET ratios for the tested compounds in both assays are shown in Extended Data Fig. 5. The maximum net BRET ratio for each compound was then normalized to that of DAMGO at the corresponding time point (reported as %Emax) by dividing each value by the span of the DAMGO positive control (maximum asymptote–minimum asymptote). Kinetics of the averaged pEC50 and %Emax values were subsequently plotted in Fig. 2. To evaluate whether the test compounds exhibited Go protein versus β-arrestin 2 signalling bias, bias factors were calculated using the Emax − EC50 method as follows.
To calculate the bias, we first defined a proxy transduction index (TI; distinct from the transduction coefficient) as:
$${\rm{TI}}={\log \left(\frac{ \% {{E}}_{\text{max}}}{{{\rm{E}}{\rm{C}}}_{50}}\right)}_{{\rm{c}}{\rm{o}}{\rm{m}}{\rm{p}}{\rm{o}}{\rm{u}}{\rm{n}}{\rm{d}}}$$
Then using the index of DAMGO as the reference, we derived bias as follows:
$$\begin{array}{c}{\rm{\Delta TI}}={\mathrm{TI}}_{\mathrm{compound}}-{\mathrm{TI}}_{\mathrm{DAMGO}}\\ {\mathrm{bias}}_{x}={{\rm{\Delta TI}}}_{{{\rm{G}}}_{0}}-{{\rm{\Delta TI}}}_{\mathrm{\beta arr}2}\end{array}$$
where \(x\) indicates a specific time point.
The s.e.m. of TI was calculated as follows:
$${\rm{s.\; e.\; m.}}=\frac{\sigma }{\sqrt{n}}$$
Where σ is the s.d. and n is the number of experiments. Similar to a previous work71, the estimated standard error (SE) for ΔTI for each compound in a given assay is calculated as:
$${\mathrm{SE}}_{\mathrm{assay}}=\sqrt{{{(\mathrm{SEM}}_{\mathrm{compound}})}^{2}+{{(\mathrm{SEM}}_{\mathrm{DAMGO}})}^{2}}$$
Standard error of bias between the Go and β-arrestin 2 pathways:
$${\mathrm{SE}}_{\mathrm{final}}=\sqrt{{{(\mathrm{SE}}_{{{\rm{G}}}_{0}})}^{2}+{{(\mathrm{SE}}_{\mathrm{\beta arr}2})}^{2}}$$
Agonist-stimulated [35S]GTPγS autoradiography
Frozen rat brain tissue was sectioned (20 µM) on a cryostat (Leica) and thaw mounted on glass slides. Preincubation buffer was pipetted onto each slide and incubated for 20 min at room temperature (50 mM Tris-HCl, 1 mM EDTA, 5 mM MgCl2 and 100 mM NaCl). The buffer was removed via aspiration and incubated for 60 min in preincubation buffer containing 2.7 mM GDP and 1.3 µM DPCPX. GDP buffer was removed and [35S]GTPγS cocktail (GDP buffer, 20 mM dithiothreitol (DTT), 300 nm [35S]GTPγS) with agonists of interest (FNZ 10 μM; DAMGO 10 μM, DFNZ 10 μM), without agonists (basal condition), or with a saturated concentration of non-radioactive GTP (for nonspecific binding) was pipetted onto each slide and incubated for 90 min. The [35S]GTPγS cocktail was removed via aspiration and slides were washed in ice-cold buffer (50 mM Tris-HCl, 5 mM MgCl2, pH 7.4) for 5 min (2×) followed by a 30 sec dip in ice-cold water. Slides were apposed to a BAS-SR2040 phosphor screen (Cytiva) for 3 days and imaged using a Typhoon biomolecular imager (Cytiva). The digitized images were calibrated using 14C standard slides (American Radiolabeled Chemicals). Regions of interest (ROIs) were hand-drawn based on anatomical landmarks and radioactivity was quantified using Multigauge v.3.0 software (Fujifilm) and expressed as per cent binding of the basal condition.
Cryo-electron microscopy
Pellets of mouse MOR were thawed and suspended in a hypotonic lysis buffer containing 20 mM HEPES pH 7.5, 1 mM EDTA pH 8.0, 1 mM MgCl2, 100 μM TCEP, 10 μM naloxone, protease inhibitor cocktail and benzonase. The solution was stirred at 100 rpm at 4 °C for 1 h before centrifugation at 100,000g. Membrane pellets were then resuspended in 500 mM NaCl, 20 mM HEPES pH 7.5, 1 mM MgCl2, 10% glycerol, 10 μM Naloxone, 100 μM TCEP, 1 mM benzamidine, protease inhibitor cocktail, and stock detergent was slowly added while stirring at 100 rpm at 4 C to a final concentration of 1% lauryl maltose neopentyl glycol (LMNG), 0.2% cholesteryl hemisuccinate (CHS), 0.2% cholate. Solubilization was then allowed to proceed for 3 h, with 2 mg ml−1 iodoacetamide added at the 30 min and 1 h points. Solution was ultracentrifuged at 100,000g to remove insoluble material, the supernatant was supplemented with 20 mM imidazole, and the solution was gravity-loaded over Ni-NTA resin at 8 °C. The sample was washed with 10 column volumes of buffer containing 500 mM NaCl, 20 mM HEPES pH 7.5, 20 mM imidazole, 0.1% LMNG, 0.01% CHS, 10 μM naloxone, 100 μM TCEP; and eluted with a buffer containing 250 mM NaCl, 20 mM HEPES pH 7.5, 250 mM imidazole, 0.05% LMNG, 0.005% CHS, 10 μM naloxone, and 10% glycerol. The eluent was supplemented with 5 mM CaCl2 and loaded onto M1 Flag resin, washed with buffer containing 20 mM HEPES pH 7.5, 250 mM NaCl, 2 mM CaCl2, 0.01% LMNG, 0.001% CHS, 10 μM naloxone; and eluted with buffer containing 20 mM HEPES pH 7.5, 250 mM NaCl, 1 mM EDTA, 0.01% LMNG, 0.001% CHS, 10 μM naloxone, 10% glycerol, and 0.1 mg ml−1 Flag peptide. The eluent was supplemented with 100 μM TCEP, concentrated, and loaded on to an Enrich 650 column for size-exclusion chromatography in buffer containing 100 mM NaCl, 20 mM HEPES pH 7.5, 0.01% LMNG, 0.001% CHS, and 100 μM TCEP. Fractions containing monomeric MOR were concentrated and used immediately for G-protein complexation. G protein and scFv16 were purified as described previously72.
Formation and purification of MOR–Gi complex
Purified MOR was incubated with 100 μM of FNZ for 1 h on ice before addition of a molar excess of purified G-protein heterotrimer and scFv16. Complexation was incubated for 1 h on ice before addition of 2 μl apyrase solution and incubation overnight on ice to allow complexation and GDP depletion to complete fully. Solution was then diluted with buffer containing 100 mM NaCl, 20 mM HEPES pH 7.5, 0.01% LMNG, 0.001% CHS, 5 mM CaCl2 and 20–100 μM agonist; then loaded over M1 Flag resin. Resin was washed with buffer containing 100 mM NaCl, 20 mM HEPES pH 7.5, 0.005% LMNG, 0.0005% CHS, 1 CaCl2, and 10–50 μM agonist, and eluted into a buffer containing 100 mM NaCl, 20 mM HEPES pH 7.5, 0.002% LMNG, 0.0002% CHS, 1 EDTA, 0.1 mg ml−1 Flag peptide, 10% glycerol, and 20–100 μM agonist. Once eluted, 100 μM TCEP was added and complex was concentrated and then loaded onto a size-exclusion chromatography Enrich 650 column in buffer of 100 mM NaCl, 20 mM HEPES pH 7.5, 0.001% LMNG, 0.0001% CHS, 0.00033% glyco-diosgenin, 100 μM TCEP, 2 mM MgCl2 and 1–100 μM agonist. Fractions containing complex were then concentrated to 10 mg ml−1 for cryo-EM sample preparation and also evaluated by negative stain EM73.
Cryo-EM sample preparation and data collection
All samples were prepared on glow-discharged holey gold grids with gold support (ultrAufoil R1.2/1.3). Three microlitres of MOR–Gi sample was loaded into an FEI Vitrobot Mark IV with the chamber held at 4 °C and 100% humidity. Vitrification was performed with blot time set to 3 s. Cryo-EM data were collected on a Titan Krios electron microscope at an accelerating voltage of 300 kV with the Smart EPU software v.2.1 and a Gatan K3 direct electron detector/bioquantum energy filter. Pixel sizes, frames, and electron doses for each dataset are provided in Extended Data Fig. 4.
Data processing
Tiff files were imported in Relion74 for motion correction with MotionCorr275, CTF estimation with CTFFIND476, and template-based particle picking. Binned extracted particles were then imported into CryoSPARC77 for 2D and 3D classification. Particle stacks were then refined with the nonuniform refinement routine and transferred back to Relion for re-extraction of unbinned particles. Particles were refined in Relion and subjected to Bayesian polishing. All particle stacks were then imported back into CryoSPARC for final nonuniform refinement and local refinement.
Model building
Initial models were based off prior cryo-EM structures of MOR–Gi with PDB 6DDE72. Manual model building was performed in Coot v.0.9.8.1 EL78 with refinement in Phenix79. GlideEM was used to validate the ligand poses with the higher resolution maps as well as the poses80.
APEX reaction, biotinylated protein enrichment and preparation for mass spectrometry analysis
HEK293T cells (sourced from ATCC, tested for mycoplasma contamination) expressing the APEX2 enzyme fused to the human MOR (MOR–APEX)17 and the spatial reference APEX constructs (for plasma membrane, early endosome, late endosome/lysosome and cytoplasm as described previously17,81) were cultured in 6-well plate format and incubated with 500 μM biotin-phenol at 37 °C for 30 min. The receptor was activated with 10 μM DAMGO, 100 nM FNZ, and 100 nM DFNZ (all saturating concentrations) over a time course of 30 min. The spatial reference APEX samples were not treated with the ligands. APEX labelling was initiated pre-activation (time 0) and after 1, 5, 10 and 30 min of activation by 1:3 mixing of the H2O2-containing medium (1 mM H2O2 final) with the biotin-phenol containing medium at room temperature. After 45 s of the biotinylation reaction, the cells were washed 3 times (1 min each) with ice-cold quench buffer (PBS supplemented with 10 mM sodium ascorbate, 10 mM sodium azide, and 5 mM Trolox). Cells were then collected in 1 ml of quench buffer and pelleted by centrifugation at 4 °C for 10 min at 3,000g. For cell lysis, cells were homogenized using probe sonication in RIPA buffer (50 mM Tris, 150 mM NaCl, 1% Triton X-100, 0.25% sodium deoxycholate, 0.25% SDS, pH 7.4) supplemented with 10 mM sodium ascorbate, 10 mM sodium azide, 5 mM Trolox, 1 mM DTT and protease inhibitors (Roche Complete). To remove the cell debris, cell lysate was centrifuged at 10,000g for 10 min, and the supernatant was taken for streptavidin enrichment of biotinylated proteins. The enrichment of biotinylated proteins was automated with the KingFisher Flex (Thermo Fisher Scientific) as described previously81. In brief, supernatants were incubated at 4 °C for 18 h with 15 μl magnetic streptavidin beads (Pierce Streptavidin Magnetic Beads, Thermo Fisher Scientific) which were pre-washed twice with RIPA buffer. Following incubation, beads were washed three times with RIPA buffer, one time with 1 M KCl, one time with 0.1 M Na2CO3, one time with 2 M urea in 50 mM Tris-HCl (pH 8) buffer, and two times with 50 mM Tris-HCl (pH 8) buffer. Beads were maintained in 100 μl of 2 M urea in 50 mM Tris-HCl (pH 8) buffer for on-bead digestion of proteins. Samples were reduced with 5 mM TCEP (Tris(2-carboxyethyl)phosphine) at 37 °C for 30 min, followed by alkylation with 5 mM IAA (Iodoacetamide) at room temperature in the dark for another 30 min, which was quenched by addition of DTT (5 mM final). For tryptic digestion, 0.5 μg trypsin and 0.25 μg LysC was added to beads and incubated with shaking at 37 °C for 6 h. Supernatants were taken and saved for desalting using NEST C18 MicroSpin columns.
Unbiased mass spectrometric data acquisition and protein quantification for APEX samples
MOR–APEX and spatial APEX reference samples were analysed on a TimsTOF HT mass spectrometry system (Bruker) coupled to a Vanquish Neo ultra high-pressure liquid chromatography (Thermo Fisher Scientific) interfaced via a CaptiveSpray2 nanoelectrospray source (Bruker). Samples were reconstituted in 0.1% formic acid and loaded onto a 15 cm × 75 μm internal diameter Aurora CSI column (IonOpticks). Mobile phase A consisted of 0.1% formic acid, and mobile phase B consisted of 0.1% formic acid/80% acetonitrile. Peptides were separated at a flow rate of 500 nl min−1 using a nonlinear gradient increasing buffer B from 2% to 80% over 23 min, followed by a 7 min wash at 95% B and column equilibration. The mass spectrometer acquired data in dia-PASEF mode using a 75 ms TIMS ramp, a 1/K0 range of 0.72–1.5, and an m/z range of 100–1,700. One TIMS precursor MS frame was followed by 9 dia-PASEF MS2 frames. Fragmentation windows had a mass width of 30 Da with an m/z overlap of 1 Da and were collected over an m/z range of 250–1,325 and a 1/K0 range of 0.68–1.40. The DIA data were analysed with Spectronaut (Biognosys, v.19.7) using direct DIA analysis default parameters for the identification and quantification of proteins. Normalization in Spectronaut was turned off. Data were searched against the Uniprot Human database (downloaded October 2024). Transition ion intensities from Spectronaut were summarized to protein intensities using the MSstats (v.4.10.1)82 function dataProcess with default settings only high quality were used (featureSubset = “highQuality”). All proteins with only one quantified peptide were left out of further analysis.
Statistical analysis of APEX mass spectrometry samples
Each protein’s trend over the time course after DAMGO, FNZ and DFNZ treatment was scored by fitting the log2 intensities with a continuous cubic-polynomial curve over time using the R functions lm and poly. To better fit the rapid changes, especially between time 0 and 1 min, the collected timepoints were encoded by their ranks (1, 2, 3, 4 and 5 for 0, 1, 5, 10 and 30 min). The model included an additive term for the batch; a protein’s background intensity was expected and allowed to vary between batches. The time-dependent model was compared with a null model that contained only the batch term using the R function anova to compute an F statistic and P value. The maximum mean change between time 0 and any single later time, after imputing any missing values using the fitted model, was used as the maximum log2 fold change for that protein. Proteins were considered significant interactors with the MOR–APEX construct using thresholds a maximum log2 fold change > log2 (1.5) over the time series and P value ≤ 0.05 from the ANOVA test.
Spatial coefficients calculation for MOR–APEX2 samples
To define location-specific proteins, proteins that varied between spatial references were scored using the MSstats82 function groupComparison to compare between each non redundant pair of spatial references. The input to MSstats was the entire set of spatial references with the MOR–APEX2 data excluded. MSstats reports pairwise differences in means as log2FC, and a pairwise P value calculated from a t-test assuming equal variance across all spatial references. A subset of 650 location-specific proteins was selected that could reliably distinguish locations by requiring P value < 0.005 and log2FC > 1.0 and observed intensity in all three replicates of at least one spatial reference greater than the 50th percentile of all observed protein intensities. For each MOR–APEX2 sample (each ligand, timepoints, and replicate), coefficients were calculated to estimate the contribution of each spatial reference to the observed protein intensity as described previously17. First, protein intensities were scaled linearly between 0 and 1 by setting the maximum observed intensity (across all spatial reference and MOR–APEX2 samples) for each protein to 1.0, and all other observations were set to the ratio of observed/maximum for that protein. Missing values were set to zero. A matrix representing protein intensities in the spatial references for all observed proteins (F) was constructed using mean (per spatial reference) scaled intensity. The location-specific subset matrix (S) was extracted from F by using only the rows of F that match the 650 location-specific proteins. S was then appended with three additional columns composed of randomly sampled values from S to minimize the occurrence of low but nonzero location coefficients where they were expected to be zero. Location coefficients for each MOR–APEX2 sample were then calculated using the nonnegative least-squares procedure in the R package nnls using the location-specific matrix S and the vector of location-specific protein scaled intensities from each MOR–APEX2 sample as inputs. We repeated this randomization and nnls procedure 1,000 times and used the median value for final spatial reference coefficients.
Opioid-induced hyperlocomotion
Locomotor activity was recorded immediately after wild-type (n = 12 mice per drug, 6 male and 6 female) or Oprm1-knockout mice (n = 8 mice per drug, 4 male and 4 female) were introduced in the activity chambers in an open field arena (Opto-varimex ATM3, Columbus Instruments). After habituation and saline injections, they were systemically administered varying doses of morphine (1, 3, 10, 30 or 100 mg kg−1, intraperitoneally), FNZ (1, 3, 10, 30, 100 or 300 µg kg−1, intraperitoneally) or DFNZ (0.03, 0.1, 0.3, 1, 3, 10 mg kg−1) and locomotor activity was recorded for a 60 min period.
Microsomal stability and metabolite identification studies
The phase 1 metabolic stability assay was performed in mouse liver microsomes as previously described83,84. In brief, the reactions were conducted in 200 mM potassium phosphate buffer, NADPH regenerating system (1.3 mM NADPH, 3.3 mM glucose-6-phosphate, 3.3 mM MgCl2, 0.4 U ml−1 glucose-6-phosphate dehydrogenase, 50 μM sodium citrate), and a final test compound concentration of 10 μM. Reactions were initiated with the addition of the mouse liver microsome (0.5 mg ml−1). Each reaction, in triplicate, was terminated with cold methanol at predetermined time points (0 min, 30 min and 60 min). Compound disappearance was monitored via high-performance liquid chromatography with tandem mass spectrometry (LC–MS). Chromatographic analysis was performed on a Dionex ultra high-performance liquid chromatography system coupled with Q Exactive Focus orbitrap mass spectrometer (Thermo Fisher). Separation was achieved using an Agilent Eclipse Plus column (100 × 2.1 mm internal diameter; maintained at 35 °C) packed with a 1.8 μm C18 stationary phase. The mobile phase was composed of 0.1% formic acid in acetonitrile and 0.1% formic acid in water with gradient elution, starting at 2.5% organic phase (from 0 to 0.25 min) linearly increasing to 99% (from 0.25 to 1.25 min), and re-equilibrating to 2.5% by 4 min. The total run time for each analysis was 5 min. Pumps were operated at a flow rate of 0.4 ml min−1. The mass spectrometer controlled by Xcalibur software 4.1.39.9 (Thermo Scientific) was operated with a HESI ion source in positive ionization mode for all compounds. Test compounds and metabolites were identified in the full scan mode (from m/z 75 to 1,125). The percentage remaining was calculated by comparing t = 0 min samples with t = 30 min and t = 60 min samples. Metabolites identification was performed by comparing t = 0 min samples with t = 60 min samples, and structures were proposed based on accurate mass information.
Efflux transporter panel and substrate assessment assays
These experiments were performed by a commercial vendor (Eurofins). For the efflux transporter panel (G346), membrane homogenates from stable cell lines were pre-incubated with FNZ or DFNZ followed by incubation with appropriate substrate and the presence or absence of an appropriate reference inhibitor. Results showing an inhibition >25% at a given efflux transporter are considered to represent significant effects of the test compounds and evidence that they interact with the given efflux transporter. For the PGP and BCRP substrate assessment assay (G357), permeability of FNZ and DFNZ was determined in the A–B and B–A directions with and without the addition of the PGP-specific inhibitor verapamil or the BCRP inhibitor KO143. For the MATE1 substrate assessment assay (5092), wild-type or MATE1-overexpressing HEK293 cells were incubated with FNZ or DFNZ for 2 min or 30 min with and without the MATE1 inhibitor pyrimethamine (5 µM). In each experiment, the respective reference compound was tested concurrently with the test compound to assess the assay reliability. Fluorescein was used as the cell monolayer integrity marker. Fluorescein permeability assessment (in the A–B direction at pH 7.4 on both sides) was performed after the permeability assay for the test compound. The cell monolayer that had a fluorescein permeability of less than 1.5 × 10⁻⁶ cm s−1 for Caco-2 was considered intact, and the permeability result of the test compound from intact cell monolayer was reported.
Equilibrium dialysis and plasma protein binding
Procedures were adapted from prior studies85,86. Undiluted rat plasma was spiked with 100 nM of [3H]FNZ or [3H]DFNZ in Tris-HCl and incubated at 37 °C for 1 h. Samples were loaded onto an equilibrium dialysis device (RED device, Thermofisher) and incubated at 37 °C for 4 h on a vertical shaker at 750 rpm. Samples were then counted for radioactivity using a liquid scintillation counter and plasma protein binding levels were calculated.
Analytical assays
Optima LC–MS-grade acetonitrile was acquired from Fisher Scientific. Ammonium formate was obtained from obtained from Honeywell. Methanol was obtained from Fisher Chemical. HPLC-grade water was obtained from Avantor. LC–MS-grade 0.1% formic acid in water was obtained from ThermoFisher. A master stock of 241 µM FNZ was prepared in methanol and stored at ≤−20 °C. Working stocks were prepared from the master stock and used to spike a calibration curve in blank plasma or tissue homogenate from 0.6–121 nM for plasma and 0.241–12.1 fmol mg−1 for tissue. For plasma measurements extraction was performed by protein precipitation with 300 µl acetonitrile to 100 µl plasma thawed from ≤−70 °C. The samples were shaken for 3 min at 2,000 rpm with a ThermoMixer C (Eppendorf) and centrifuged at 10,000 rpm for 10 min at 4 °C in a Sorvall ST 40R centrifuge (ThermoFisher). Three-hundred microliters of the supernatant were collected and evaporated to dryness at 40 °C under a stream of nitrogen gas in a Microvap Nitrogen Evaporator (Organomation). The residue was reconstituted in 50 µl of 90:10 10 mM ammonium formate in 0.1% formic acid/methanol and shaken for 3 min at 2,000 rpm. Ten microliters were injected into the UHPLC–MS system. Frozen brain tissue was thawed from ≤−70 °C and weighed. Tissue was transferred to a homogenizing tube containing ceramic beads and 2 ml of water was added per gram of tissue. Each tissue sample was homogenized using a Bead Ruptor 12 homogenizer (Omni International) for 3 cycles of 30 s each on high. Two-hundred and fifty microlitres of tissue homogenate were protein precipitated with 1 ml acetonitrile, shaken for 3 min at 2,000 rpm, and centrifuged at 10,000 rpm for 10 min at 4 °C. One millilitre of the supernatant was collected and evaporated to dryness at 40 °C under a stream of nitrogen gas. The residue was reconstituted with 75 µl of 90:10 10 mM ammonium formate/methanol and shaken for 3 min at 2,000 rpm. Ten microliters were injected into the UHPLC–MS system. Samples exceeding the upper limit of quantification were further diluted to fall within the analytical measuring range. Separation analysis was performed using a Vanquish UHPLC system (ThermoFisher) with tandem Orbitrap Exploris 120 mass spectrometer (ThermoFisher). Reverse phase chromatography was performed using an Accucore biphenyl 2.1 × 50 mm, 2.6 µm particle size column (ThermoFisher) with a gradient flow at 0.4 ml min−1, 10 mM ammonium formate in 0.1% formic acid as mobile phase A, and methanol as mobile phase B. The run started at 5% B for 0.5 min, increased to 95% B for 2.5 min, held at 95% B for 2 min, decreased to 5% B for 1 min, then held at 5% B for 1.5 min. Analysis was performed in positive ion mode with a full scan mass range of 300–500 m/z and a mass accuracy of 5 ppm. Ionization was conducted using a heated electron spray ionization (HESI) source. XCalibur v.4.4.16.14 (ThermoFisher) software was used to integrate and report peak area for the M + H ion (415.2137 m/z) at a retention time of 3.93 min. GraphPad Prism 10 was used to plot and fit a standard curve and to interpolate unknown values.
MOR occupancy
Rats (n = 6 per drug, 3 male and 3 female) were injected subcutaneously with saline, FNZ (5 µg kg−1), or DFNZ (0.3 or 1 mg kg−1) 15 min before decapitation and tissue extraction. Brains were flash-frozen and stored at −80 °C until processed. Flash-frozen brains were separated by hemisphere. One hemisphere was used for assessing concentration of FNZ or DFNZ. The other was sectioned (20 µm) on a cryostat (Leica) and thaw mounted on ethanol cleaned glass slides. For [3H]DAMGO, 50 mM Tris-HCl buffer containing 5 nM [3H]DAMGO (46 Ci mmol−1, NIDA Drug Supply) was pipetted onto slides and allowed to incubate for 10 min at room temperature. For nonspecific binding cold DAMGO (10 µM) was also added. The sections were then washed by 2× 30 s washes in Tris buffer. Finally, slides were dipped in ice-cold distilled water to remove salts. The slides were dried and then exposed to the phosphor screen for seven days and then imaged using a phosphor imager (Typhoon FLA 7000; GE Healthcare). The digitized images were calibrated using 14C standard slides (American Radiolabeled Chemicals). ROIs were hand-drawn based on anatomical landmarks and radioactivity was quantified using Multigauge v.3.0 software (Fujifilm) and expressed as per cent specific binding of saline-injected rats.
[18F]FNZ synthesis
Production of [18F]fluoride
18O-enriched water (98%, Huayi Isotopes, approximately 2 ml) was loaded into a niobium body, high-yield [18F]fluoride target of a General Electric Medical Systems (GEMS) PETtrace cyclotron. The target was irradiated with a proton beam of 60 μA for 15–30 min to produce and average of 68.9 GBq (1.86 Ci) (n = 6) of aqueous [18F]fluoride ion.
[18F]fluoroethyl tosylate synthesis
The radiosynthesis was performed using an in-house custom-made radiofluorination module (RFM) using LabView control software. Microwave heating was done using a CEM Corporation PETwave microwave (Matthews). The cyclotron produced [18F]fluoride ion was collected in a 5 ml V-vial (Wheaton) inside the hot cell and assayed in a dose calibrator to obtain the initial starting radioactivity. The [18F]fluoride ion was then remotely transferred to the RFM where it was trapped on a Chromafix 30-PS-HCO3 solid-phase extraction (SPE) cartridge (ABX) earlier preconditioned using 1 ml of high-purity water (Honeywell). The [18O]water was collected for recycling. The resin cartridge was eluted using 0.15 ml of a 1:1 acetonitrile:water mixture containing 18.1 µmol potassium carbonate and 31.9 µmol of Kryptofix K222 into an empty CEM 5 ml conical borosilicate glass reaction vessel. The resin cartridge was then rinsed with 0.250 ml of acetonitrile into the same reaction vessel and the [18F]fluoride was dried at 110 °C with nitrogen flow (325 ml min−1) for 150 s in a standard thermal heating block. Then two separate additions of 0.25 ml acetonitrile were added with 150 s and 180 s drying, respectively. After drying, the reaction vessel was remotely moved and placed into a CEM Discovery PETwave microwave cavity and cooled to 50 °C using compressed air. Ethylene ditosylate, 4 mg (10.5 µmol) in 0.5 ml acetonitrile, was added to the vessel and the solution microwaved using a dynamic method at 50 watts for a total of 5 min with a temperature limit set to 85 °C. The reaction vessel was cooled to 50 °C followed by the addition of 0.5 ml of acetonitrile and the solution was transferred to an intermediate vessel for assay and a sample was analysed by analytical HPLC. [18F]fluoroethyl tosylate yield based on gradient analytical HPLC analysis was 58% (n = 3).
[18F]FNZ
To a second CEM 5 ml conical borosilicate glass reaction vessel containing 4.5 mg (12 µmol) of etonitazene precursor, 5.5 mg (16.8 µmol) of cesium carbonate dissolved in 0.5 ml of DMF, 0.25 ml (~364 mCi) of the crude [18F]fluoroethyl tosylate solution was added. The vessel was microwaved using a dynamic method at 100 W for a total of 4 min with a temperature limit set to 120 °C. After cooling, the solution was diluted with 3 ml of water and purified by semi-preparative HPLC (Waters XBridge 10× 150 mm, 10 mm eluted with 18/82 acetonitrile/TEA Buffer pH 3.2 at 10 ml min−1, [18F]fluoro-etonitazene retention 15.2 min). The product fraction was collected in 50 ml water, and then eluted through a Waters tC18 Sep Pak plus. The Sep Pak was washed with 10 ml of water and then eluted with 1 ml of ethanol. An average of 98 mCi of [18F]fluoro-etonitazene was produced from the starting aliquot of crude [18F]fluoroethyl tosylate. The total synthesis time was 67 min with an overall non decay corrected radiochemical yield 5.4% from starting [18F]fluoride. The average specific activity was 831.1 GBq µmol−1 (22,461 mCi µmol−1) at end of synthesis with an average radiochemical purity was 99.4%.
Positron emission tomography
Male rats were anaesthetized with isoflurane and placed in a prone position on the scanner bed of a Mediso nanoScan PET/CT and injected intravenously with [18F]FNZ (~0.2 µg kg−1) and dynamic scanning commenced for 90 min. When indicated, animals were pretreated (~20 min before the injection of the PET radiotracer) with vehicle (n = 3 rats) or naltrexone (n = 3 rats) (10 mg kg−1, intraperitoneally). The PET data were reconstructed and corrected for dead-time and radioactive decay. All qualitative and quantitative assessments of PET images were performed using the PMOD software environment (PMOD Technologies). The dynamic PET images were coregistered to MRI templates and time–activity curves were generated using PMOD’s built-in atlases and the described analyses were performed. SUV was calculated as using the equation SUV = C/(dose/BW) where C is the tissue concentration of [18F]FNZ (kBq ml−1), dose is the administered dose (MBq) and BW (kg) is the animal’s body mass. Statistical analyses were performed using GraphPad Prism 10. Using the SUV, data were also expressed as region/cerebellum ratios.
[3H]FNZ and [3H]DFNZ brain uptake and distribution
Male rats were injected intravenously with [3H]FNZ (1 µg kg−1) with (n = 2) or without (n = 2) subcutaneous naloxone pretreatment 5 min before (10 mg kg−1) and euthanized 7 min following [3H]FNZ administration. For mouse uptake, [3H]DFNZ (100 µg kg−1) was injected subcutaneously 30 min prior to euthanasia in wild-type (n = 2 mice, 1 male and 1 female) or PGP/BCRP-knockout mice (n = 2 mice, 1 male and 1 female). The brains were flash frozen in 2-methylbutane and stored at −80 °C until use. The blood was centrifuged (13,000 rpm, 10 min at room temperature) and serum was collected. Serum samples were dissolved in scintillation cocktail (2.5 ml) and radioactivity counts were determined using a liquid scintillation counter. The brains were sectioned (20 μm) on a cryostat (Leica), mounted into glass microscope slides, and air-dried overnight at room temperature. The day after slides were placed into a Hypercassette and covered by a BAS-TR2025 phosphor screen (Cytiva). The slides were exposed to the phosphor screen for 15 days and imaged using a phosphor imager (Typhoon, Cytiva). The digitized images were calibrated using 14C standard slides (American Radiolabeled Chemicals). ROIs were hand-drawn based on anatomical landmarks and radioactivity was quantified using Multigauge v.3.0 software (Fujifilm).
Analgesia, catalepsy and hypothermia in rats
On the day of an experiment, male rats were brought into the laboratory in their home cages and allowed 1 h to acclimate. Groups of rats (n = 5 per dose group) received subcutaneous injections of vehicle (1 ml kg−1 saline), FNZ (1, 3, 10 or 30 µg kg−1), or DFNZ (0.1, 0.3, 1 or 3 mg kg−1) on the lower back between the hips and were returned to their home cages. Each rat was tested twice in separate experimental sessions, with at least three days of washout between experiments, and doses were randomly assigned. Pharmacodynamic endpoints including catalepsy score, body temperature, and hot plate latency, were determined prior to injection and at 15, 30, 60, 120 and 240 min post injection. At each time point, behaviour was observed for 1 min by an experienced rater, and catalepsy was scored based on three overt symptoms: immobility, flattened body posture, and splayed limbs. Each symptom was scored as either: 1, absent; or 2, present, and catalepsy scores at each time point were summed, yielding a minimum score of 3 and a maximum score of 6. Next, body temperature was measured using a hand-held reader sensitive to signals emitted by the surgically implanted transponder. We chose to examine hypothermia as a representative adverse effect of opioid treatment, since body temperature is a physiological measure that decreases in parallel with opioid-induced bradycardia and respiratory depression. Finally, rats were placed on a hot plate analgesia meter (IITC Life Sciences) set at 52 °C. Rats remained on the hot plate until they exhibited hind paw licking in response to the heat stimulus and were then returned to their home cages. Time spent on the hot plate was recorded using a timer triggered by a foot pedal. A 45 s cut-off was employed to prevent tissue damage. Pharmacodynamic findings were analysed using GraphPad Prism 10. Raw time-course data for hot plate latency and catalepsy score were normalized to percent maximum possible effect (%MPE), using the following equation: (experimental measure − baseline measure)/(maximum possible response − baseline measure) × 100. The maximum possible response for hot plate latency was 45 s, whereas the maximal response for catalepsy score was 6. Raw time-course data for body temperature were normalized to change from baseline, Δ temperature in °C, for each rat. Normalized time-course data were analysed by two-factor (dose × time) ANOVA followed by Tukey post hoc test to determine effects of drug doses at each time point. Mean hot plate latency and catalepsy score over the first 60 min were used to construct dose–response relationships, which were analysed by nonlinear regression (response stimulation, normalized response) to determine ED50 (potency) values.
Antinociceptive assays in mice
Hot plate
Oprm1-knockout mice were brought into the laboratory in their home cages and allowed 1 h to acclimate. Male and female mice received subcutaneous injections of vehicle (1 ml kg−1 saline), FNZ (0.1 mg kg−1), or DFNZ (3 mg kg−1) and were returned to their home cages. Each mouse was tested three times in separate experimental sessions, with at least 3 days of washout between experiments, and doses were randomly assigned. Hot plate latency was determined prior to injection and at 15, 30, 45 and 60 min post injection. Mice were placed on a hot plate analgesia meter (IITC Life Sciences) set at 54 °C. Mice remained on the hot plate until they exhibited hind paw licking, shaking or jumping in response to the heat stimulus and were then returned to their home cages. Time spent on the hot plate was recorded using a timer triggered by a foot pedal. A 20 s cut-off was employed to prevent tissue damage. Pharmacodynamic findings were analysed using GraphPad Prism 10. Raw time-course data for hot plate latency were normalized to percent maximum possible effect (%MPE), using the following equation: (experimental measure − baseline measure)/(maximum possible response − baseline measure) × 100. The maximum possible response for hot plate latency was 20 s.
Complete Freund’s adjuvant model
CFA (Sigma Aldrich) was diluted in a 1:1 ratio in saline and 30 µl were injected in the left hind paw of the mouse87.
von Frey assay
To monitor mechanical allodynia, we used von Frey filaments with ascending forces expressed in grams88 (Stoelting). Filaments were applied five times in a row against the mid-plantar area of the left hind paw, with all mice receiving a filament application before returning for the next application to the first mouse. Hind paw withdrawal or licking was marked as a positive allodynia response. The second force in which we observed a positive response in three out of five repetitive stimuli was defined as the allodynia threshold. Mechanical allodynia was measured 1 h after drug or saline administration.
Hargreaves assay for thermal hyperalgesia
Male mice were placed in Plexiglas boxes on top of a glass surface (IITC Life Sciences). The latency of withdrawal of the left injured paw was measured after a high intensity heat beam was applied to the mid-plantar area89 (IITC Life Sciences). Three measurements were obtained, and the average was defined as the thermal nociceptive threshold. We used intensity level of 40 and a cut-off time of 20 s. Hind paw withdrawal or licking was marked as a positive allodynia response. Hargreaves assay was performed 1 h after drug or saline administration.
AAV injection
Mice were anaesthetized with isoflurane (5% for induction and 1.5% for maintenance) for the duration of the injection and placed in a stereotaxic apparatus for head fixation. A small hole was drilled into the skull above the targeted coordinates for virus injection and fibre implant. After virus infusion, the syringe was left in place for 5 min and then slowly removed. Fibre optic studs (400 µm core diameter and 0.5 NA) (RWD Life Science) were placed in the NAc shell and fixed with dental cement (Dentalon, Kulzer). Three weeks after the surgery the fibre photometry experiments were performed.
Dopamine dynamics
Mice were injected unilaterally in the shell of the nucleus accumbens based on the Paxinos atlas stereotaxic coordinates (anterior–posterior (AP): 1.1, medial–lateral (ML): 0.7, from bregma dorsal–ventral (DV): −4.2 from dura mater) with 500 nl of dLight1.3b [ssAAV-1/2-hSyn1-chI-dLight1.3b-WPRE-bGHp(A)] at 7.6 × 10¹² vg ml−1 using a 2 µl Hamilton syringe (Hamilton Neuros) driven by a syringe pump (Stoelting) at a flow rate of 50 nl min−1.
Axon-GCaMP6s dynamics
TH-cre mice were unilaterally injected in the ventral tegmental area (coordinates: AP: −3.2 ML: −0.5 DV: −4.4) with 500 nl of AAV9-hSynapsin1-FLEx-axon-GCaMP6s at 5 × 10¹² vg ml−1 using a 2 µl Hamilton syringe. Optic fibre was implanted in the NAc (coordinates: AP: 1.3 ML: −0.9 DV: −4.5).
Fibre photometry
dLight 1.3b
After allowing three weeks for surgery recovery and biosensor expression, fibre photometry experiments were performed in awake male mice as previously described55. Extracellular dopamine was recorded using a Fiber Photometry Console (Doric) and Neuroscience Studio V6 (Doric) and signal was measured as changes in fluorescence emission after excitation with a light source at 470 nm. Isosbestic signal, excited with 405 nm, was recorded for artefact correction and signal decay. During dopamine recordings, animals explored a 20 × 15 cm cage, resembling their home cage, for 10 min followed by saline, FNZ (3 or 100 µg kg−1), DFNZ (0.3, 1 or 3 mg kg−1), morphine (40 mg kg−1) or fentanyl (0.3 mg kg−1) (all drugs were prepared in 0.9% NaCl at 10 ml kg−1 of body weight) subcutaneous administration after which animals were placed back in the cage and recorded for another 30 min. Mice received drugs in randomized order in a counterbalanced design. Animal behaviour was recorded using a webcam (Logitech) in synchrony with the photometry signal. Photometry data were analysed using custom MATLAB scripts. Data were downsampled (10×) and low pass (10 Hz) filtered. Using a polynomial fit, the isosbestic signal was rescaled to the peak-free biosensor signal obtained via symmetric least-squares filtering of the baseline period. Then, the biosensor signals were corrected using the formula dF/F = (F − F0/F0), where F is the fluorescence of the signal at a given time point and F0 is the corresponding rescaled isosbestic signal. To identify transients, a prominence over baseline threshold was set for every animal on a baseline recording and it remained constant across all experimental conditions for that animal. Then the signal was analysed to isolate and quantify the properties (amplitude, duration, frequency) of the spontaneous fluorescence transients. To measure slow changes in dopamine concentration, data were further low pass filtered using a Butterworth filter at 0.1 Hz and the traces from all animals were aligned and averaged and area under the curve was quantified in 5-min intervals. Following photometry experiments, animals were sacrificed, their brains dissected and imaged using a Zeiss Apotome 3 microscope to verify virus expression and correct fibre placement. Animals without virus expression or incorrect fibre location were excluded.
Axon-GCaMP6s
Signals were recording using a TDT RZ10 system (Tucker-Davis Technologies) controlled by Synapse Software v.95-44132P. Excitation was delivered at 465 nm and 405 nm isosbestic reference signal was recorded for artefact and decay correction. Male mice were allowed to freely explore a 45 × 45cm open field for 10 min (baseline). After this the mice received intraperitoneal injections of FNZ (0.03 or 0.1 mg kg−1), DFNZ (0.3, 1 or 3 mg kg−1), fentanyl (0.3 mg kg−1) or morphine (40 mg kg−1). All drugs were prepared in 0.9% NaCl and administered at 10 ml kg−1. Following injection, mice were returned to the chamber and recorded for 60 additional minutes. Photometry data were analysed using custom MATLAB scripts. dF/F was calculated by scaling the baseline of the 405 nm isosbestic signal to the baseline of the 465 nm calcium signal using a polynomial fit and then using the formula dF/F = (F − F0/F0), where F is the fluorescence signal and F0 is the fitted isosbestic reference. Calcium transients were identified using an event prominence threshold determined from baseline recordings for each animal and held constant across all drug conditions. Event amplitude, duration, and frequency were quantified. For slow signal changes, ΔF/F traces were aligned to the time of drug administration and the area under the curve was measured over 5 min time windows.
Microdialysis
Procedures were as described previously46,47. Prior to surgery, male rats were injected with meloxicam (1 mg kg−1, subcutaneously), then anaesthetized with a mixture of ketamine/xylazine (80 mg kg−1 intraperitoneally and 10 mg kg−1 intraperitoneally, respectively) and implanted unilaterally into the VTA (coordinates from bregma with a 10° angle in the coronal plane; anterior: –5.7 mm; lateral: −2.4 mm; vertical: –9 mm) with a regular microdialysis probe or with a specially designed microdialysis probe that allows the direct infusion of large peptides within the sampling area46,47. After surgery, the rats were allowed to recover in freely rotating hemispherical plastic bowls equipped with overhead fluid swivels. Twenty hours after probe implantation, experiments were performed on freely moving rats in the same hemispherical cages in which they recovered overnight from surgery. An artificial cerebrospinal fluid (ACSF) solution containing 144 mM NaCl, 4.8 mM KCl, 1.7 mM CaCl2, and 1.2 mM MgCl2 in ultrapure water was pumped through the probe at a constant rate of 1.25 μl min−1. After a washout period of 90 min, dialysate samples were collected at 20-min intervals. For peptide infusion, transmembrane peptides with the amino acid sequence of TM5 and TM7 of the MOR were dissolved in 0.1% DMSO in ACSF to a final concentration of 60 μM. Both peptides were injected with a 10-μl syringe (Hamilton) driven by an infusion pump and coupled with silica tubing (73-μm inner diameter; Polymicro Technologies) to the microdialysis probe/infusion cannula (dead volume, 40 nl), which was primed with ACSF and plugged during implantation. Each peptide was delivered at a rate of 15 nl min−1 starting 20 min before an intraperitoneal dose of DFNZ (1 mg kg−1). Two other groups received either FNZ (0.1 mg kg−1) or DFNZ (1 mg kg−1) without transmembrane peptide infusion. At the end of the experiment, rats were given an overdose of pentobarbital-based euthanasia solution, the brains were extracted and fixed in formaldehyde, and probe placement was histologically verified. Dopamine content was measured by HPLC coupled with a coulometric detector (5200a Coulochem III; ESA).
Self-administration
Surgery
Procedures were as described previously90. Male and female rats were anaesthetized with isoflurane. Catheters were made from Silastic tubing attached to a modified 22-gauge cannula (Plastics One, C313G-5up) and cemented to polypropylene mesh (Elko Filtering, 05–1000/45 or Industrial Netting, XN3019-47.5). The catheter was inserted into the jugular vein, and the mesh was fixed to the mid-scapular region of the rat. Rats were injected subcutaneously with ketoprofen (2.5 mg kg−1, subcutaneously, Covetrus) at the beginning of surgery or with carprofen (2.5 mg kg−1, Norbrook) after surgery and on the following day. Rats recovered for 6 days before training. Catheters were flushed daily with gentamicin (4.25 mg ml−1, Fresenius Kabi, 1002) dissolved in sterile saline. If we suspected catheter failure, we tested patency by intravenous infusion of a short-acting barbiturate anaesthetic Brevital (methohexital sodium, 10 mg ml−1 in buffered saline, 0.1–0.2 ml injection volume) or Diprivan (propofol, NIDA pharmacy, 10 mg ml−1, 0.1–0.2 ml injection volume, intravenously). Rats were not food- nor water-restricted throughout this experiment.
Apparatus
We used Med Associates chambers with MED-PC v.4.2 software with two levers located ~8 cm above the grid floor. Lever presses on the active, retractable lever activated the infusion pump, whereas lever presses on the inactive, retractable lever had no consequences. Each session began with the illumination of a house light that remained on for the entire session. The active and inactive levers were inserted into the chamber 10 s after the house light was illuminated. During the self-administration sessions, a fixed ratio 1 (FR1), FR3 or progressive ratio schedules were used. Each infusion was paired with a 20-s white-light cue. A 20-s timeout followed infusions before subsequent responses resulted in another infusion.
Effect of opioids on heroin and food
Rats were not food- nor water-restricted throughout these experiments. The first goal was to examine how different subcutaneous doses of FNZ (0–17 µg kg−1), DFNZ (0–1 mg kg−1) or fentanyl (0–0.1 mg kg−1) affect the intake of heroin in rats with chronic history of heroin IVSA. The second goal was to assess how FNZ, DFNZ and fentanyl at these same doses affect the self-administration of food pellets (TestDiet, 1811155, 12.7% fat, 66.7% carbohydrate, and 20.6% protein). Rats were implanted with jugular vein catheters as described previously90 and trained to self-administer heroin or food. Saline, FNZ, DFNZ or fentanyl were injected immediately prior to self-administration testing and behavioural responses were recorded for up to 180 min.
Opioid self-administration training
Male and female rats were trained to self-administer heroin (100 µg kg−1), FNZ (1 µg kg−1), or DFNZ (30 µg kg−1) intravenously for 3 h per day. Drug was infused over 3.5 s. Responses on the active lever during the timeout period and the inactive lever were recorded but had no consequences. Rats were considered trained if they pressed the active lever 80% of all presses with <20% variation in infusions per session over consecutive daily sessions.
Dose response
Rats were placed on a multiple-dose schedule (3 h per day for 6–9 days) with their FR3 or progressive ratio schedules. All parameters remained the same as FR3 training, except for drug dose. The number of infusions, and lever responses were recorded for each session.
Extinction and drug-induced reinstatement
Rats were retrained on heroin (100 µg kg−1 per infusion), FNZ (1 µg kg−1 per infusion) or DFNZ (30 µg kg−1 per infusion) at FR3 for one session, followed by 8 days of saline self-administration with all cues present. Rats were then injected intravenously with heroin (100 µg kg−1), FNZ (1 µg kg−1) or DFNZ (30 µg kg−1) immediately prior to a saline self-administration session.
Electrochemical oxygen measurements
Male rats were implanted with an oxygen sensor in NAc and equipped with an intravenous jugular vein catheter, allowing for direct assessment of opioid-induced brain hypoxia with high selectivity and temporal precision91,92. Using this procedure, we previously showed that intravenous fentanyl had over tenfold greater potency to promote brain hypoxia compared with intraperitoneal fentanyl30. Experiments began 4–5 days after the surgeries and continued over several daily sessions (3–5). FNZ (0.01, 0.03 mg kg−1) (n = 3 rats, 14 independent experiments), DFNZ (0.1, 0.3 mg kg−1) (n = 2 rats, 14 independent experiments) and fentanyl (0.03 mg kg−1) (n = 3 rats, 8 independent experiments) were delivered to rats via a slow, stress-free iv injection via the catheter extension. In a second cohort of rats, tariquidar (0.1, 1 mg kg−1) (n = 2 rats, 13 independent experiments) was injected 10 min prior to DFNZ (0.1 mg kg−1) (n = 2 rats, 7 independent experiments). In a third cohort, rats were injected subcutaneously with saline (n = 3 rats, 9 independent experiments) or 1 mg kg−1 DFNZ (n = 3 rats, 9 independent experiments). Data were calculated as changes in oxygen levels relative to pre-injection baseline (100%).
Tolerance and mechanical hypersensitivity using von Frey assay
The purpose of this experiment was to assess the degree to which FNZ, DFNZ and fentanyl produce changes in mechanical sensitivity characteristic of tolerance and allodynia or hyperalgesia. Procedures were adopted from a prior study and were as previously described33 with modifications. Naive male and female rats were handled and habituated to chambers for 15–30 min per day and received saline subcutaneous injections in the week prior to testing. Rats received daily subcutaneous escalating drug doses for 4 weeks (5 days per week). Rats were tested each week after drug administration (saline, FNZ (0.003–0.03 mg kg−1), DFNZ (0.1–1 mg kg−1) or fentanyl (0.01–0.03 mg kg−1)). von Frey responses were tested 30 min post injection (tolerance) and then again 4–6 h post injection (mechanical hypersensitivity). For both, responses were measured 6 times per time point, alternating between hind paws with at least 5 min intervals between acquisitions. Rats were habituated to the testing room for at least 30 min and acclimatized to the testing apparatus for at least 15 min before testing.
Naloxone-precipitated withdrawal
Induction of opioid dependency
Procedures were adapted from previous studies32,93,94. Morphine was administered subcutaneously to male and female rats once daily at 10:00 for 7 days via an escalating dose schedule: 20 mg kg−1 (day 1), 40 mg kg−1 (day 2/3), 60 mg kg−1 (day 4/5) and 80 mg kg−1 (days 6/7). Owing to their faster pharmacokinetics, FNZ (30 µg kg−1) and DFNZ (1 mg kg−1) were administered subcutaneously to male and female rats at 10:00 and 16:00 for 7 days.
Naloxone-precipitated withdrawal
On day 8, rats received the morning opioid administration. Four hours later they were injected intraperitoneally with 1 mg kg−1 naloxone and placed into a 40 × 40 × 30 cm plexiglass box to record somatic signs of withdrawal syndrome for 10 min. Rats were weighed twice: immediately prior to naloxone injection and 1 h later. Videos were scored by two blind experimenters as described previously33,95,96. Graded signs included jump attempts (1 point for 1–4 attempts, 2 points for 5–9 attempts, 3 points for >10 attempts), paw tremor (2 points for 1–2, 4 points for >3), wet dog shakes (1 point for 1–2, 2 points for >3) and fecal deposits (1 point per deposit). Checked signs included abdominal spasms (2 points), abnormal posture (3 points), diarrhea (2 points), irritability/vocalization (3 points), genital grooming (3 points), profuse salivation (7 points), ptosis (2 points), swallowing movements (2 points) and teeth chattering (2 points). Weight loss following naloxone administration was also considered with 1 point per gram lost. These scores were averaged across the two experimenters and summed to produce an overall withdrawal score.
NanoBiT assays
Human MOR and Gαo cDNA were cloned in the pIREShyg3 plasmid vector within the Afe I and Xba I restriction enzyme sites (Clontech Laboratories) containing the sequences for the small subunit (SmBiT) and long subunit (LgBiT) of nanoluciferase97 respectively (pIRES-HA-PS-MORSmBiT, pIRES-HA- GαoLgBiT). MOR included the mGlu5 receptor signal peptide in 5′ of the multiple cloning site to allow for plasma membrane trafficking. All constructs were haemagglutinin tagged for detection and verified by DNA sequencing.
HEK293T cells (sourced from ATCC, tested for mycoplasma contamination) (CRL-321, RRID: CVCL_0063) and grown in Dulbecco’s modified Eagle medium (DMEM) supplemented with 10% (v/v) fetal bovine serum, 100 U ml−1 penicillin, 100 μg ml−1 streptomycin, and 2 mM L-glutamine. Cells were cultured in CytoOne (USA Scientific) treated culture plates in a Forma Series II Water Jacket incubator (Thermo Fisher Scientific) at 37 °C, 5% CO2, 90% humidity. For Gαo engagement assays, HEK293T cells were plated in a 24-well plate and transiently transfected with 0.25 µg pIRES-HA-PS-MORSmBiT and pIRES-HA- GαoLgBiT together with 1.0 µg pIRES-HA-PS-hGalR or pcDNA3.1 using PEI transfection reagent98. Cell medium was replaced with fresh DMEM after 4 h and incubated overnight. The next day, cells were trypsinized, replated to 96-well poly-D-lysine precoated plates, and allowed to incubate overnight. The following day, medium was replaced with 0.1% glucose/2 mM NaHSO3/PBS with various concentrations of FNZ, DFNZ or (S)-methadone and incubated for 15 min at 37 °C. Coelenterazine H (MedLumine) was subsequently added in a final concentration of 5 μM and plates were incubated at 37 °C for 5 min. Luminescence was measured at 485 nm in a Mithras LB 940 plate reader (Berthold Technologies). Results are expressed as percentage of the maximal recorded luminescence of cells transfected with MOR alone (RLU % ctrl).
Statistics
All data were analysed using GraphPad Prism 10, unless otherwise noted, using one-way, two-way, mixed-effects or non-parametric ANOVA, two-sided independent t-tests, two-sided paired-sample t-tests, taking repeated measures into account where appropriate. Post hoc tests were performed two-tailed and using the appropriate multiple comparison correction.
Reporting summary
Further information on research design is available in the Nature Portfolio Reporting Summary linked to this article.
First Appeared on
Source link

