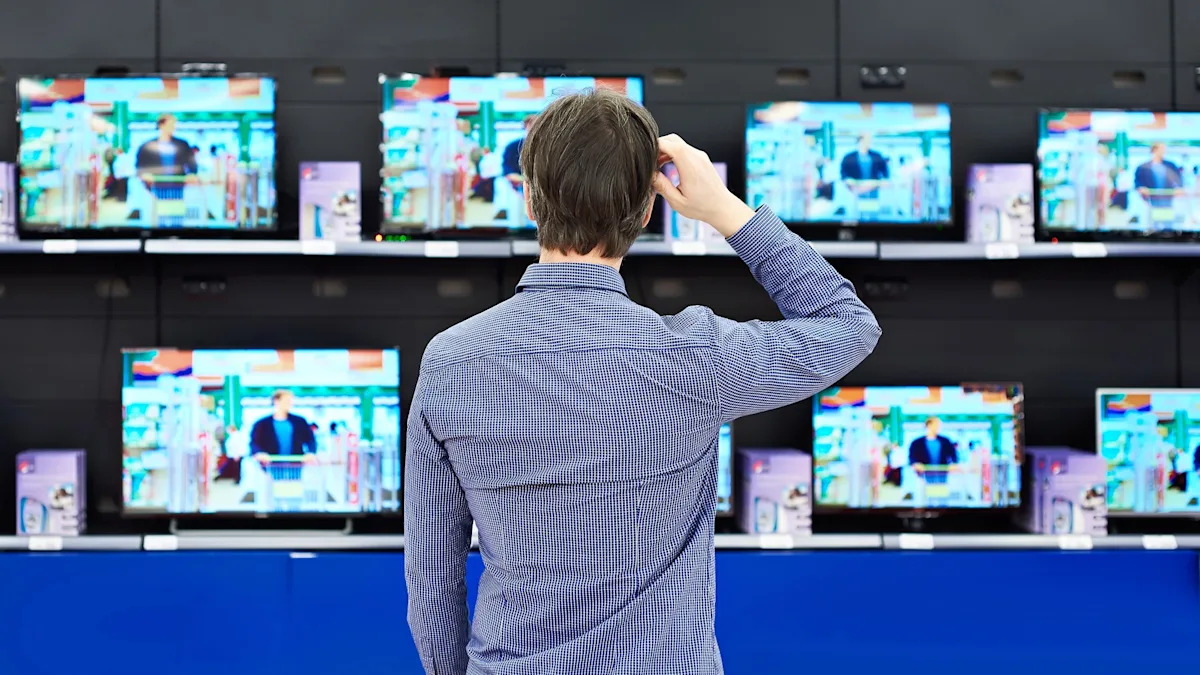
Your eyes can only handle so much HDTV
Every year, tech and television companies boast their products’ latest and greatest, highest-resolution displays. The 4K display—a screen with a horizontal display of approximately 4,000 pixels—first became widely available around 2014. Barely a decade later, you can purchase a TV with double the resolution.
But at what point do all those pixels become pointless? The question is not only a matter of wasted cash. The resources and energy required to manufacture and power these TVs, tablets, computers, and smartphones are an ever-increasing ecological concern. To determine if there is a resolution tipping point, researchers at the University of Cambridge and Meta Reality Labs developed a new methodology to assess the capabilities of the human eye. The result published in Nature Communications is an updated spin on one of optometry’s most recognizable tests.
Refocusing the Snellen chart
Reading from a chart of letters to test vision is arguably the most familiar portion of any visit to the eye doctor. There’s even a name for that page of increasingly smaller letters. It’s called a Snellen chart, and it’s actually over 160 years old. But while the general test has remained largely unaltered since its namesake Dutch ophthalmologist debuted it in 1862, our usual visual subjects have not. Today, people are much more likely to stare at smartphones, tablets, and computer screens instead of papers or field plows.
“This measurement has been widely accepted, but no one had actually sat down and measured it for modern displays, rather than a wall chart of letters that was first developed in the 19th century,” study co-author University of Cambridge computer scientist Maliha Ashraf said in a statement.
Ashraf and colleagues swapped out the traditional Snellen chart for their own experimental arrangement. First, they constructed a sliding display that let them precisely measure what a human eye sees as it focuses on a screen’s patterns. Rather than focus on a screen’s pixel specifications, they opted for pixels per degree. Also known as PPD, this measurement gauges how many individual pixels can cram into a single-degree of your field of vision. Instead of simply establishing an entire screen’s cumulative pixel count, PPD allows researchers to more accurately learn how a screen may look to an individual from their particular vantage point.
Next, they asked study volunteers to stare at the display screen with various patterns, both in shades of gray and in color. They were then asked to flag any time they discerned an image’s individual lines as the screen moved closer and farther away, as well as to either side for peripheral vision testing. Based on a Snellen chart’s standard 20/20 vision template, the human eye should identify detail at 60 pixels per degree. In actuality, our vision often outperforms those expectations—with some caveats.
A gray area
The team discovered that our eyes (sometimes) have a higher resolution limit than the Snellen chart would have us believe. Grayscale images seen straight ahead can be seen with an average of 94 PPD, while red and green hues allow for 89 PPD. Only along the visible yellow and violet color spectrums did humans see less than the Snellen chart might suggest, with an average of 53 PPD. The reason why we see better in grayscale is because the human mind simply isn’t optimized for color.
“Our brain doesn’t actually have the capacity to sense details in color very well, which is why we saw a big drop-off for colour images, especially when viewed in peripheral vision,” explained University of Cambridge computer scientist and study co-author Rafał Mantiuk. “Our eyes are essentially sensors that aren’t all that great, but our brain processes that data into what it thinks we should be seeing.”
A more accurate understanding of our visual limitations is crucial for both today’s technology, as well as the next generation of augmented and virtual reality products. With this new methodology, companies can better calculate resolution maximums and averages that might benefit the most users possible.
The ramifications go beyond research labs and manufacturing plants. The team also designed a free online calculator that can help the everyday shopper’s hunt for an ideal screen based on variables like device size, viewing distance, pixel density, and field of view. There may be a limit to visible pixel resolution, but you’ll at least be able to spot the next time someone’s trying to upsell you on a TV.
First Appeared on
Source link


