
New York City Mayor and New Jersey Governor 2025
New Jersey Voters Give Sherrill Slight Edge; Mamdani Holds 25-Point Lead over Cuomo in NYC
The final Emerson College Polling/PIX11/The Hill surveys of the New Jersey election for Governor and the New York City election for Mayor find a close race between Democrat Mikie Sherrill and Republican Jack Ciattarelli in New Jersey, and Zohran Mamdani with a significant lead outside the survey’s margin of error in New York City.
NEW JERSEY 2025
The poll of New Jersey likely voters finds 49% support Democrat Mikie Sherrill and 48% support Republican Jack Ciattarelli for Governor; 2% are undecided. With these undecided voters’ support accounted for, support for Sherrill increases to 50% while Ciattarelli stays at 48%.
“Heading into Election Day, the gender divide in the gubernatorial election has solidified: men break for Ciattarelli by 16 points, while women break for Sherrill by 18 points,” Spencer Kimball, executive director of Emerson College Polling, said. “Since last month, Ciattarelli’s lead among men increased by four points, and Sherill’s lead among women grew by eight points.”
Both candidates for Governor have split favorable ratings among likely voters: 47% have a favorable view of Sherrill, while 47% have an unfavorable view of her. Forty-eight percent have a favorable view of Ciattarelli, while 48% have an unfavorable view of him.
Governor Phil Murphy’s approval continues to be underwater: 34% approve of the job he is doing as Governor while 50% disapprove; 16% are neutral. President Donald Trump holds a 45% approval rating, while 53% disapprove of the job he is doing as President.
Among those who approve of Murphy, 97% are voting for Sherrill. Of those who disapprove, 91% plan to support Ciattarelli. Those who are neutral break for Sherrill, 79% to 12%.
A majority of voters (52%) say the economy is the top issue facing the state, while 14% say threats to democracy, 11% housing affordability, 5% immigration policy, and 5% healthcare.
NEW YORK CITY 2025
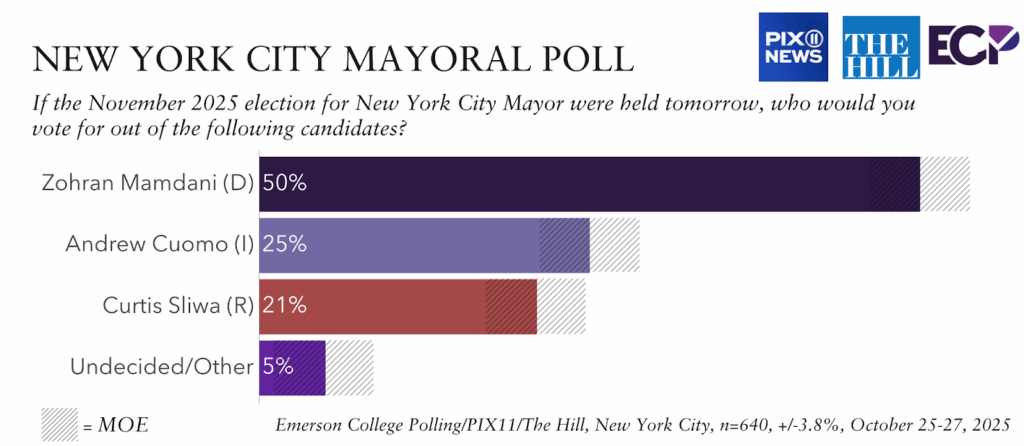
The final Emerson College Polling/PIX11/The Hill survey of the New York City mayoral election finds Zohran Mamdani with a 25-point lead over Andrew Cuomo, 50% to 25%, while 21% support Curtis Sliwa, and 4% are undecided. Since last month, Mamdani’s support increased seven percentage points, from 43% to 50%, Cuomo lost three points, 28% to 25%, and Sliwa gained eleven points, from 10% to 21%.
“Mamdani appears to have built a coalition across key demographics, increasing his margin among Black voters since last month, from 50% to 71%, whereas Cuomo dropped ten points among Black voters since September,” Kimball noted. “Mamdani continues to have a base of young voters; 69% of voters under 50 support him, whereas 37% of voters over 50 support Mamdani, while 31% support Cuomo and 28% Silwa.”
Those who have already voted support Mamdani by a wider 33-point margin, 58% to 25%, while those who have yet to vote break for Mamdani by 19, 45% to 26%.
Zohran Mamdani has a 52% favorable rating among New York City likely voters, 35% have a favorable view of Andrew Cuomo, and 27% Curtis Sliwa. Forty-one percent have an unfavorable view of Mamdani, 58% have an unfavorable view of Cuomo, and 55% have an unfavorable view of Sliwa.
Regarding the top issue for voters facing the United States, 30% find threats to democracy to be most important, 25% the economy, and 14% housing affordability.
NYC Methodology
The Emerson College Polling New York City survey was conducted October 25-27 2025. The overall sample of NYC very likely voters/those who have already voted, n=640, has a credibility interval, similar to a poll’s margin of error (MOE), of +/- 3.8 percentage points. The data sets were weighted by gender, education, race, age, party registration, previous vote history, and region based on U.S. Census parameters and voter file data.
It is important to remember that subsets based on demographics, such as gender, age, education, and race/ethnicity, carry with them higher credibility intervals, as the sample size is reduced. Survey results should be understood within the poll’s range of scores, and with a confidence interval of 95% a poll will fall outside the range of scores 1 in 20 times.
Data was collected by contacting a voter list of cellphones via MMS-to-web text (list provided by Aristotle), and a probability panel of voters provided by Consensus Strategies, with additional panel responses provided by CINT. Panel responses were matched to the Aristotle voter file using respondents’ full name and ZIP code. The survey was offered in English.
All questions asked in this survey with the exact wording, along with full results, demographics, and cross tabulations can be found under Full Results. This survey was funded by Emerson College / Nexstar Media.
NJ Methodology
The Emerson College Polling New Jersey survey was conducted October 25-28, 2025. The overall sample of New Jersey very likely voters/those who have already voted, n=1,000, has a credibility interval, similar to a poll’s margin of error (MOE), of +/- 3 percentage points. The data sets were weighted by gender, education, race, age, party registration, previous vote history, and region based on U.S. Census parameters and voter file data.
It is important to remember that subsets based on demographics, such as gender, age, education, and race/ethnicity, carry with them higher credibility intervals, as the sample size is reduced. Survey results should be understood within the poll’s range of scores, and with a confidence interval of 95% a poll will fall outside the range of scores 1 in 20 times.
Data was collected by contacting a voter list of cellphones via MMS-to-web text (list provided by Aristotle), landlines via interactive voice response (lists provided by Aristotle), and a probability panel of voters provided by Consensus Strategies. The survey was offered in English.
All questions asked in this survey with the exact wording, along with full results, demographics, and cross tabulations can be found under Full Results. This survey was funded by Emerson College / Nexstar Media.
First Appeared on
Source link

