A wearable-based aging clock associates with disease and behavior
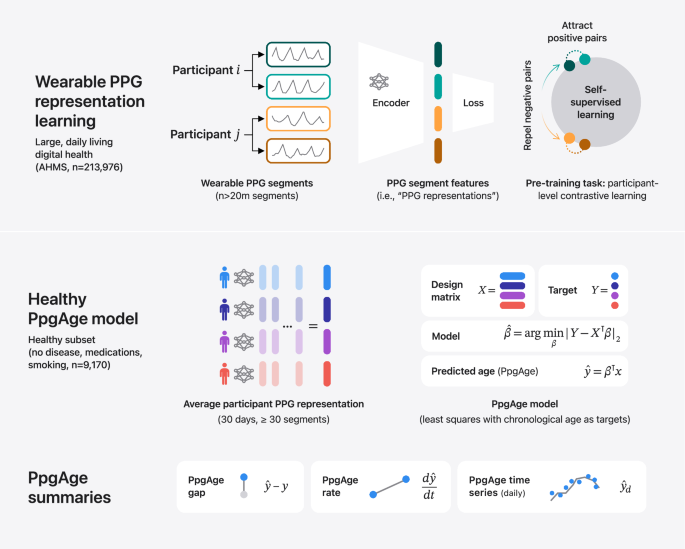
PpgAge is developed using Apple Watch PPG data collected under informed consent from participants in the AHMS41. First, we train a general-purpose deep neural network from about 20 million 60-s PPG segments via self-supervised learning (SSL), with the objective of distinguishing participants from each other, summarizing each segment with a 256-dimensional feature vector, i.e., a PPG representation42. To build a normative model of healthy aging, we select self-reported healthy participants with sufficient PPG data (n = 6728) and fit a model to predict chronological age (self-reported and approximate, see “Methods”) from the average PPG representation (i.e., 256-dimension vector) within the first 30 days of study, and separately, the last 30 days (minimum 30 segments per period, see Fig. 1 and “Methods”) using a randomly selected set of 80% (n = 5355) participants. We refer to predictions from this model as PpgAge, and the difference between PpgAge and chronological age as the PpgAge gap—higher PpgAge age gap values indicate older looking, while negative PpgAge age gap indicates younger looking. We study PpgAge estimates on the remaining healthy test cohort (n = 1373) and the general cohort (n = 120,235). We analyze the accuracy of PpgAge predictions, its cross-sectional associations with disease and behavior, and its longitudinal sensitivity to physiological changes, such as pregnancy and cardiac events (Fig. 1 and “Results” below). Figure 2a–c detail summaries of the study population and the self-reported healthy cohort, including behavioral and medical history characteristics at baseline.
Methods summary. (i) Following Abbaspourazad et al.42, we use a contrastive loss to learn PPG segment representations, a 256-dimensional vector summarizing features of a 60-s PPG segment, on a subset of 172,318 participants. (ii) PPG representations from a self-reported healthy subpopulation are used to fit a linear regression model, targeting chronological age. For a new subject, predicted age (PpgAge) is computed, and we examine the gap between PpgAge and chronological age and longitudinal changes in PpgAge time series that may co-occur with physiological changes. (iii) We analyze held out “healthy” and “general” participants, assessing accuracy of PpgAge, cross-sectional associations with disease and behavior, and longitudinal analyses of participant-level PpgAge time series.
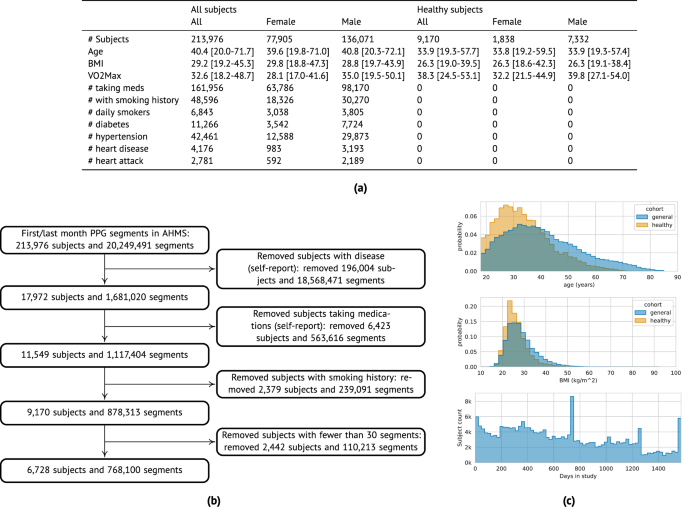
a Summary statistics of all AHMS participants with at least one background PPG segment (“All subjects”) and the subset of participants that self report no history of disease, no medications, and no history of smoking behavior (“Healthy subjects”); see Section S1 in the Supplement for precise characterizations of these criteria. Bracketed values report interquartile range. b Inclusion/exclusion of subjects that comprise the “healthy” cohort used to train and validate age models. c Chronological age (top) and BMI (middle) distributions comparing the general and healthy cohorts, and study duration distribution (bottom) for all participants.
Wearable PPG robustly predicts chronological age via PpgAge
PpgAge predicts chronological age with high accuracy in both the “healthy” and “general” group. Prediction accuracy is highest in the healthy cohort, with mean absolute error (MAE) of 2.45 years (95% CI 2.22–2.71) in female participants (n = 258) and 2.42 years (95% CI 2.30–2.54) in male participants (n = 1115). In the general cohort (i.e., a distribution distinct from the training data), PpgAge predicts chronological age with MAE of 3.26 years (95% CI 3.24–3.29) among female participants (n = 42,734) and 3.13 years (95% CI 3.11–3.15) among male participants (n = 77,501). Age prediction accuracy is based on the first 30 days of PPG segments, limited to held out subjects with at least 30 PPG segments present (n = 120,235), predicting average participant age within that 30-day window. Figure 3a–d graphically summarize model predictions and error metrics.
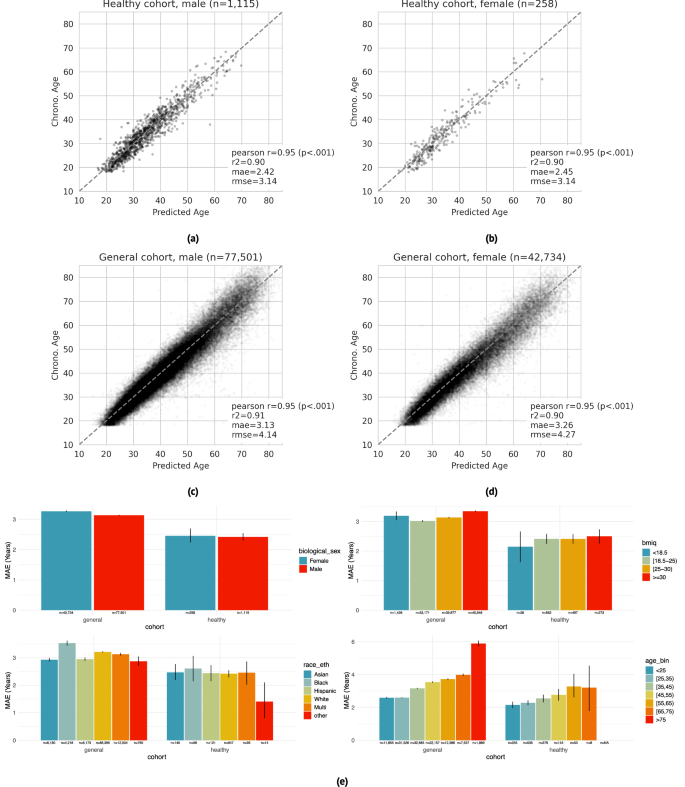
a–d Wearable PPG segments (minimum 30 segments over a 30-day span) predict chronological age with a mean absolute error of 2.42 years (95% CI 2.30–2.54) and 2.45 years (95% CI 2.22–2.71) in healthy male and female test participants, respectively (dashed line is the identity). In the general population, prediction errors are 3.13 years (95% CI 3.11–3.15) and 3.26 years (95% CI 3.24–3.29) for male and female participants, respectively. Analysis was restricted to participants with chronological age between 18 and 85, as participants older than 75 are rare in the healthy training cohort. e Within the healthy cohort, predictions error remains relatively stable across demographic categories —biological sex (first panel), BMI (second panel), and self reported race/ethnicity (third panel). Younger participants enjoy a modestly lower error than older participants (fourth panel), which may be partially explained by a lower expectation of misdiagnosis and therefore more accurate “healthy” labels. Within the general cohort, prediction error is systematically higher and more variable, as expected as non-healthy participants were not used for training. Error bars are 95% confidence intervals computed from 1000 bootstrap replicates.
Chronological age prediction error varies little by demographic sub-population. In addition to parity between self-reported biological male and female participants, in the healthy cohort, we observe similar prediction accuracy among self-reported race/ethnicity groups (MAE 1.4–2.6 years), and self-reported BMI groups (MAE 2.1–2.5 years). We also observe a modest increase in error by chronological age—healthy participants with chronological age less than 25 years are predicted with an MAE of 2.15 years (95% CI 1.95–2.34), while participants with chronological age between 65 and 75 years are predicted with an MAE of 3.21 years (95% CI 1.73–4.56). Prediction error in the general cohort is higher and more variable across all demographic groups. Figure 3e summarizes chronological age estimator error in demographic subpopulations. PpgAge residuals appear to be close to normal in the healthy test cohort with non-normality driven by a small number of outliers, and farther from normal in the general cohort, see Fig. S1.
PpgAge gap associates with disease
We investigate the hypothesis that an elevated predicted age relative to chronological age—i.e., the age gap—is associated with disease, and, inversely, a reduced (or negative) age gap is associated with better health. Using medical history surveys from participants at enrollment, we study age- and sex-matched diagnosis rates of a variety of conditions, stratified by PpgAge gap measured within the first 30 days of enrollment. We bin subjects by PpgAge gap (adjusted, see “Methods”) within discrete categories: <−2, (−2, 0], (0, 2], (2,4], (4,6], and >6 years.
We observe a strong association between PpgAge gap and a variety of conditions, controlling for sex and chronological age (Fig. 4). Those with a higher (i.e., older looking) age gap tend to have higher diagnosis rates than average; those with lower (i.e., younger looking) age gap tend to have lower diagnosis rates. For example, the rate of diabetes diagnosis among 35–45 year old women is 6.3% (95% CI 5.7–6.8). However, for 35–45 year old women with a >6 year PpgAge gap, that rate jumps to 14.9% (95% CI 12.8–16.9), or 2.38 times the average rate (95% CI 2.10–2.70)—we refer to this ratio as the “relative rate of diagnosis” (see “Methods” for further details). For participants with a <−2 year gap, that rate drops 3.7% (95% CI 2.9–4.5), or a 0.59 relative rate of diagnosis (95% CI 0.47–0.71, Fig. 4b).
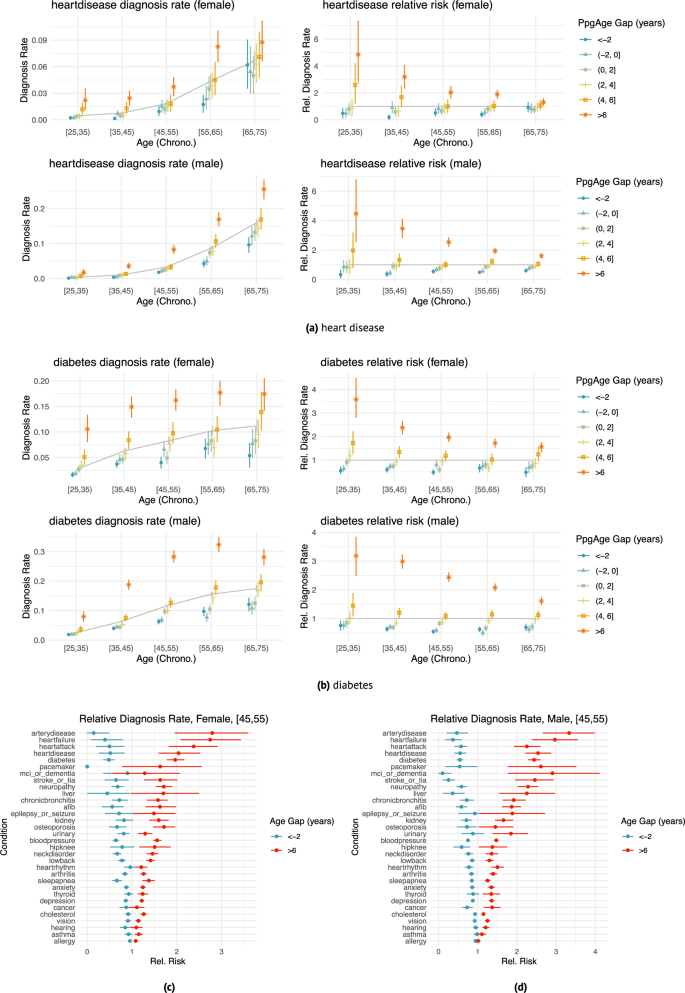
a, b Age- and sex-matched diagnosis rates (left) and risk relative to average (right) stratified by different age gap buckets for heart disease (n = 37,201 female and n = 63,345 male participants) and diabetes (n = 37,366 female and n = 63,571 male participants). Grey line indicates average diagnosis rate (by age and sex); all intervals are 95% confidence intervals computed with 1000 bootstrap samples. The effect size (relative to age- and sex-matched average) varies with age—e.g., heart disease diagnosis is less strongly associated with age gap in the [65, 75) year old group than the [35, 45) age group. Details for additional diseases are included in Supplemental Figs. S2 and S3. Heart disease diagnosis rates. c, d Age gap risk relative to average for all surveyed diseases; left: female participants aged 45–55 (n = 6,364), right: male participants aged 45–55 (n = 12,787), comparing oldest age gap bucket (>6) and youngest age gap bucket (<−2). Cardiometabolic diseases (e.g., heart failure, peripheral artery disease, diabetes) appear to have larger associations with age gap than other conditions (e.g., asthma, cancer, allergy). Intervals are 95% confidence intervals computed with 1,000 bootstrap replicates. See Fig. S13 for additional results.
As another example, among 35–45 year old male participants, a heart disease diagnosis is rare, reported at a rate of 1.0% (95% CI 0.9–1.2). However, among 35–45 year old male participants with >6 year PpgAge gap, the rate of heart disease diagnosis is 3.6% (95% CI 2.7–4.5), or 3.46 × the average (95% CI 2.80–4.10); and for those with <−2 year PpgAge gap, that rate drops to 0.4% (95% CI 0.2–0.6) or a 0.37 times the average rate (95% CI 0.19–0.56). Among 45–55 year old men, the relative rate of heart disease diagnosis for participants with >6 year PpgAge gap is 2.54 × (95% CI 2.22–2.87); for 45–55 year old men with a <−2 year gap, the relative rate is 0.55 × (95% CI 0.41–0.71, Fig. 4a).
This association is also strong for heart failure and peripheral artery disease (Fig. 4c)—in 45–55 year old men, those with a >6 year PpgAge gap have a 2.97 × (95% CI 2.39–3.56) relative rate of heart failure diagnosis; for 45–55 year old women the rate is 2.75 × (95% CI 2.08–3.43).
The association between PpgAge gap and diagnosis rates is not strong with all conditions. Allergy, asthma, vision loss, hearing loss, and cancer diagnosis rates remain similar in the youngest and oldest PpgAge groups. See Fig. 4 for a more detailed summary (and Figs. S2 and S3 for additional results).
PpgAge gap predicts incident cardiometabolic disease
To better understand the utility of PpgAge age gap as a predictor, we conduct a survival analysis, predicting incident (i) atherosclerotic cardiovascular disease (ASCVD) events (new diagnosis of coronary artery disease, heart failure, or peripheral artery disease; or heart attack, stroke, angioplasty, stent, or coronary bypass; n = 1328 events), (ii) hypertension (n = 1449 events), (iii) hyperlipidemia (n = 1666 events), (iv) diabetes diagnosis (n = 1049 events); all while controlling for relevant risk factors.
For ASCVD events, we use the continuous-valued adjusted PpgAge gap, and control for biological sex, age, BMI, \({{{{\rm{VO}}}}}_{2}\,\max\), smoking status, and previous diagnoses of hypertension, high cholesterol, and diabetes. We find that a PpgAge gap of six years is associated with a significant risk increase, with a hazard ratio of 1.464 (1.36–1.57 95% CI). For context, a previous diagnosis of hypertension is associated with a hazard ratio of 1.277 (1.13–1.44 95% CI), and high cholesterol is associated with a hazard ratio of 1.226 (1.09–1.38 95% CI). Fitted survival curves from the Cox model for different ages and PpgAge gaps overlap, as well—the survival for a chronological 55 year old with a PpgAge gap of +6 is lower than for a chronological 65 year old with a PpgAge gap of −6.
We see a similarly strong association between a PpgAge gap of six years and risk for developing new hypertension, with a hazard ratio of 1.620 (1.51–1.74 95% CI). See Fig. 5 for full results on these conditions. For all conditions, we observe that an increase in PpgAge gap is a strong and statistically significant risk factor for onset of new disease, with the effect size for a gap of +6 being comparable to or occasionally greater than for other common risk factors like hypertension, smoking, or high cholesterol. In the general cohort, we note that PpgAge gap greater than 6 years constitutes 11.6% of participants (14,027 of 120,235), roughly the top decile. For comparison, the prevalence of hypertension, high cholesterol, diabetes, and heart disease diagnoses are 23%, 25%, 6.1%, and 2.3%, respectively.
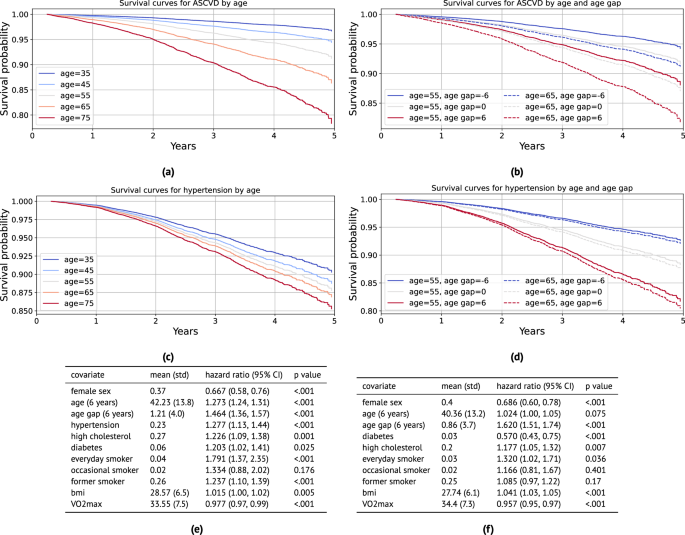
a Fitted survival curves from the Cox model for incident atherosclerotic cardiovascular disease (ASCVD) for different ages. Average values for other covariates (except PpgAge gap) are used within each stratum (defined as ± 5 years). b Fitted survival curves from the Cox model for ASCVD stratified for 55 and 65 year old subjects, and further fixing PpgAge gap values, with other covariates set to average values within age strata. There is substantial overlap—55 year old subjects with high PpgAge gaps have lower survival to 65 year old subjects with low PpgAge gaps. c Fitted survival curves from the Cox model for incident hypertension diagnosis for different ages. Average values for other covariates (except PpgAge gap) are used within each age stratum (defined as ± 5 years). d Fitted survival curves from the Cox model for incident hypertension for 55 and 65 year old subjects, and further fixing PpgAge gap values, with other covariates set to average values within age strata. PpgAge is a much stronger predictor than chronological age, which has minimal effect. e Hazard ratios for the incident ASCVD Cox model, adjusting for common risk factors (C-index: 0.758, N: 89,553, number of events: 1328). f Hazard ratios for the incident hypertension Cox model, adjusting for common risk factors (C-index: 0.704, N: 70,636, number of events: 1449). P-values reflect a two-sided Wald test, unadjusted for multiple comparisons. See Supplemental Fig. S4 for additional results on incident diabetes and hyperlipidemia, Fig. S5 for young vs old subgroup analyses, and Fig. S6 for Kaplan–Meier curves with confidence intervals stratified by PpgAge gap. As we are not modeling repeated or competing events, cumulative incidence is equivalent to the inverse of the survival probability, CIF(t) = 1 – S(t).
In Fig. S5 in the supplement, we detail a sensitivity analysis that yields similarly strong associations between PpgAge gap and incident disease when we fit models within older and younger subgroups. In Fig. S6, we also show Kaplan–Meier curves for each of the outcomes stratified by PpgAge gap, where we observe statistically significant increases in risk for all conditions for subjects with the highest PpgAge gap.
PpgAge predictions associate with smoking behavior
Participants in AHMS are surveyed about behaviors related to health, including smoking status. Individuals are asked, “Have you smoked at least 100 cigarettes in your entire life?”, and if the response is “yes” or “do not know,” participants are asked, “Do you now smoke cigarettes every day, some days, or not at all?” We categorize individuals into never smokers (n = 58,025), former smokers (n = 25,644), occasional smokers (n = 2453), or daily smokers (n = 4190) based on available survey responses, and study the age gap of each group (see “Methods”).
More frequent smoking is consistent with a higher PpgAge gap. Across all age groups, and for both male and female participants, daily smoking is associated with the highest age gap, followed by occasional smokers, former smokers, and then never smokers. Additionally, the age gap difference across smoking categories grows from the youngest to oldest chronological age categories. Among males younger than 25 years, the predicted age gap for daily smokers, 0.55 years (95% CI −0.06–1.343), is similar to the predicted age gap for never smokers, 0.076 (95% CI −0.01–1.7). However, older populations deviate markedly—among 25–35 year old males, the predicted age gap for daily smokers is 1.36 years higher than for never smokers (1.79 vs 0.43); that difference increases to 2.3 years in the 35–45 group (3.2 vs 0.89), and 3.53 years in the 55–65 group (5.27 vs 1.74). See Fig. 6A, B for additional details.
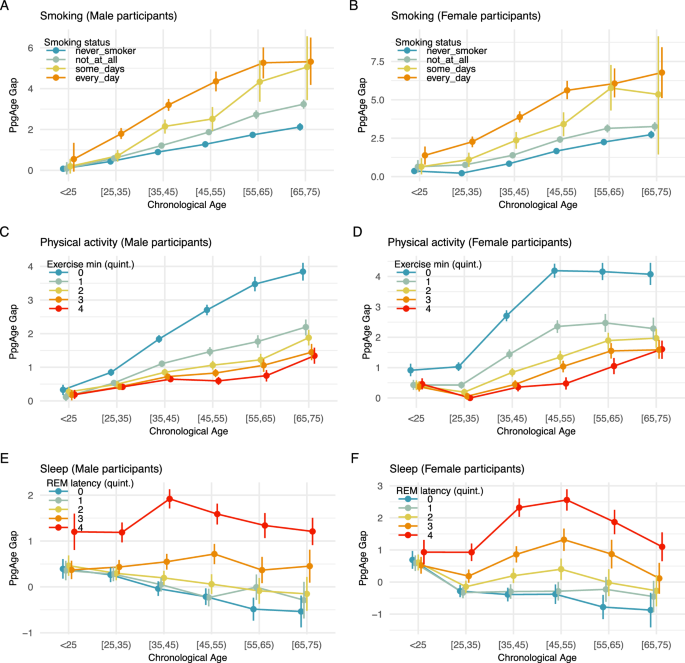
PpgAge gap (adjusted) stratified by self-reported smoking status and chronological age for A male and B female participants. Results in both subpopulations are consistent with a dose-response effect—never smokers (n = 58,025) appear younger than former smokers (n = 25,644), who appear younger than occasional smokers (n = 2453), who appear younger than daily smokers (n = 4190). In both populations, results are also consistent with an exposure effect—i.e., the gap between daily smokers and never smokers is small in the youngest population, but grows to be about 3–4 years in the [55,65) year old groups. PpgAge gap stratified by C male (n = 98,986) and D female (n = 54,256) participants, stratified by exercise minutes. Among men, the age gap is largest for the lowest exercise minutes quintile, i.e., the least active individuals, and the difference between the lowest and the remaining quintiles grows with age, consistent with an exposure effect. The ranking of the average age gap is consistent with increasing amounts of exercise minutes. Among women, a similar effect can be observed, although the uncertainty is slightly larger due to a smaller sample size. (See quintile cutoffs in Table S1.) E, F PpgAge gap by REM latency quintile for male (n = 56,802) and female (n = 32,769) participants, respectively. An increased REM latency is associated with an elevated PpgAge gap across all age categories. See Fig. S10 for analysis of total sleep duration, deep sleep duration, and sleep efficiency. All intervals are 95% confidence intervals about the mean from 1000 bootstrap replicates.
PpgAge predictions associate with exercise behavior
The Activity app on Apple Watch estimates physical activity level, including daily “exercise minutes,” the time spent on a “brisk activity” (defined as an activity at or above a brisk walk38), or a logged workout44. For each participant in the general cohort, we compute average daily exercise minutes over the course of study enrollment, and categorize men (n = 98,986) and women (n = 54,256) into five groups based on quintiles of the (age- and sex-matched) average exercise minutes distribution. We then study the age gap in relation to this activity variable and age.
For both male and female participants and across age categories, higher daily exercise minutes is consistent with a smaller age gap, see Fig. 6C, D. Similar to the smoking result above, we observe an increase in the age gap across exercise groups from the youngest cohort to the oldest. Individuals younger than 25 years old have mostly similar average age gaps across all quintiles of exercise minutes, with the exception of female participants in the lowest exercise minutes quintile (i.e., the least active individuals). For this group, the average age gap already deviates upwards from the remaining quintiles. For older age groups, individuals in the lowest exercise minutes quintile have an average age gap that deviates more and more from individuals in the higher exercise minutes quintiles. For example, for men younger than 25 years, the average age gap is 0.33 years (95% CI 0.17–0.48) in the lowest quintile vs 0.19 years (95% CI 0.06–0.33) in the highest quintile. For men between 35 and 45 years, individuals in the lowest quintile have an average age gap of 1.84 years (95% CI 1.73–1.95) vs 0.65 years (95% CI 0.56–0.74) for the highest quintile. Finally, for men between 65 and 75 years, the least active individuals have an average age gap of 3.85 years (95% CI 3.58–4.11) vs 1.34 years (95% CI 1.11–1.58) for the highest quintile. For women, we observe similar effects, although the uncertainty is slightly larger due to the smaller sample size. Finally, the ranking of the average age gap is consistent with increasing amounts of exercise minutes. See Fig. 6C, D for additional details, and Section S2 and Figs. S8 and S9 for additional summaries of activity and fitness.
PpgAge gap associates with disease rates when controlling for cardiorespiratory fitness
We also compare diagnosis rates within age-, sex-, and \({{{{\rm{VO}}}}}_{2}\,\max\)-matched groups using a subset of participants that have a \({{{{\rm{VO}}}}}_{2}\,\max\) estimate (n = 89,062). We find that the association observed for age- and sex-matched categories remains when controlling for \({{{{\rm{VO}}}}}_{2}\,\max\). For example, for women 45–55 years old, even among the most fit (highest \({{{{\rm{VO}}}}}_{2}\,\max\)) quintile, the oldest looking (q4) participants have a 2.1 times higher rate of high blood pressure diagnosis—a figure that was more in line with the average diagnosis rate of the second lowest \({{{{\rm{VO}}}}}_{2}\,\max\) category. See Fig. S9 for comparisons.
PpgAge gap associates with sleep stages
A subset of participants in AHMS contribute sleep stage data collected by Apple Watch45 (n = 56,802 men and n = 32,769 women). Sleep stages are categorized as “Awake,” “Deep,” “Core,” and “REM,” in the Health app and are derived from an accelerometer-based algorithm45. We study the association between PpgAge and several sleep-related variables, controlling for demographic factors.
For each available participant night (n = 16,093,920), we extract 4 sleep-related variables, (i) total sleep duration, the total time spent in non-“Awake” stages, (ii) deep sleep duration, the total time spent in the “Deep” stage, (iii) sleep efficiency, the total sleep duration divided by the elapsed time from the onset of first non-“Awake” stage to the end of the final non-“Awake” stage, and (iv) REM latency, the time from the onset of first non-“Awake” stage to the onset of first “REM” stage. Similar to smoking and exercise, we investigate the association of age gap with these sleep-related variables across age- and sex-matched groups. For further validation, we fit ordinary least squares (OLS) model for age-matched groups as well as the entire population, where the target variable is the age gap and explanatory variables include chronological age, biological sex, BMI, and the four sleep-related variables (see “Methods” for additional details).
We observe that across age- and sex-matched groups, earlier REM latency, longer total sleep duration, longer deep sleep duration, and higher sleep efficiency, are consistent with lower age gap, see Figs. 6E, F and S10a–f. Consistently, we observe similar association effects in the sign of the coefficients in OLS models, see Fig. S10g, h. First, the sign of the coefficients for total sleep duration, deep sleep duration and sleep efficiency are negative and consistent across different age-matched groups, indicating that longer total sleep duration, longer deep sleep duration and higher sleep efficiency associate with negative age gap (i.e., younger-looking status). Second, the sign of the coefficient for REM latency is positive across different age-matched groups, indicating that earlier REM latency associates with negative age gap (i.e., younger-looking). Figure S10h contains the statistics from the OLS models, indicating that all coefficients are significant. Interpreting efffect sizes, one additional hour of total sleep associates with 0.09 years of reduced age gap, and one additional hour of deep sleep associates with 0.99 years of reduced age gap. One extra percentage of sleep efficiency associates with 0.05 reduced age gap, and one hour earlier REM latency associates with 0.47 reduced age gap.
PpgAge predictions use morphological features beyond heart rate and heart rate variability
HR and HRV are common summaries of cardiac rate and rhythm estimated from PPG segments. HRV is known to decline with age and decreased health, and rise with increased aerobic fitness46. The full PPG waveform reflects changes in blood volume in the microvascular bed of tissue31, which may contain subtle-yet-informative patterns relevant to aging (see Fig. S11. To investigate this information difference, we compare PpgAge predictions (i.e., using the full PPG waveform via the learned representation) to models that only use HR and HRV as inputs.
Using the same training subjects and segments, we compute the 30-day mean, standard deviation, minimum, and maximum of HR and a set of HRV metrics (see S3 for full details), and use as features in both a linear model and a random forest model. HR/HRV-based models predict age less accurately than PpgAge across all subpopulations. In the healthy cohort, the linear and random forest model predict age with MAE of 6.10 years (95% CI 5.87–6.33) and 6.14 years (95% CI 5.91–6.37), respectively, significantly worse than the PpgAge predictions on the same test subjects, 2.42 years (95% CI 2.30–2.54). See Fig. S12 for additional details and comparisons to HR/HRV models.
PpgAge predictions are consistent with known features of aging
To shed light on what features PpgAge uses, we visualize segmented PPG beats that correspond to high and low age gaps across a range of chronological age groups in Supplemental Fig. S11. The age gap is picking up on the typical features of aging (see Charlton et al.29 Fig. 4), i.e., the dicrotic notch and diastolic peak disappear as an individual appears older across all chronological age groups. While these features appear to be important to our prediction (and are not captured by HR/HRV metrics), it is possible that predictions exploit more subtle, data-driven features with unknown physiological roots.
Modeling healthy aging strengthens association between age gap and disease
Additionally, training the PpgAge model on a healthy cohort induces a stronger association between the age gap and diagnosis rates compared to a model trained on a randomly selected (i.e., representative) cohort of equal size. Among 35–45 year old men, a PpgAge gap >6 years based on the model trained on the healthy cohort has a relative rate of diabetes diagnosis of 2.99 × the average (95% CI 2.74–3.23); when training on a random subset, this relative diagnosis rate drops to 2.18 × (95% CI 1.89–2.46). Differences between the two models are more pronounced in older groups. Among 65–75 year old men, a PpgAge gap >6 years from the healthy-trained model carries a 1.61 × relative diabetes diagnosis rate (95% CI 1.47–1.75); the general-trained model has a relative rate of 1.1 × (95% CI 0.97–1.23)—that is, the general model age gap does not stratify older male subjects into high and low prevalence groups at all. See Supplemental Fig. S13 for a more details.
Compared to PpgAge HR/HRV-based age gaps weakly associate with disease
We again compare age gap associations using the full PPG model to models trained using only HR/HRV features. In general, we see a much weaker association with self-reported diagnoses than the full waveform model. As an example, for 45–55 year old men, the relative rate of diabetes diagnosis in the oldest looking quintile is 2.1 (95% CI 1.96–2.20) with PpgAge (i.e., using the full waveform). That drops to 1.25 (95% CI 1.15–1.35) when using the HR/HRV-based random forest model. For peripheral artery disease in that same group, the comparison is 2.8 (95% CI 2.32–3.26) for the full waveform model, which drops to 1.47 (95% CI 1.044–1.90) for the HR/HRV model. This weakened association suggests that HR and HRV alone convey some information about disease in the PPG signal, while the full waveform morphology contains richer information. Notably, we see either no change or improvement for prevalence of pacemaker, suggesting HR/HRV information is a sufficient correlate of the condition. See Figs. S12 and S11 for more details.
Longitudinal PpgAge associates with pregnancy status
Recent work has shown that pregnancy is associated with accelerated biological aging as measured by epigenetic biomarkers47,48. Here, we examine the relationship between PpgAge and pregnancy on a subset of participants in AHMS who become pregnant during the study. We subset to participants who self-report no pregnancy at baseline and report either a vaginal birth or Cesarean section in a monthly health update survey (n = 690). We further subset to participants with sufficient age estimates proximal to the date of the reported pregnancy outcome—at least 20 days of age estimates in three 3-month periods before and one 3-month period after parturition (n = 165).
In the 270 days preceding birth, we observe a steady median increase leading into a sharp median increase around 60 days before parturition, where PpgAge peaks and then slowly declines. Over this (approximate) pregnancy period, we observe a median increase of 3.56 years (IQR 1.65–5.65). Additionally, we observe a significantly larger slope in the three month period directly preceding birth, and a negative median slope in the 90-day period following pregnancy. We note this increase in PpgAge over the pregnancy period is in line with increases estimated with DNA methylation biomarkers47; see Fig. 7 for visual and statistical summaries. A longer observation window is required to assess how persistent this effect is, or if PpgAge reverts to pre-pregnancy levels. On a smaller subset with sufficient longitudinal data (n = 29), we observe a slightly negative median age gap slope for a year post parturition; see Fig. S14 for more details and subpopulation comparisons by age, BMI, and pregnancy complications.
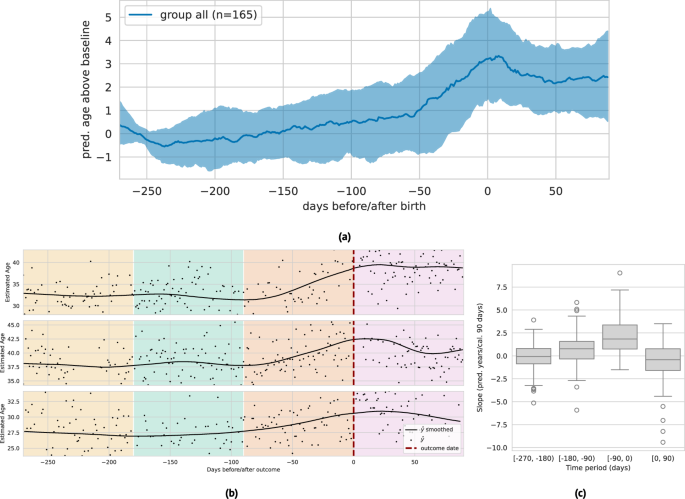
a Median (black) and interquartile range (gray) of lowess-smoothed predicted age time series (centered around predicted age during first 90 days of approximate pregnancy period), n = 165 participants. We observe a median 3.56 year [1.65–5.65 IQR] increase in predicted age throughout the pregnancy period, peaking at time of birth. Estimate age increase is similar to those reported in epigenetic age biomarkers47. b Examples of longitudinal predicted age with parturition date (i.e., vaginal delivery or Cesarean section) highlighted, with background colors denoting the three 90-day periods before, and one 90-day period after. We subset to individuals in the study that (i) report not pregnant at study start, (ii) report a pregnancy outcome, and (iii) have at least 20 days with predicted age available in each of the three month periods (n = 161). c The distribution of slopes within each of these 90-day periods (n = 165). We observe a significantly higher slope in the period immediately preceding birth, and a slight negative slope in the period immediately following birth. The box depicts quartiles of the data, with the whiskers 1.5 times the inter-quartile range from the first and third quartiles. See Fig. S14 for additional analysis.
PpgAge often increases around certain major adverse cardiovascular events
We investigate the sensitivity of participant-level PpgAge time series to cardiac events. Centering the self-reported event date at time 0, we examine the time period of 180 days before to 180 days after, and visualize the median and interquartile range of lowess-smoothed PpgAge time series. For coronary artery bypass graft (CABG) surgery, mycoardial infarction events, and valve replacement surgery, we see median predicted age increases from 1.7 to 2.5 years. Investigating individual time series for subjects with a CABG (Fig. 8), we see variability from participant-to-participant. Some participants exhibit a sharp changepoint at the time of the event, while others exhibit more gradual increases PpgAge time series. Additional time series and distributions of the cumulative change in PpgAge for myocardial infarction and valve replacement can be found in Fig. S7.
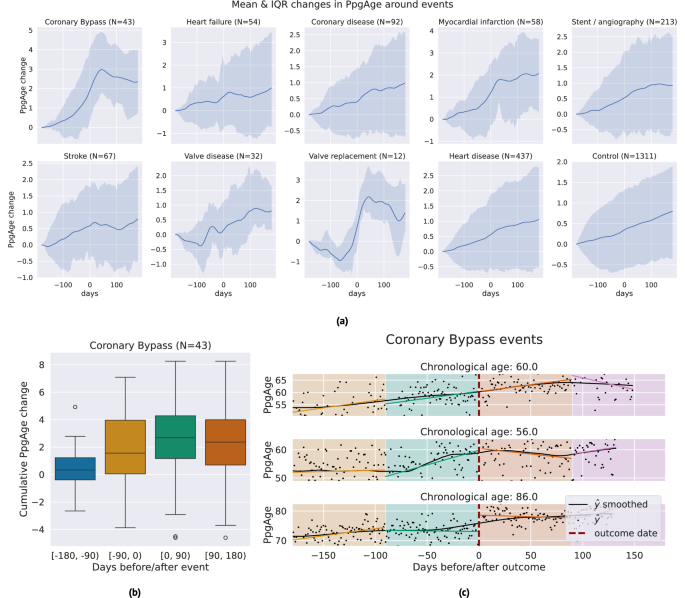
a Median (blue line) and interquartile range (shaded blue) of lowess-smoothed PpgAge time series, normalized to 0 at 180 days before the date of the event. Each subplot shows how PpgAge estimates change before and after cardiac events of different types, as well as for non-event controls (bottom right subplot). For bypass surgery, myocardial infarction, and valve replacement surgery, we see median increases of around 2 years over the one year time period. b Distribution of cumulative PpgAge increase from −180 days before to +180 days after a coronary bypass surgery, within each 90-day period, n = 43 participants. The box depicts quartiles of the data, with the whiskers 1.5 times the inter-quartile range from the first and third quartiles. c Individual examples of predicted age trajectories, centered on a coronary bypass event. Individual examples reveal heterogeneity of predicted age sensitivity–some exhibit a strong change point around the event, while others continue current trajectory. A randomized control study complementing this can provide insights into potential confounders.
First Appeared on
Source link

