Biallelic variants in RNU2-2 cause the most prevalent known recessive neurodevelopmental disorder
Genetic association analysis
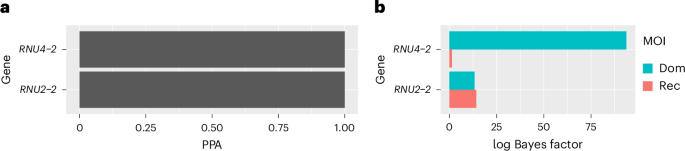
We identified the recessive form of RNU2-2 syndrome through a joint statistical analysis of the 100,000 Genomes Project (100KGP) and the Genomic Medicine Service (GMS) data in the National Genomic Research Library (NGRL)14 from pedigrees in the UK with rare disorders. Following our previously described approach3,15, we applied the BeviMed genetic association method16 to compare rare variant genotypes in the 41,132 canonical transcript entries in Ensembl v104 having a biotype other than ‘protein_coding’ between 14,805 unrelated NDD cases and 52,861 unrelated participants without an NDD. As in our previous analysis4, only two genes with a posterior probability of association (PPA) >0.5 emerged: RNU4-2 and RNU2-2 (Fig. 1a). Given that RNU2-2 is only 191 bp long, we were able to use read-backed phasing17 to delineate individuals with two rare variants in cis and those with two rare variants in compound heterozygosity (that is, in trans). After phasing, we reran BeviMed using an adaptation that accounts for the phasing information to obtain refined log Bayes factors for dominant and recessive modes of inheritance. This analysis demonstrated only weak evidence of a recessive disorder associated with RNU4-2 (log Bayes factor of 1.3) but very strong evidence of a recessive disorder associated with RNU2-2 (log Bayes factor of 18.2) (Fig. 1b).
a, BeviMed PPAs between RNU4-2 and RNU2-2 and case status. All other noncoding genes and pseudogenes had PPA <0.5. b, For each of the two genes with PPA >0.5, bars indicating BeviMed log Bayes factors with respect to the model representing a dominant (Dom) and the model representing a recessive (Rec) mode of inheritance (MOI).
For each rare variant in RNU2-2, we computed conditional probabilities of pathogenicity given the recessive inheritance model (PPP|rec). These probabilities indicate the degree of evidence supporting pathogenicity for each variant and depend on the patterns of homozygosity and compound heterozygosity in cases and controls. There were 18 probands (12 from the 100KGP and 6 from the GMS) with two alleles in trans at variants with PPP|rec >0.8 (‘tier 1 variants’). We denoted cases in these families as high-confidence ‘tier 1 cases’ (Fig. 2a). Out of the 18 tier 1 cases, 11 were homozygous and 7 were compound heterozygous. In addition, there were 13 compound heterozygous probands who were not tier 1 cases but were biallelic for variants with PPP|rec >0.6 (10 from the 100KGP and 3 from the GMS). We labeled the lower-confidence cases in these families as ‘tier 2 cases’ and variants with 0.6 < PPP|rec ≤ 0.8 as ‘tier 2 variants’ (Extended Data Fig. 1). None of the tier 1 and tier 2 variants were observed in homozygosity in gnomAD v4.
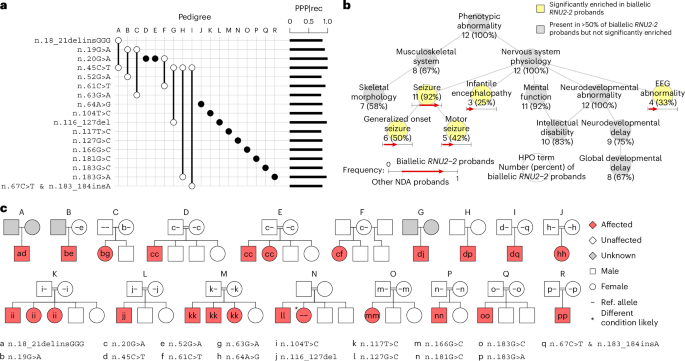
a, Variant-by-pedigree grid illustrating the variants and genotypes corresponding to the tier 1 cases. Filled circles denote homozygotes, while empty circles denote heterozygotes. A pair of empty circles connected by a line denotes compound heterozygotes. The PPP|rec values for each variant are shown as bars on the right. b, Graph showing the ‘is-a’ relationships among HPO terms (abbreviated as needed for conciseness) present in at least half of the 12 tier 1 cases in the discovery collection or significantly enriched among them relative to 9,112 probands with the ‘Neurodevelopmental abnormality’ (NDA) HPO term in the 100KGP. The significantly overrepresented terms are highlighted. For each term, the number of cases with the term and the proportion that number represents out of 12 is shown. For each overrepresented term, the proportion of NDA-coded probands with the term and the proportion of tier 1 RNU2-2 cases in the 100KGP with the term are represented as the horizontal coordinate of the base and the head of an arrow, respectively. c, Pedigrees for biallelic tier 1 cases in the discovery collection. Filled symbols indicate affected individuals. Double lines indicate consanguinity. Siblings are not ordered by age.
To corroborate the statistical association, we assessed the distinctiveness of the sets of Human Phenotype Ontology (HPO) terms assigned to the 12 tier 1 cases in the 100KGP, omitting the GMS cases due to sparse HPO coding (Extended Data Fig. 2). The 12 cases were significantly more similar than expected by chance (P = 0.001) (Extended Data Fig. 3). Statistically enriched terms relative to other NDD cases in the 100KGP included ‘Generalized onset seizure’, ‘Motor seizure’, ‘Infantile encephalopathy’ and ‘EEG abnormality’ (Fig. 2b). The terms ‘Intellectual disability’, ‘Global developmental delay’ and ‘Abnormal skeletal morphology’ (primarily due to ‘Microcephaly’) were attached to the majority of tier 1 cases in the 100KGP but were not significantly enriched (Fig. 2b).
The 18 tier 1 probands comprised 7 compound heterozygotes and 11 homozygotes, the latter arising from consanguinity (Fig. 2c). In 10 of the 11 pedigrees for which both parental genotypes were available, the variants were inherited, and in one such pedigree (pedigree C) one variant was de novo. Cosegregation in five biallelic affected siblings across three families provided additional evidence for causality of n.20G>A, n.104T>C and n.117T>C. One affected sibling of a homozygous case with n.127G>C was homozygous wild type. This, however, did not contradict the likely pathogenicity of the variant, because that sibling exhibited a different phenotype consistent with trichothiodystrophy, probably due to a separate homozygous variant in GTF2H5. Among the tier 2 pedigrees, four of the nine pedigrees for which both parental genotypes were available had a de novo mutation (pedigrees C2, G2, J2 and K2), while one affected sibling in one family (in pedigree D2) inherited both variants found in the corresponding proband (n.28C>G with n.158G>C); no breaches of cosegregation were observed (Extended Data Fig. 1). All parents in both tiers were marked unaffected and had no assigned HPO terms.
Replication
To corroborate that variants in RNU2-2 cause a recessive NDD, we examined the genomes of 5,323 participants from 1,759 families in the Undiagnosed Diseases Network (UDN) in the USA, 220 unexplained NDD cases enrolled in the Ospedale Pediatrico Bambino Gesù Undiagnosed Patients Program (UPP) in Italy and 5,699 individuals (including 1,206 probands with NDDs) that had undergone diagnostic genome sequencing at Erasmus MC in the Netherlands. In these collections, we identified seven compound heterozygous probands and two affected siblings who were biallelic for rare variants in RNU2-2 (Fig. 3a). Except for pedigree S, all replication pedigrees had variants with strong support in the NGRL analysis: n.19G>A, n.104T>C and n.116_127del were tier 1 variants, while n.159_176dup and n.182_190del overlapped tier 1 variants. Furthermore, n.100T>G and n.104T>G were tier 2 variants, while n.28C>T was at the same position as the tier 2 variant n.28C>G. Cases in pedigrees S and V each had a de novo mutation (n.150T>C and n.104T>C, respectively), echoing observations of de novo mutations in tier 1 and tier 2 pedigrees (n.25G>A, n.48A>G, n.63G>A, n.81G>A and n.155C>T). None of the remaining three variants (n.12G>A, n.31G>A and n.148C>A) were observed in biallelic form in the NGRL. All variant allele pairs in the cases in the replication collections were in trans (Fig. 3b); none was observed in homozygosity in gnomAD v4. The HPO terms assigned to the nine cases revealed a broad consistency with the terms of tier 1 and tier 2 cases, including ‘Global developmental delay’ and ‘Seizure’ (Fig. 3c). There were no reports of NDD-related traits in pedigree members carrying only one of the compound heterozygous RNU2-2 variants present in the affected relatives.
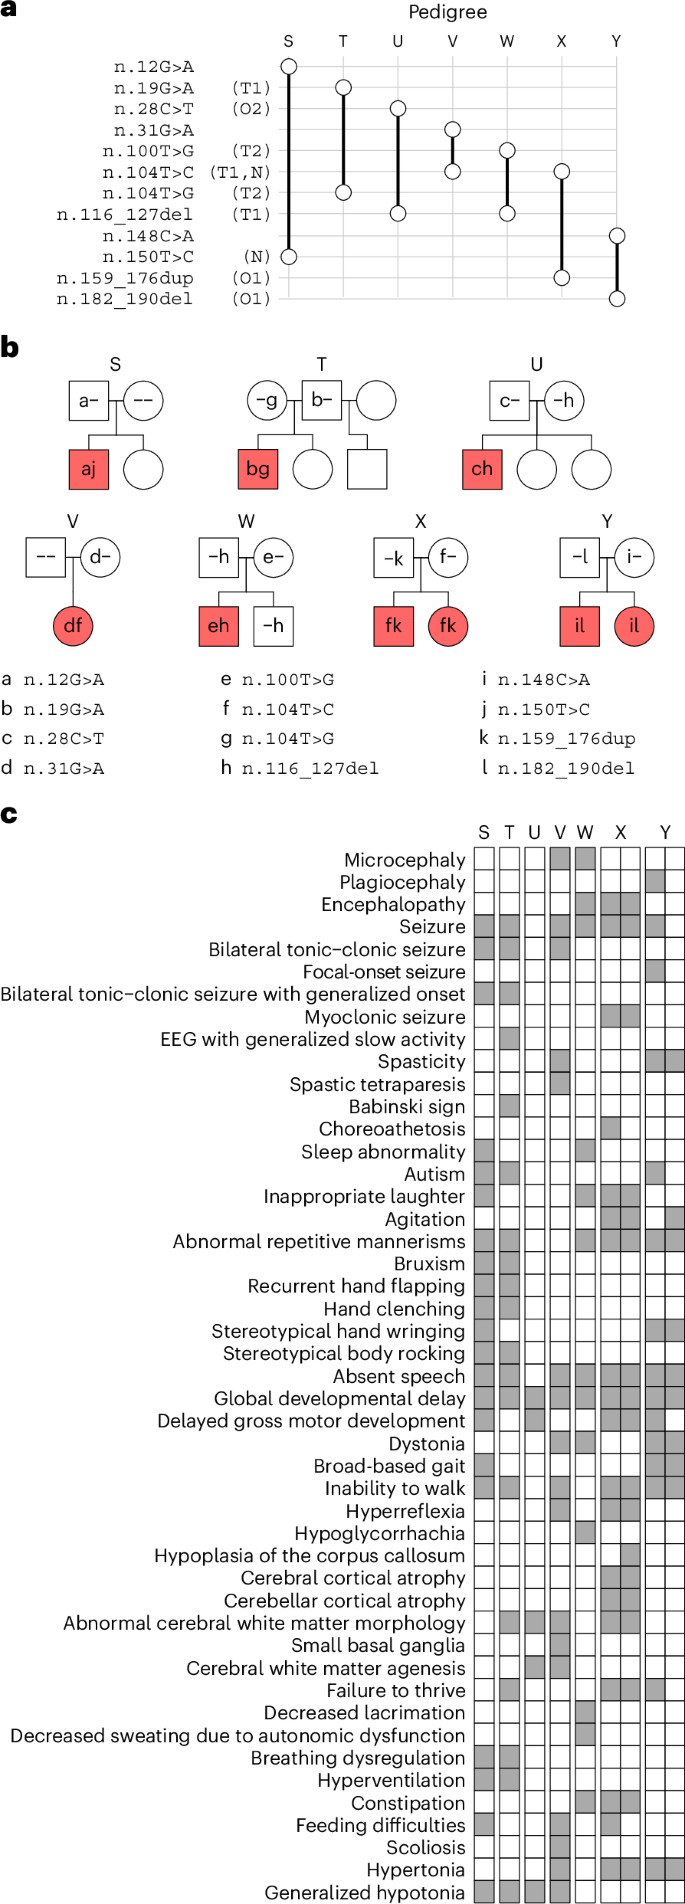
a, Variant-by-pedigree grid for affected pedigrees identified in the UDN (T, V, W and Y), UPP (X) and Erasmus MC (S and U) collections. T1, tier 1 variant; T2, tier 2 variant; O1, variant overlapping a tier 1 variant; N, variant seen as a de novo mutation in at least one case. The symbol representations match those in Fig. 2a. b, Pedigrees in the replication collections. The symbol representations match those in Fig. 2c. Siblings are not ordered by age. c, Grid of HPO terms assigned to the cases in the replication pedigrees. The HPO terms for the affected brother (left) and sister (right) in pedigrees X and Y are shown as two attached columns.
Phenotypic spectrum
Detailed clinical vignettes for 11 cases from 9 families (pedigrees F, H, S, T, U, V, W, X and Y) are provided in the Supplementary Note and summarized in Supplementary Table 1. These indicate that the recessive NDD caused by biallelic variants in RNU2-2 was typically first recognized in infancy or early childhood. Pregnancy and perinatal histories were usually unremarkable, although there were occasional reports of jaundice and prematurity. Presenting features included hypotonia, global developmental delay and isolated expressive/receptive language impairment. The phenotype spanned from mild learning disability with autism spectrum disorder to severe, progressive epileptic encephalopathy. Motor impairment ranged from normal ambulation to complete non-ambulation. There were also reports of dystonia, spasticity and choreoathetosis. Speech was typically reported as being limited to a few words or absent. Epilepsy was common, often beginning in infancy or early childhood, and could evolve to drug-resistant Lennox–Gastaut syndrome; electroencephalograms (EEGs) showed diffuse slowing and epileptiform discharges. Brain magnetic resonance imaging scans were often normal early in life but could later show cerebral and cerebellar atrophy or white matter changes (Extended Data Fig. 4). Severely affected cases developed scoliosis, feeding dependence and autonomic instability. Premature death occurred in one case resulting from prolonged seizures and respiratory compromise. Milder cases remained stable into adolescence or adulthood but with persistent cognitive and behavioral difficulties. In participants with available clinical images, a distinctive or consistent facial gestalt was not evident, although some individuals were dysmorphic. For example, the proband from pedigree V had a short philtrum and prominent central incisors/macrodontia (Fig. 4).
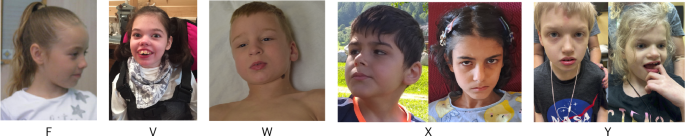
Among the seven participants from five families with available photographs, no obvious characteristic facial gestalt was observed; however, some individuals exhibited dysmorphic features, including deep-set eyes, straight eyebrows, a prominent nose and a flat filtrum with thin upper lip vermilion. We obtained consent to publish these clinical photographs.
Prevalence
In the 100KGP, recessive RNU2-2 syndrome was, by a wide margin, the most prevalent etiological gene for a recessive NDD, accounting for the only biallelic cases among the top 30 most prevalent etiological genes for NDDs (Extended Data Fig. 5). It may be that an elevated mutation rate contributes to this elevated frequency, given that we observed seven cases with de novo mutations (five of which had a paternal origin, distinguishing it from de novo mutations responsible for dominant RNU2-2 (and RNU4-2) NDDs, which almost always have a maternal origin4,5). A recent study observed a higher-than-expected mutation rate of snRNA genes, which it attributed to the mutagenic effect of polymerase III18, but U2 genes are thought to be transcribed by polymerase II19. No other gene apart from RNU2-2 accounted for more than four biallelic NDD probands in the 100KGP. The 100KGP cases with recessive RNU2-2 syndrome amounted to between 36% (tier 1 cases only) and 60% (tier 1 and tier 2 cases) of the number of ReNU cases. Recessive RNU2-2 syndrome accounted for between 7.6% (tier 1 cases only) and 13.1% (tier 1 and tier 2 cases) of all NDD probands with a biallelic genetic diagnosis in the 100KGP. In the GMS, which has less ascertainment bias due to prior testing, the proportions were 6.7% and 9.8%, respectively. Given the moderate statistical support for tier 2 variants, the additional orthogonal evidence for many of the 25 tier 2 variants (Extended Data Fig. 1) and the possibility that some untiered biallelic cases are affected (see below), the upper bounds are likely to be closer to the true prevalences than the lower bounds. In the 100KGP and the GMS, which contains 9 cases with dominant RNU2-2 syndrome (due to mutations at n.4 or n.35), 7 tier 1 pedigrees and all 13 tier 2 pedigrees with biallelic variants in RNU2-2 were nonconsanguineous. It is therefore very likely that, even in populations in which consanguineous relationships are very rare, recessive RNU2-2 syndrome is more prevalent than the dominant form. Furthermore, the recessive form is liable to affect multiple siblings within pedigrees, further boosting its prevalence.
Mechanism
U2 snRNAs, encoded by RNU2-1 and related paralogs such as RNU2-2, interact through a branch point recognition sequence (BPRS) with intronic branch sites in protein coding pre-mRNAs. U2 snRNAs also interact with multiple other snRNAs and RNA-binding proteins within the major spliceosome, which collectively maintain its quaternary structure and function during the transitions from the A to the B* spliceosome complex, the latter possessing catalytic activity for intron excision20,21. Dominant RNU2-2 syndrome results from variants predicted to disrupt intermolecular interactions with U6 or with the branch sites of introns4. By contrast, most variants that cause recessive RNU2-2 syndrome were predicted to disrupt intramolecular interactions, in most cases by abolishing Watson–Crick pairings within the U2-2 stem loop motifs (Fig. 5). The stem loops have ribonucleoprotein binding functions but also undergo dynamic remodeling during spliceosome assembly that is necessary for the correct presentation of the BPRS for intron recognition and for the acquisition of spliceosome catalytic activity. Other variants were located within the BPRS itself (n.31G>A, n.39T>C, n.43T>C and n.45C>T) or were within the site that interacts with the Sm-type heteroheptameric ring (n.100T>G, n.104T>G and n.104T>C). Structural modeling of the tier 1 variants predicted substantial destabilization of stem loop motifs or intermolecular interactions that may potentially disrupt multiple aspects of spliceosome function (Supplementary Table 2). By contrast, of the eight variants with PPP|rec <0.2 (that is, those with statistical evidence of being nonpathogenic) (n.58T>C, n.71C>G, n.74T>C, n.82G>A, n.103T>G, n.110T>C, n.143C>T and n.146C>T), four were within loops or in non-interacting linear sequences.
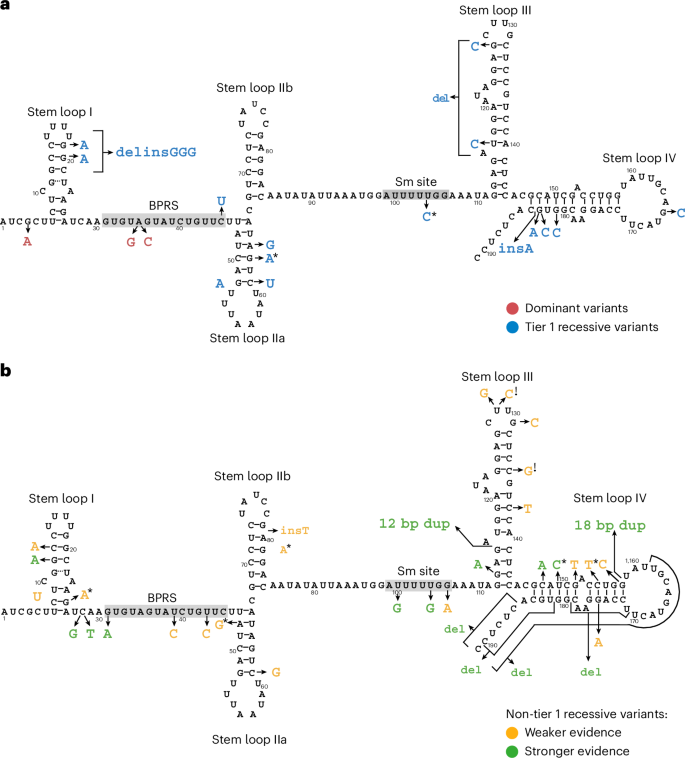
a, Schematic of the secondary structure of human U2-2 snRNA with ribonucleotide numbering according to the RNU2-2 reference sequence ENST00000410396. Stem loops 1, IIa, IIb, III and IV, the BPRS and the Sm interacting site (Sm site) are taken from the U2-1 structure described by Feltz et al.20 and adapted according to PDB structure 7EVO using PDBSum29. The ribonucleotide substitutions at positions 4 and 35 previously reported to be causal of dominant RNU2-2 syndrome are indicated in red4,6. Tier 1 variants, which are likely to be responsible for recessive RNU2-2 syndrome, are indicated in blue. Note that n.183_184 insA arose on a haplotype containing n.67C>T but, because n.67C>T is much more common and is outside any domains or stem loops, only the change in ribonucleotide sequence induced by n.183_184 insA is shown. b, Schematic showing variants that are not tier 1 variants. Non-tier 1 variants that are present in the untiered case with low U2-2 expression, that are in the replication cases, that overlap a tier 1 variant or that overlap a variant in the replication cases are shown as having stronger evidence (green) of pathogenicity. The remainder are shown as having weaker evidence (amber) of pathogenicity. *Observed as a de novo variant in at least one case. !, variant may be benign, as it occurs in a case (in pedigree L2) with elevated U2-2 expression.
To explore the possible molecular mechanisms of disease further, we investigated gene expression estimates of U2-2 and U2-1 from whole-blood RNA sequencing (RNA-seq) data on 500 NGRL participants, all six biallelic RNU2-2 participants with available data and five previously published NDD cases with the dominant RNU2-2 NDD4. The six biallelic participants included three tier 1 cases (in pedigrees F, P and Q), two tier 2 cases (in pedigrees L2 and M2) and one untiered NDD case. All three tier 1 cases, one of the two tier 2 cases (in pedigree M2) and the untiered case had very low U2-2 abundance (Fig. 6a). Interestingly, the tier 2 case with a normal U2-2 level (in pedigree L2) was one of only three tier 2 cases for which both variants were neither de novo nor supported by observations in tier 1 or replication cases (Extended Data Fig. 1), suggesting that at least one of her variants is benign (n.129T>C or n.135C>G). Conversely, the untiered biallelic case with low U2-2 abundance had n.113G>A (PPP|rec of 0.43) and n.116_127dup (PPP|rec of 0.67), suggesting these variants are pathogenic (Supplementary Table 2). The five bona fide cases (that is, those with low U2-2 abundance) had a compensatory increase in U2-1 abundance (log2 fold change (FC) 1.28, P = 1.00 × 10⁻³, linear regression), such that total U2 expression was normal (P = 0.404) (Fig. 6a), consistent with an unpublished report on RNU2-2-knockout cells22. Due to the correlation between U2-2 and U2-1 abundance, measuring both genes provided excellent discrimination between bona fide cases and controls (Fig. 6b). Adjusting for U2-1 expression, mean U2-2 expression among the five cases was ~1.6% of the level in controls on the real scale (log2FC −5.99, P = 4.25 × 10−102, linear regression). We also identified 18 monoallelic participants carrying exactly one heterozygous variant of the ones observed in biallelic patients (excluding those in pedigree L2). Relative to bona fide cases, these heterozygous participants displayed a subproportional decrease in U2-2 expression, having a mean of ~74% the normal level on the real scale after adjusting for U2-1 expression (log2FC −0.43, P = 1.44 × 10⁻⁴, linear regression) (Fig. 6c). The allelic imbalances of RNA-seq alignments at well-covered heterozygous variants (in 15 of the 18 monoallelic participants) implied that the subproportionality could largely be attributed to wild-type compensation: the alternate alleles were estimated to be downregulated to a degree comparable to that observed in biallelic cases (mean log2FC −3.83, that is, ~7% of the normal level), while increased expression of the wild-type allele partially compensated for this shortfall (mean log2FC 0.51, that is, ~142% of the normal level) (Fig. 6d). Extending the analysis of allelic imbalance to include all monoallelic NGRL participants (with exactly one heterozygous variant in RNU2-2) identified 32 additional variants that potentially destabilize U2-2 to an extent that might render them pathogenic in biallelic form (Extended Data Fig. 6 and Supplementary Table 3). These results suggest that estimates of expression and allelic imbalance in blood from unaffected monoallelic individuals, together with expression analysis of patient blood, can inform variant interpretation in a diagnostic setting. This distinguishes the recessive disorder from the dominant disorder, which is not characterized by reduced U2-2 expression in blood (Fig. 6a,b).
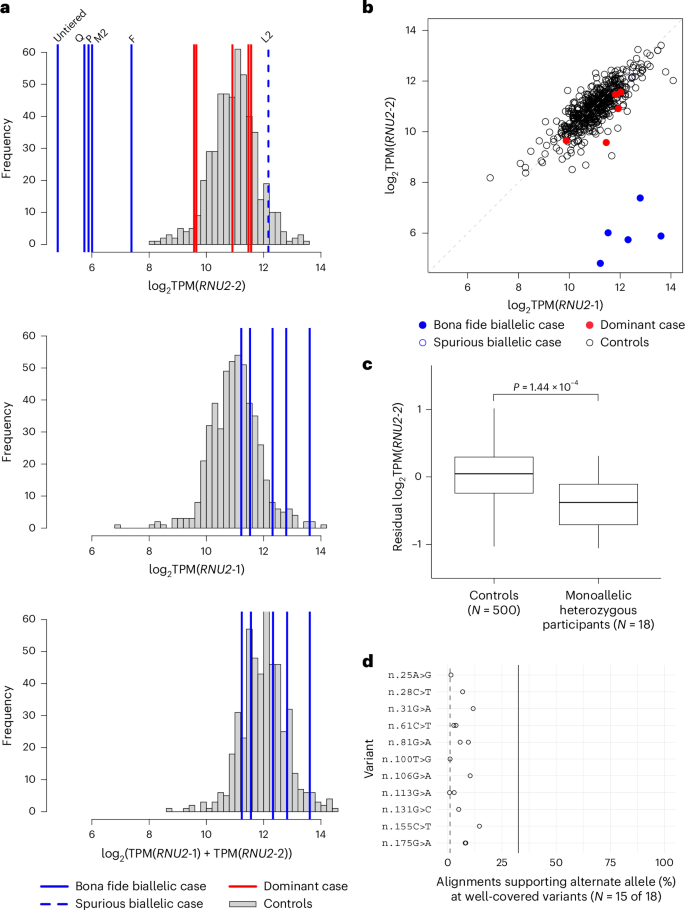
a, Histograms of log2 expression of U2-2, U2-1 and U2-2 + U2-1 in whole blood samples from 500 NGRL participants without an NDD. Biallelic RNU2-2 cases are indicated with superimposed blue labeled lines. The case in tier 2 pedigree L2, shown with a dashed blue line, has normal U2-2 expression and is thus probably not affected with recessive RNU2-2 NDD (shown in the top histogram only). NDD cases with dominant pathogenic mutations in RNU2-2 are shown with red bars (shown in the top histogram only). b, Scatter plot of log2 expression of U2-1 against that of U2-2 in the participants corresponding to a. c, Box plot of U2-2 expression adjusted for U2-1 expression in 500 controls and 18 monoallelic participants with heterozygous variants seen in biallelic patients but excluding those in pedigree L2 (one participant with each of n.8C>T, n.25G>A, n.28C>T, n.31G>A, n.100T>G, n.106G>A, n.131G>C and n.155C>T, and two with each of n.61C>T, n.81G>A, n.113G>A, n.175G>A and n.183G>A). The lower, center and upper lines respectively indicate the lower quartile, median and upper quartile. Whiskers are drawn up to the most extreme points that are less than 1.5× the interquartile range away from the nearest quartile. The P value was obtained by linear regression under the null hypothesis that the two groups have the same mean. d, Dot plot of the percentage of RNA-seq alignments supporting the mutant allele at the indicated heterozygous variants in monoallelic participants. Only percentages computed from at least 20 overlapping reads are shown. The solid line represents the expected value if the alternate alleles were less prone to degradation than estimated from biallelic cases and if there were no compensation from the wild-type allele. The dashed line represents the expected value if the alternate alleles degraded to the same extent as in biallelic cases and the wild-type allele was overexpressed.
Given the well-known function of U2 snRNAs within the major spliceosome, we speculated that cells from the five bona fide cases with RNA-seq data (F, P, Q, M2 and the untiered case) might exhibit differential gene expression (beyond downregulation of U2-2) and/or aberrant splicing. To explore this hypothesis, we compared RNA-seq data from those five cases and the 500 control participants. Only U2-2 was significantly downregulated after controlling the false discovery rate at 5% (log2FC −4.87, q = 7.95 × 10⁻³¹) (Extended Data Fig. 7a). Two genes were significantly upregulated (log2FC 2.89, q = 3.81 × 10⁻³ and log2FC 3.19, q = 7.12 × 10⁻³), but in each case this was the result of just one outlying sample rather than a consistent increase across the five samples. We did not detect differential splice junction usage or differential patterns of splicing (Extended Data Fig. 7b–d), although this may be attributable to a lack of power. Larger sample sizes or transcriptomic analysis of other tissue types may be required to understand the downstream effects of loss of U2-2 expression.
First Appeared on
Source link

