Chilling New Global Stress Map Reveals Areas on the Verge of Massive Earthquake Activity!
Earthquakes are some of nature’s most destructive forces, but what if we could better predict where they might strike? A new global stress map, based on more than 100,000 measurements, reveals areas of Earth’s crust that are most vulnerable to failure. The groundbreaking tool is poised to change how we approach earthquake science and safer drilling. Compiled by a team at the GFZ Helmholtz Centre for Geosciences and partners at The University of Queensland, this map offers fresh insights into the forces shaping our planet.
The Project Behind the Global Stress Map
The project is run at the GFZ Helmholtz Centre for Geosciences with partners at The University of Queensland. This collaboration has resulted in a comprehensive update to an existing global stress map, more than doubling the amount of data since 2016. The map is based on an extensive database that tracks the orientation and intensity of maximum horizontal stress (SHmax) in Earth’s crust. By understanding these stress patterns, scientists can identify regions at risk of faulting, ultimately improving earthquake prediction models and safety measures for drilling operations.
The significance of this project lies not just in the sheer scale of data but in its practical applications. Stress in the Earth’s crust doesn’t just lead to earthquakes; it affects everything from geothermal energy extraction to carbon storage and deep waste isolation. By mapping these stress fields, the team at GFZ Helmholtz Centre and The University of Queensland is helping engineers and geologists make better-informed decisions about how to approach projects that could influence or be affected by tectonic movements.
What the New Stress Map Reveals
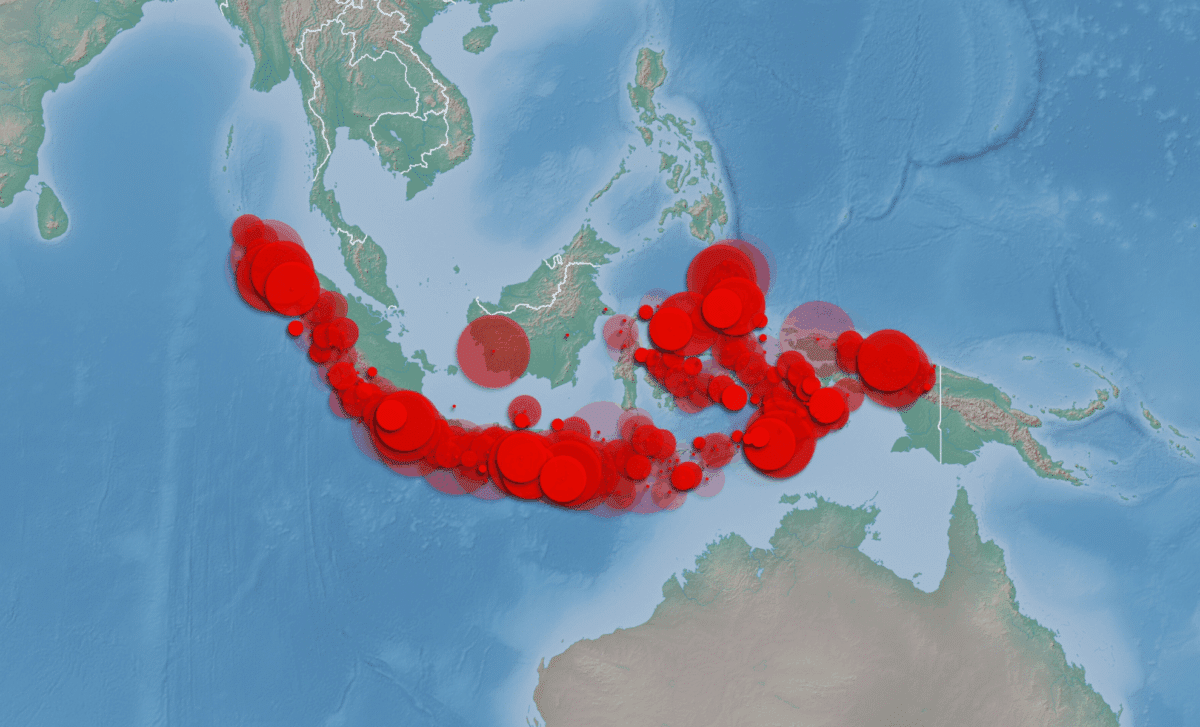
The new stress map provides a clearer understanding of where and how Earth’s crust might fail. One of the key features is the visualization of faulting types: normal faulting (red), strike-slip faulting (green), and thrust faulting (blue). These color-coded markers help scientists and engineers assess the forces that are at work in specific regions, offering clues about potential earthquake risks.
In particular, the map tracks the orientation of SHmax, which is the direction in which horizontal stress is greatest. This data comes from a variety of sources, including seismic events, borehole measurements, and field tests. The result is a global, consistent picture that not only reveals stress orientations but also helps highlight areas where small shifts could lead to major earthquakes. The new map also introduces nearly 3,000 deep borehole measurements, refining the precision of the data and filling in previously sparse areas.
The Bowen Basin Surprise: A Key Finding
A striking discovery emerged from the Bowen Basin in eastern Australia, where the stress map revealed an unexpected rotation of SHmax. Within just 62 miles, there was a sharp shift in the direction of maximum horizontal stress by over 50 degrees. This anomaly, identified through a high-resolution paper, supports the long-held theory that variations in local rock properties—such as density—can significantly alter stress orientations over short distances. These findings underline the complexity of stress fields and how local geology can redirect global tectonic forces in unexpected ways.
The practical takeaway here is clear: drilling operations just a few miles apart may require different approaches, as the direction of maximum stress can vary greatly within small geographic areas. Understanding these nuances is crucial for improving safety in drilling operations and reducing the risk of triggering seismic events.
Safer Drilling and Earthquake Risk Management
Drilling for geothermal energy, oil, and gas comes with a significant risk—human activities can sometimes induce earthquakes. This risk is particularly high when fluid injections or other operations change the pressure in underground rock formations. The new stress map helps identify the safest paths for drilling by highlighting the areas where stress is least likely to cause failure. By knowing the stress fields in advance, engineers can design better well paths and choose the correct casing and mud weights to prevent problems like stuck pipes or well blowouts.
The map also helps in managing the risk of human-induced earthquakes. As highlighted by the USGS, fluid injection can raise pore pressure in the Earth’s crust, triggering faults that might otherwise remain dormant. With this global stress map, scientists and industry professionals can better predict where these induced earthquakes might occur, allowing for safer planning and mitigation strategies.
A New Era of Data-Driven Earthquake Science
The sheer volume of data in the updated stress map marks a new era for earthquake science and risk management. The map’s increased data density, coupled with a new database platform, enables faster updates and more frequent releases. This means that as new measurements are taken—whether from boreholes or seismic events—the map can be quickly adjusted to provide a more accurate and timely picture of global stress fields.
For emergency planners, this is invaluable. They can use the map to simulate how seismic events might unfold in urban areas or near critical infrastructure like dams. By testing various scenarios, planners can develop better preparedness strategies and ensure that response measures are in place when needed.
First Appeared on
Source link

