Designing allosteric modulators to change GPCR G protein subtype selectivity
Cell lines
HEK293T/17 (CRL-11268, RRID: CVCL_1926) cells were obtained from the American Type Culture Collection (ATCC). G-protein-deficient HEK293 cells (ΔGNAS, ΔGNAL, ΔGNAQ, ΔGNA11, ΔGNA12 and ΔGNA13, HEK293 clone 38 (ref. 54) and β-arrestin 1/2-deficient HEK293 cells (ΔARRB1 and ΔARRB2; also known as arrestin 2 and arrestin 3, respectively, HEK293 clone 4 (ref. 27)) have been previously described. All cells were cultured in Dulbecco’s Modified Eagle Medium (DMEM) with 10% fetal bovine serum (FBS) (Invitrogen, CX30346) and 1× antibiotic antimycotic solution (100 units ml−1 penicillin, 100 µg ml−1 streptomycin and 250 ng ml−1 amphotericin B; Thermo Fisher Scientific, 15240062). Cells were grown exponentially in an incubator at 37 °C under 5% CO2 and subcultured at ratios of 1:2–1:10 every two to four days using 0.05% trypsin-EDTA (Thermo Fisher Scientific, 25300120).
Chemicals
All chemicals were obtained from MilliporeSigma unless otherwise noted. SBI-0654553 HCl (abbreviated as SBI-553) was synthesized by the Conrad Prebys Center for Chemical Genomics at the Sanford Burnham Prebys Medical Discovery Institute. Coelenterazine h and coelenterazine 400a were obtained from Cayman Chemical. For receptor signalling assessments, NT (Sigma, N6383) and PD149163 (Sigma, PZ0175) were maintained as 2 mM stock in 80% glycerol. SBI-553 and SR142948A (Sigma, SML0015) were maintained as 50 mM stocks in dimethyl sulfoxide (DMSO). SBI-0654553 analogues were synthesized using previously published methods3. Derivates were maintained as 50, 25 or 12.5 mM stocks in DMSO, as solubility permitted. For in vivo studies, SBI-553 and SBI-593 were freshly prepared from powdered stocks. When applicable, doses and concentrations were calculated from the formula weight of the compound salts and adjusted for fractional anhydrous base weight.
Recombinant DNA plasmids
The 3×HA-NTSR1 plasmid consists of N-terminal 3×HA-tagged WT human NTSR1 cloned into the pcDNA3.1(+) vector (Invitrogen, Thermo Fisher Scientific) at KpnI (5′) and XbaI (3′). This construct was purchased from the University of Missouri (cDNA Bank, NTSR10TN00). TRUPATH was a gift from B. Roth (Addgene kit 1000000163). The pcDNA3.1Zeo(−) vector was acquired from Invitrogen. The mVenus-β-arrestin 1 (human) and mVenus-β-arrestin 2 (human) plasmids consist of human β-arrestin 1 (cDNA Bank, ARRB100002) or human β-arrestin 2 (cDNA Bank, ARRB200001) cloned in frame, through restriction cloning, into a pcDNA3.1 plasmid that contained the mVenus sequence in the N-terminal position. The Gq–Rluc8 single-point mutants (corresponding Gq residues: V359Y, N357G, Y356C and L351N) were obtained by single-nucleotide mutagenesis using the QuikChange II XL kit (Agilent Technologies), following the manufacturer’s specifications. The mVenus-tagged mini-Go was generated by G-block synthesis of the reported mini-Go sequence55 and in-frame restriction cloning into the same backbone as the rest of the mini-G constructs. The 5 and 13 C-terminal substitutions in the TRUPATH Gα subunits were performed by oligonucleotide synthesis and annealing, followed by in-frame restriction cloning. Cloning of β-arrestin and G protein sensors was performed by the University of Minnesota Viral Vector and Cloning Core and validated through Sanger sequencing.
BRET2 G protein activation assays
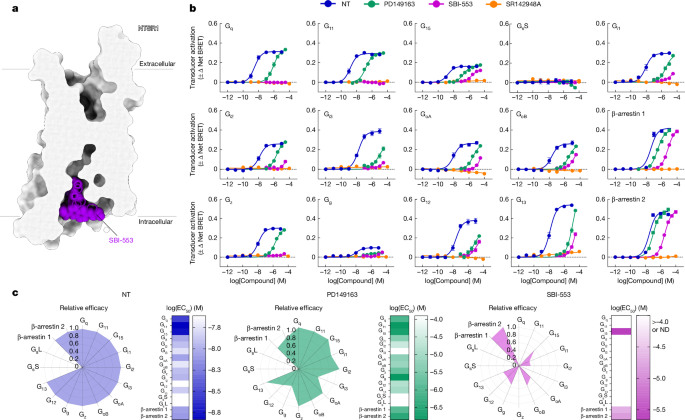
In the BRET2-based TRUPATH platform22, G protein activation results in a decrease in BRET between an Rluc8-tagged Gα and a GFP2-tagged Gγ protein. For visualization purposes, we plotted transformed (−Δ net BRET) data, such that G protein activation produces upward sloping curves. Curve height is a function of both the number of Gα–Gβγ complexes dissociating and the relative proximity of the Rluc8 and GFP2 tags. Because tag location differs among the Gα proteins and distinct γ subfamily members are used for each Gα protein, maximal changes in BRET are expected to differ among the Gα sensors. We retain the original BRET values on these curves to preserve information on sensor dynamic range. On day 1, HEK293T cells were plated in 6-well plates (750,000 per well) in DMEM containing 10% FBS and 1% 1× antibiotic antimycotic solution. On day 2, cells were transiently transfected with NTSR1 (200 ng per well), Gβ1 or Gβ3 (100 ng per well), GFP2-tagged Gγ9, Gγ8, Gγ13 or Gγ1 (100 ng per well) and the Gα of interest using a standard calcium phosphate transfection protocol, and the pairings of Gα, Gβ and Gγ subunits as described previously22 For mutant G proteins, the preferred βγ combination for the G protein base was maintained. A summary of βγ selections is provided in Supplementary Table 13. This produces a receptor:Gα:Gβ:Gγ ratio of 2:1:1:1. On day 3, cells were plated (25,000 cells per well) onto poly-d-lysine (PDK)-coated (100 ng ml−1), clear-bottom, white-walled 96-well plates in Opti-MEM containing 2% FBS and 1% 1× antibiotic antimycotic solution. On day 4, cells were incubated in 70 or 80 µl per well Hanks’ balanced salt solution (HBSS) containing calcium and magnesium and 20 mM HEPES for five to six hours before treatment. Cells receiving an SBI-553 or SR142948A pretreatment were incubated in 70 µl per well of HBSS containing 20 mM HEPES. Cells not receiving any pretreatment were incubated in 80 µl per well of HBSS plus 20 mM HEPES. SR142948A was freshly prepared in HBSS from a 50 mM DMSO stock. The 10× NT and PD149163 were freshly prepared in HBSS from 2 mM 80% glycerol (NTS, PD149163) stocks, and 10× SBI-553 was freshly prepared in HBSS with 5% 2-hydroxylpropyl-β-cyclodextrin (HP-β-CD, Tokyo Chemical Industry) from a 50 mM DMSO stock. For SAR studies, 10× SBI-553 and all derivatives were freshly prepared in 30% HP-β-CD from 50, 25 or 12.5 mM DMSO stocks. A white vinyl sticker was placed on the bottom of the plate. For room-temperature studies, plates were allowed to cool for 10 min until they reached approximately 25 °C. Ten microlitres of 10× SBI-553, SR142948A or SBI-553 derivative pretreatments were added during the 10-min cooling period, a total of 20 min before reading. For studies at 35 °C, treatments were incubated at temperature. Ten microlitres of 10× NTS, PD149163, SBI-553 or SR142948A treatments were added 10 min before reading. Ten microlitres per well of a 10× concentration of coelenterazine 400a (final concentration around 7.5 µM, Cayman Chemical) was added 5 min before reading. After treatment with coelenterazine 400a, plates were protected from light. Plates were read with a Tecan SparkCyto Microplate reader at room temperature (25 °C) or 35 °C in ambient air every 5 min for 20 min. BRET2 ratios were computed as the ratio of GFP2 emission to Rluc8 emission. The Δ net BRET ratio was calculated by subtracting the stimulated GFP2/Rluc8 ratios from control GFP2/Rluc8 ratios for each read. The minimum Δ net BRET ratio over time was averaged within treatments and combined between experiments. Data are presented as negative mean Δ net BRET ratio ± s.e.m. from at least three independent experiments.
BRET1 β-arrestin recruitment assays
Recruitment of mVenus-tagged human β-arrestin 1 and human β-arrestin 2 to Renilla luciferase (Rluc8)-tagged NTSR1 was assessed in HEK293T cells using a BRET assay, as described4. Previous studies evaluating NTSR1 β-arrestin agonism have used bovine or rodent β-arrestin constructs4,5. To assess recruitment of the human β-arrestins, the following procedure was used. On day 1, HEK293T cells were plated in 6-well plates (750,000 per well) in growth medium. On day 2, cells were transiently transfected with Rluc8-tagged NTSR1 (100 ng per well), Venus-tagged β-arrestin 2 or Venus-tagged β-arrestin 1 (1.4 µg per well), and pcDNA3.1 (1.5 µg per well) using a standard calcium phosphate transfection protocol. To maximize assay sensitivity, with the exception of the NT combination studies in Fig. 2, transfections also included 500 ng GRK2. On day 3, cells were plated onto PDK-coated (100 ng ml−1), clear-bottom, white-walled 96-well plates (40,000 cells per well) in Opti-MEM containing 2% FBS and 1× antibiotic antimycotic solution. On day 4, cells were incubated in 70 or 80 µl per well HBSS containing calcium and magnesium and 20 mM HEPES for five to six hours before treatment. Cells receiving an SBI-553 or SR142948A pretreatment were incubated in 70 µl per well of HBSS containing 20 mM HEPES. Cells not receiving a pretreatment were incubated in 80 µl per well of HBSS plus 20 mM HEPES. The 10× NT and PD149163 were freshly prepared in HBSS from 2 mM 80% glycerol (NT, PD149163) stocks, and 10× SBI-553 was freshly prepared in HBSS with 5% HP-β-CD from a 50 mM DMSO stock. For SAR studies, 10× SBI-553 and all derivatives were freshly prepared in 30% HP-β-CD from 50, 25 or 12.5 mM DMSO stocks. For compound combination studies, cells were pretreated with 10 µl of 10× SBI-553, SR142948A or vehicle pretreatments 15 min before reading. Ten microlitres per well of a 10× concentration of coelenterazine h (final concentration 4.7 µM; Cayman Chemical) was added 10 min before reading, followed by treatment with 10 µl of 10× NT 5 min before reading. Cells receiving no pretreatment received 10 µl of 10× NT, PD149163, SBI-553 and SR142948A treatments 10 min before reading and 10× coelenterazine h 5 min before reading. For experiments in Figs. 1 and 2, plates were maintained and read at room temperature. For the temperature studies, time-course studies and analogue screening and characterization in Extended Data Figs. 2, 3 and 6–8, plates were maintained at 35 °C during treatment and reading. A white vinyl sticker was placed on the bottom of each plate. Plates were read with a CLARIOstar Plus microplate reader (BMG Labtech) set at 25 °C or 35 °C at 10, 15, 20, 25, 30 and 35 min after treatment. BRET1 ratios were computed as the ratio of Venus emission to Rluc8 emission. The Δ net BRET ratio was calculated by subtracting the stimulated Venus/Rluc8 ratios from control Venus/Rluc8 ratios for each read. The maximum Δ net BRET ratio over time was averaged within treatments and combined between experiments. Data are presented as mean Δ net BRET ratio ± s.e.m. from at least three independent experiments.
TGFα shedding assays of G protein activation
TGFα shedding assays of G protein activation were performed as originally presented23, with previously described modifications4,56. These modifications included using G-protein-deficient (ΔGNAS, ΔGNAL, ΔGNAQ, ΔGNA11, ΔGNA12 and ΔGNA13) HEK293 cells54 and the fluorescent substrate 4-methylumbelliferyl phosphate (4-MUP), at a working concentration of 1 mM per well, instead of p-nitrophenyl phosphate (p-NPP). On day 1, G-protein-deficient HEK293 cells were plated in 6-well plates (750,000 per well) in growth medium. On day 2, expression vectors were transiently transfected in HEK293 cells using Lipofectamine 2000 (Invitrogen; 8 µl per well in a six-well plate). Expression vectors included 1.875 µg AP-TGFα, 750 ng HA-tagged NTSR1 and 350 ng of Gα protein. On day 3, transfected cells were detached with a brief rinse (1 ml, around 30 s) of phosphate-buffered saline (PBS) followed by 0.5 ml per well of 0.05% trypsin-EDTA (Gibco). The cell suspension was pelleted by centrifugation (200g, 5 min), followed by a resuspension in 3 ml HBSS containing 5 mM HEPES (pH 7.4) and a 10-min incubation at room temperature. Cells were again centrifuged (200g, 5 min) and resuspended in 4 ml HBSS containing 5 mM HEPES (pH 7.4). The resuspended cells were plated in 80 µl per well in a 96-well plate and placed in an incubator at 37 °C with 5% CO2. After a 30-min incubation, cells were treated with 10 µl vehicle (HBSS), 10× final concentrations of SR142948A or SBI compounds and incubated at 37 °C for 20 min. For preparation of 10× stocks, SBI compounds and SR142938A were diluted directly from 1–10 mM DMSO stocks into HBSS. The final concentration of DMSO did not exceed 0.4%. After a 20-min incubation with SBI compounds, cells were treated with 10 µl of 10× concentration of NT and incubated at 37 °C for one hour. For inhibition studies, 10 nM NT was used for the Gq, Gi1/2 and G12 constructs, and 100 nM was used for the Go construct; these concentrations were selected to elicit maximal NT-induced shedding. Plates were centrifuged (190g, 2 min) and conditioned medium (80 µl) was transferred into a new 96-well plate. After a 20-min incubation at room temperature, 2 mM 4-MUP-containing solution was added (80 µl per well) to both the conditioned medium and the cell plate. Alkaline phosphatase activity was measured using a CLARIOstar Plus microplate reader set to 25 °C. Data were collected before and after a one-hour incubation at 37 °C. Excitation was set at 360 nm (±10 nm) and emission at 450 nm (±15 nm). TGFα shedding activity was calculated by dividing the amount of phosphatase activity present in the conditioned medium by the amount present on the cells plus the conditioned medium. All values were standardized to background shedding activity.
Mini-G protein recruitment assays
Mini-G proteins have a truncated N terminus and contain a mutation that uncouples GPCR binding from nucleotide release, allowing them to form more stable associations with GPCRs than do unmodified G proteins25,55; these associations are amenable to monitoring by BRET. The recruitment of Venus-tagged mini-G proteins25 to Rluc8-tagged NTSR1 was assessed by BRET. Note that although mini-Go and mini-G12 were derived from their full-length versions, the mini-Gq and mini-Gi1 constructs were derived from the Gs backbone with substitution of the α5 helix25,55. To assess recruitment, on day 1, HEK293T cells were plated in 6-well plates (750,000 per well) in growth medium. On day 2, cells were transiently transfected with Rluc8-tagged NTSR1 (100 ng per well), a Venus-tagged mini-G protein and pcDNA3.1 (1.5 µg per well or 2.65 µg per well) using a standard calcium phosphate transfection protocol. Cells transfected with a Venus-tagged mini-Gq or mini-Gi1 received 250 ng per well. Cells transfected with a Venus-tagged mini-G12, mini-Gs or mini-Go received 1.5 µg per well. On day 3, cells were plated onto PDK-coated (100 ng ml−1), clear-bottom, white-walled 96-well plates (40,000 cells per well) in Opti-MEM containing 2% FBS and 1× antibiotic antimycotic solution. On day 4, cells were incubated in 70 or 80 µl per well HBSS containing calcium and magnesium and 20 mM HEPES for three to four hours before treatment. Cells receiving an SBI-553, PD149163 or SR142948A pretreatment were incubated in 70 µl per well of HBSS containing 20 mM HEPES. Cells not receiving any pretreatment were incubated in 80 µl per well of HBSS plus 20 mM HEPES. Cells were pretreated with 10 µl of 10× concentrations of SBI compounds, SR142948A, PD149163 or vehicle (5% or 30% HP-β-CD) 20 min before reading. Cells were then treated with vehicle (HBSS) or 100 nM NT 10 min before reading. Finally, cells were treated with 10 µl per well of a 10× concentration of coelenterazine h (final concentration 4.7 µM) 5 min before reading. Plates were read on a CLARIOstar Plus microplate reader set at 25 °C at 5, 10, 15 and 30 min after treatment. Mini-G protein recruitment was calculated by subtracting the stimulated Venus/Rluc8 ratios from control Venus/Rluc8 ratios for each read (Δ net BRET).
Western blot analysis
β-Arrestins 1 and 2 were detected by Western blot. On day 1, HEK293T and β-arrestin 1/2-null HEK293 cells were plated at 750,000 cells per well onto 6-well plates. On day 2, cells were lysed on ice in 2× sample buffer. Whole-cell lysates were sonicated and then analysed for expression of β-arrestins 1 and 2. Cell protein samples (10 μl) were resolved on 10% SDS–polyacrylamide gels (NuPAGE, Bis-Tris; Thermo Fisher Scientific) and transferred to nitrocellulose membranes (0.45 μm pore size; Thermo Fisher Scientific). The membrane was rinsed with Tris-buffered saline (TBS; Li-Cor Biosciences) and then stained with Ponceau S solution (Sigma-Aldrich, 6226-79-5) to visualize protein loading. Membranes were rinsed three times with 50% TBS containing 0.1% Tween-20 (v/v; TBST) and incubated in Odyssey Blocking Buffer for one hour at room temperature. Blocked membranes were incubated overnight at 4 °C with rabbit anti-β-arrestin 1/2 (Cell Signaling Technology, 4674, RRID: AB_10547883) in 50% blocking buffer and 50% TBST at a 1:1,000 dilution. Membranes were washed with TBST before and after incubation with infrared secondary antibodies Alexa Fluor goat anti-rabbit 680 (Invitrogen, A-21109, RRID: AB_2535758) at a 1:5,000 dilution for one hour at room temperature. Membranes were imaged on a LI-COR Biosciences Odyssey imaging system.
Optimization of the structure of the NT–NTSR1–SBI-553–Go
A complex for modelling
The cryo-electron microscopy (cryo-EM) structure of NTSR1 bound to SBI-553 and Go (PDB: 8FN0) was used at the starting point for modelling. Structure preparation was performed with Maestro (Schrödinger). VDW clashes were removed by constrained minimization using the OPLS4 force field. A full conformational analysis was performed with the conformational ensemble generated by MOE (Chemical Computing Group) and minimization using density functional theory calculations (Gaussian, ωb97XD/6-311+G** functional). The SBI-553 piperidine preferred a chair conformation over the twist boat by more than 3.1 kcal mol−1. As a result, the SBI-553 conformation from PDB: 8JPB was substituted into the model by rigid superposition of the two SBI-553 conformations followed by a second constrained minimization of the minor clashes resulting from this replacement. Molecular mechanics calculations (minimization and molecular dynamics) with multiple force fields orient the fluorine on SBI-553’s cyclopropyl group perpendicular to the quinazoline ring. To investigate this orientation, a rotational analysis was performed on SBI-553, SBI-342 and SBI-593 at 10° increments about the quinazoline–cyclopropane C–C bond with full minimization using ωb97XD/6-311+G**. For each molecule, there was a strong preference (2.5 to 3.2 kcal mol−1) for the conformation reported in a previous study5 in which the substituent on the cyclopropane (F for SBI-553, CH3 for SBI-342 and H for SBI-593) is in the plane of the quinazoline and pointed away from the appended piperidine. Subsequent protein minimizations and molecular dynamics simulations used explicit constraints to maintain desired small-molecule conformations.
G protein homology modelling
Homology models of each G protein were built with MOE (v.2022.02, Chemical Computing Group), with the conformation of each mutated side chain optimized individually using MOE’s Amber 10:EHT force field. Models of Gq conformations required building the NTSR1 H1/H2 loop absent in PDB: 8FN0. This loop is resolved in the PDB: 6OS9 structure, so the missing residues were concatenated onto PDB: 8FN0 using the homology model application in MOE. Minimization of the protein complexes containing SBI-342 and SBI-593 used the OPLS4 force field in Maestro (v.14.1.138, Schrödinger).
Molecular dynamics simulations
Molecular dynamics simulations with Gq and SBI-593 were done with Desmond using the Schrödinger suite (v.14.3.129 and v.13.7.125). Standard protein preparation included building the G87–E92 loop of mini-Gq. SBI-593 was superimposed onto SBI-553, and Gq was mapped onto Go from PDB: 8FN0. The conformation of each side chain of Gq-H5 was independently sampled and quaternary (NTSR1, Gq, NT and SBI-553) complex minimized. Where side chains interacted with each other, multiple side-chain combinations were assessed and their energies compared. The side-chain rotamers were well-sampled during the dynamics runs. Dynamics set-up included explicit water, manually placed 1-palmitoyl-2-oleoyl-sn-glycero-3-phosphocholine (POPC) membrane, 0.15 N NaCl and a constraint on cyclopropyl rotation. Six discrete simulations were performed (three 100 ns and three 300 ns) using the NPɣT ensemble, OPLS5 force field and TIP3P water model (300 K). Equilibration used a 100-ps NVT ensemble simulation with Brownian dynamics at 10 K, a 12-ps NVT ensemble simulation with a Langevin thermostat at 10 K, two constrained 12-ps NPT simulations using a Langevin thermostat and barostat at 1 atm at 10 K then 300 K, and a 24-ps NPɣT equilibration using a Langevin thermostat and barostat at 300 K and 1 atm. Membrane relaxation used a 1-ps Nose–Hoover chain thermostat and a 2-ps Martyna–Tobias–Klein barostat. Root mean square deviation (RMSD) was measured for the Cα carbons, and side-chain movement was monitored to ensure adequate sampling of conformational space. Once the complex stabilized to a consistent Cα RMSD, 20–25 frames from each run were selected from periods of the greatest RMSD stability. Each complex was minimized in Maestro, in which conformations, orientations and energies were compared.
Mice
All mouse studies were performed in accordance with the National Institutes of Health Guidelines for Animal Care and Use of Laboratory Animals and with approved animal protocols from the University of Minnesota University Animal Care and Use Committee. The mice studied included: C57BL/6J mice (Jackson Laboratory, 000664), global Ntsr1−/− mice (B6.129P2-Ntsr1tm1Dgen/J, Deltagen, Jackson Laboratory strain 005826), β-arrestin 2-knockout (Arrb2−/−) mice57 and their respective WT littermates. All mouse lines were backcrossed onto a C57BL/6J genetic background for at least ten generations before use. At the start of the study, all mice were adults. Mice were 8–20 weeks old, weighed 19–30 g, and were age-matched across experimental groups. Experiments included both male and female mice, and experimental groups were sex-matched. Ntsr1−/− and Arrb2−/− mice for experimental use were exclusively generated by Ntsr1+/− × Ntsr1+/− or Arrb2+/− × Arrb2+/− breeding, such that littermate WT mice could serve as controls. Littermates of the same sex and genotype were randomly assigned to experimental groups. Mice for systemic PD149163-induced hypothermia studies were group housed in conventional cages with Teklad irradiated corncob bedding (Inotiv) and Enviro-Dri nesting material (Fibercore) and maintained on a 14-h–10-h light–dark cycle. Mice for local NAc injection studies were singly housed after implantation of intracranial cannulas in conventional cages with Teklad irradiated corncob bedding (Inotiv) and Enviro-Dri nesting material (Fibercore), and maintained on a 14-h–10-h light–dark cycle. Experiments began at the start of the light cycle (within three hours of the light cycling beginning). Tap water and standard laboratory chow were supplied ad libitum, except during testing.
Assessments of core body temperature
Core body temperatures were measured using a rectal probe thermometer for mice (Thermalert Model TH-8, Physitemp Instruments), as described4. Core body temperatures were recorded from age-matched male and female Ntsr1−/− and WT mice before treatment (time 0) and 30, 60, 90, 120 and 300-min after treatment. Mice were gently restrained during the procedure and acclimated to this process during baselining. For single-compound dosing studies, baseline temperatures were recorded, and mice received either PD149163 (0.03–1 mg kg−1) or PD149163’s vehicle (physiological saline). All treatments were administered i.p. in a volume of 10 ml kg−1. For systemic multiple-compound dosing studies, mice received SBI-553 (12 mg kg−1, i.p.) or its vehicle (5% cyclodextrin) or SBI-593 (12 mg kg−1, i.p.) or its vehicle (20% DMSO, 5% Tween-80) before the start of the study (−45 min). After temperature recording at time 0, mice received PD149163 (0.15 mg kg−1) in volumes of 10 µl per kg i.p.
Intracranial cannulation and local NAc injections
Local NAc microinjections were accomplished after bilateral guide cannula placement in Ntsr1−/− mice and their WT littermates, C57BL/6J mice. Cannulas were acquired from Plastics One (bilateral guide: 2.0 mm spacing, 26G, 4 mm below pedestal; bilateral internal: 2.0 mm spacing, 33G, 0.5 mm projection; bilateral dummy: 2.0 mm spacing, 0.008”/0.2 mm, 0 mm projection). Bilateral guide cannulas were inserted into the NAc at +1.3 mm AP with 2.0-mm spacing (±1.0 mm mediolateral (ML)) and −4.5 mm dorsoventral (DV) and fixed to the skull with dental cement. Mice were singly housed after surgery and allowed to recover for at least seven days. After recovery, compounds were injected bilaterally using an automated syringe pump (Harvard Apparatus). SBI-553 (molecular weight 450 g mol−1) was dissolved in 1% (v/v) DMSO and 20% (v/v) HP-β-CD at 74.07 mM. One hundred micrograms of SBI-553 in 3 µl was injected per side at a rate of 0.2 µl per min. SBI-593 (molecular weight 458 g mol−1) was dissolved in 80% (v/v) N,N-dimethylacetamide, 10% (v/v) Tween-80 and 10% (v/v) UltraPure distilled water at 72.7 mM. One hundred micrograms of SBI-593 in 3 µl was injected per side at a rate of 0.2 µl per min. After local injection of SBI compounds, mice were placed in their home cages for one hour before intra-NAc administration of PD149163. PD149163 (molecular weight 943.91 g mol−1) was diluted from a stock concentration of 2 mM in 80% glycerol to 10 or 100 µM in separate SBI compound or vehicle preparations, and 18.9, 1.89 or 0.189 ng PD149163 in 0.2 µl was injected per side at a rate of 0.2 µl per min. The PD149163 dose used was 18.9 ng in the WT versus Ntsr1−/− experiments, 1.89 ng in the 100-µg SBI-553 experiments and 0.189 ng in the 10-µg SBI pretreatment experiments. The GRK2/3 inhibitor Compound 101 (Hello Bio) was diluted in vehicle (10% (v/v) DMSO and 20% (v/v) hydroxypropyl cyclodextrin) from a stock concentration of 20 mM in DMSO to 1.99 mM and 0.5 µg in 0.5 µl was injected per side at a rate of 0.4 µl per min one hour before the injection of 1.89 ng PD149163. This Compound 101 dose and preparation was previously shown to inhibit GRK2/3-mediated effects after intracranial delivery in mice57. After local injection of PD149163, body temperature was monitored every 30–60 min for 8 h. For all experiments, mice were randomly assigned to treatment groups for no more than two experiments, separated by a minimum of seven days. Cannula placements were verified by ink injection. After the experiment, 0.5 µl India ink (1:20 (v/v) saline) was injected at a flow rate of 0.5 µl per min to visualize the observed injection site. Injection sites were identified using anatomical makers and documented on a coronal mouse brain atlas53. Mice were anaesthetized with isoflurane and brains were collected one hour after ink microinjection. Brains were sliced in 250-µm sections using a vibratome (VT1000S, Leica).
Statistical analysis
All data are represented as mean ± s.e.m., unless otherwise indicated. Data were analysed and plotted using the software GraphPad Prism v.10.1.2. Information on curve fitting, statistical tests and n numbers are provided in Supplementary Tables 1–6. In Supplementary Tables 1–6, n represents the number of biological replicates. All data represent the average of at least three biological replicates from three independent experiments. Cell-based experiments included two or three technical replicates for every condition. A P value of less than 0.05 was accepted as statistically significant.
Figure illustrations
Method and concept figure illustrations were created using BioRender. Images of NTSR1 and G protein structures were created in ChimeraX (UCSF, v.1.6). Cannula placements are presented on Paxinos and Franklin’s ‘The Mouse Brain In Stereotaxic Coordinates’53.
Reporting summary
Further information on research design is available in the Nature Portfolio Reporting Summary linked to this article.
First Appeared on
Source link

