Directed evolution of phages in biofilms enhances Pseudomonas aeruginosa control through improved lipopolysaccharide recognition
Bacterial strains and culture conditions
The reference strain P. aeruginosa PAO1 (DSM22644) was obtained from the German Collection of Microorganisms and Cell Cultures. P. aeruginosa M800 is a clinical strain isolated from a Portuguese patient with CF lung infection. In addition, 45 P. aeruginosa clinical isolates and 4 PAO1 LPS isogenic mutants (University of Minho, Braga, Portugal), and 96 M800 variants isolated in this study, were also used, and are listed in Supplementary Table 3. Pure bacterial cultures were obtained by growth on lysogeny broth (LB) agar (LB with 1.2% (w/v) agar) for 16 h at 37 °C. Bacterial overnight cultures were grown in LB for 16 h at 37 °C. Bacterial lawns were prepared by adding 100 µL of overnight cultures to 3 mL of LB soft agar (LB with 0.6% (w/v) agar) and pouring on LB agar plates. Tryptic Soy Broth (TSB) 2× concentrated was used for sample enrichment in phage isolation. Saline solution (0.9% NaCl (w/v)) was used for bacterial dilutions, and saline-magnesium (SM) buffer (50 mM Tris–HCl pH 7.5, 100 mM NaCl, 8 mM MgSO4) was used for phage dilutions. SCFM2, used for selected biofilm experiments, was prepared as previously described51, except for mucin where UV sterilization was replaced with autoclaving prior to use52.
Phage isolation and production
Pseudomonas phage PE1 was isolated from a sewage sample collected in a wastewater treatment plant (Braga, Portugal), according to a previously described protocol53 and using P. aeruginosa PAO1 as the host for phage isolation.
For phage production, a single phage plaque was picked with a sterile tip, immersed in 500 µL of SM buffer for 10 min to release the phages, and all the volume was added to 50 mL of early-exponentially grown PAO1 (overnight culture diluted 1:100 in 50 mL of LB and incubated at 37 °C and 120 rpm until OD600 nm ≈ 0.3). After 6 h of incubation with agitation at 37 °C, the phage lysates were centrifuged (9000 × g, 4 °C, 10 min), filtered through a 0.22 µm filter, and stored at 4 °C.
Phage adaptation towards P. aeruginosa biofilms
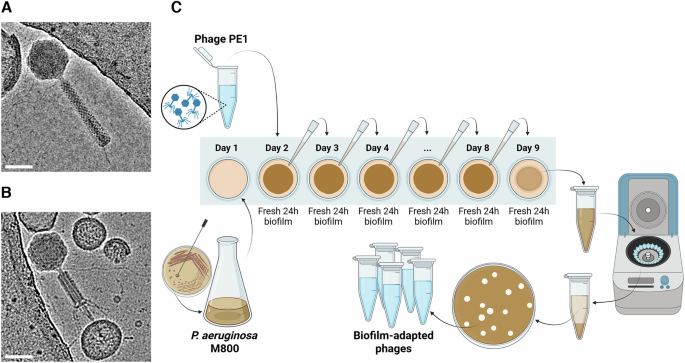
Adaptation of phage PE1 to P. aeruginosa M800 biofilms was performed over 8 days in biofilms grown in LB medium on 24-well plates. For biofilm formation, an overnight culture of P. aeruginosa M800 was diluted in LB (1:100) and 1 mL of this suspension was added to 24-well plates followed by incubation at 37 °C and 120 rpm for 24 h. After 24 h of biofilm formation (day 1), 600 μL of growth medium were removed from the wells and replaced with 100 μL of phage PE1 at 1 × 10⁶ PFU/mL (titer on M800 strain) and 500 μL of fresh LB medium and incubated for additional 24 h. At the same time, a new 24 h biofilm formation was initiated as described above. On day 2, 600 μL of growth medium were removed from the new 24 h old biofilm, replaced with 100 μL of growth medium recovered from the previously phage-treated biofilm (day 1) and 500 μL of fresh LB medium, and incubated for additional 24 h. Formation of a new biofilm was then initiated, and the same process was repeated every day, i.e. on each day a new P. aeruginosa M800 24 h old biofilm was treated for 24 h with phages recovered from the previously treated biofilm (Fig. 1C). On day 9, all the content of the well containing the final phage-treated biofilm was removed, centrifuged (9000 × g, 4 °C, 10 min), and the supernatant was used for a plaque assay to recover the biofilm-adapted phages. Briefly, serial dilutions of the supernatant were made in SM buffer, and 100 μL of each dilution was mixed with 100 μL of an overnight culture of P. aeruginosa M800 and 3 mL of LB soft agar and poured onto LB agar plates. After overnight incubation at 37 °C, 5 individual phage plaques were picked with a sterile toothpick, spread on P. aeruginosa M800 lawns using a paper strip, and incubated overnight, before production of 5 biofilm-adapted phages using PAO1, as described above.
Phage genome sequencing and analysis
Phage genomic DNA extraction was based on the established phenol/chloroform method54. Briefly, 1 mL of phage lysate was treated with 12.5 μL of MgCl2 (1 M), 1 μL DNAse I (10 mg/mL) and 1 μL RNAse A (100 mg/mL). After 1 h at room temperature, 40 μL EDTA (0.5 M), 5 μL of Proteinase K (10 mg/mL) and 50 μL of SDS (10 %) were added and the mixture was incubated overnight at 55 °C, before the addition of 1 volume of phenol-chloroform (1:1). The upper aqueous layer was recovered by centrifugation (13,000 × g, 4 °C, 10 min) and followed by a second centrifugation with 1 volume of chloroform. The aqueous layer was recovered, and the phage DNA was precipitated by adding 1 mL of EtOH (100% (v/v)) and 50 μL NaOAc (3 M) for 30 min on ice followed by centrifugation (14,000 × g, 4 °C, 15 min). The pellet containing the phage DNA was washed with 500 μL of EtOH (70% (v/v)), centrifuged (14,000 × g, 4 °C, 5 min), air-dried, resuspended in sterile deionized water, and stored at −20 °C.
For phage DNA sequencing, the library was constructed using the Illumina Nextera XT library preparation kit and sequenced (100 bp or 300 pb paired-end mode) using Illumina HiSeq platform (StabVida). Reads were automatically trimmed and assembled into a single contig using Geneious Prime 2023. Prediction of ORFs and initial homology-based predictions were performed using the BV-BRC tool55. For functional annotation, protein homology results were complemented using BLASTP21 and HMMER56, conserved domains and families were identified using InterPro57 and CDD58, transmembrane domains and signal peptide cleavage sites were identified by TMHMM59, Phobius60, SignalIP61 and TOPCONS62, and pairwise comparison of profile hidden Markov models (HMMs) was performed using HHpred63.
For phage taxonomic classification, comparative genomic analysis was performed with BLASTN64. Then, the genomes of all phages classified as species within the Pbunavirus genus, in the ICTV Virus Taxonomy 2022 Release, obtained from GenBank, were compared to the genome of phage PE1 using VIRIDIC65 and VICTOR66.
Sanger sequencing to confirm the phage mutations after biofilm-adaptation was performed by Eurofins Genomics (Germany) using primers 5′-GCAGTCGCCGATGCGTTG-3′, 5′-GCTACCATTTCCGTTGGTAACG-3′, and 5′-ACGTTCCATTCGCCGCAG-3′, for coding sequences 76, 77, and 78, respectively.
Determination of phage host range and efficiency of plating
The determination of phage host ranges was performed by spotting 10 µL drops of phages on bacterial lawns of the selected strains, following overnight incubation at 37 °C. When lytic zones were observed, phage solutions were serially diluted, plated on the respective bacterial lawns, and incubated overnight at 37 °C to calculate the number of Plaque Forming Units (PFUs). Efficiency of plating (EOP) was determined as the ratio of the raw phage titer on the selected strain and the raw phage titer on the host strain P. aeruginosa PAO1 (used for phage production).
Phage growth and adsorption assays
One-step growth curves and adsorption assays were performed on P. aeruginosa PAO1 as previously described67. Briefly, a bacterial overnight culture was diluted 1:100 in 10 mL of LB and grown until OD600 nm ≈ 0.3. After centrifugation (7000 × g, 4 °C, 5 min), the bacterial cells were resuspended in 5 mL of fresh LB medium and the phage solution diluted in 5 mL of LB medium was added to obtain a MOI of 0.01. This phage-bacteria solution was incubated for 5 min at 37 °C and 120 rpm for phage adsorption. After, the non-adsorbed phages were removed by centrifugation (7000 × g, 4 °C, 5 min), and the pellet was resuspended in 10 mL of fresh LB medium and incubated at 37 °C and 120 rpm. Samples (50 μL) were collected at 10-min intervals over a period of 70 min, serially diluted, and plated on P. aeruginosa PAO1 lawns to determine the phage titer (PFU/mL). Values of PFU/infected cell were calculated by the ratio between the phage titer in each time point and the phage titer at t = 0 min.
For the adsorption assays, the phage-bacteria solution prepared as described above was incubated at 37 °C and 120 rpm, after quantification of the total number of phages by serial dilutions and plating on PAO1 lawns. Samples (200 μL) were collected with 1 min interval up to 8 min after infection, immediately diluted in 200 μL of SM Buffer, and filtered through a 0.22 µm filter. The filtrates containing the unadsorbed phages were serially diluted and plated on P. aeruginosa PAO1 lawns to determine the titer of unadsorbed phage (PFU/mL). The percentage of unadsorbed phage was calculated through the ratio between the titer of unadsorbed phage in each time point and the titer of phage added to start the experiment.
Preparation of samples for cryo-TEM
Phage lysate (50 ml) was centrifuged in a 50.2 Ti rotor (Beckman Coulter) at 54,000 × g for 2.5 h at 10 °C (Optima XPN-80 Ultracentrifuge, Beckman Coulter). The pellet was resuspended in LB medium to the final phage concentration of 1011 PFU/ml (titer on PAO1). A sample of concentrated phage lysate (4 µl of 1011 PFU/mL) was applied onto a QuantifoilTM grid (2/1, Cu, mesh 200) glow-discharged in H/O plasma using a Gatan Solarus II. Grids were blotted (blotting force 0, blotting time 2 s, 100% humidity, wait time 5 s), plunge-frozen in liquid ethane using a Vitrobot Mark IV, and stored in liquid nitrogen.
For phage-bacterium interactions, overnight culture of P. aeruginosa PAO1 was diluted 1:100 (v/v) in fresh LB medium and incubated at 37 °C, 250 RPM to OD600 nm ≈ 0.3 (108 CFU/mL). At time 0, the phage lysate (1011 PFU/ml) was added to the culture at a multiplicity of infection of 500. The infected culture was incubated at 37 °C, 250 rpm. To increase the cell density and remove the non-adsorbed phages, the cells were pelleted at 5 min post infection (5000 × g, 1 min) and resuspended in fresh LB medium to reach OD600 nm ≈ 9. Samples for vitrification (4 μl) were taken at distinct time points over the course of infection, applied onto a QuantifoilTM grid (2/1, Cu, mesh 200) glow-discharged in H/O plasma using a Gatan Solarus II, plunge frozen in liquid ethane (blotting force 0, blotting time 2 s, 100% humidity, wait time 5 s), and stored in liquid nitrogen. The grids were imagined using Talos ArcticaTM electron microscope (Thermo Fisher Scientific) operated at 200 kV, equipped with a K2 Summit direct electron detector.
Prediction of phage PE1 wedge protein and tail fibre protein structures
The structures of selected phage PE1 proteins were predicted using AlphaFold2 multimer 2.1.268,69 accessed via the online platform provided by CERIT. For prediction, only structures available in databases (BFD, MGnify, PDB70, PDB, PDB seqres, Uniclust30, UniProt, UniRef90) before August 2023 were used. Confidence of the obtained structures was assessed through the predicted Local Distance Difference Test (pLDDT) score provided by AlphaFold2. UCSF Chimera X was used for structure visualization70.
Biofilm formation, treatment, and quantification in microtiter plates
Biofilm formation, treatment, and quantification in 24-well plates was performed according to previously described protocols for suspended (non-surface attached) biofilms71.
Briefly, for biofilm formation, an overnight culture of P. aeruginosa M800 was diluted 1:100 in LB or SCFM2 and 1 mL was transferred into each well of the 24-well plates. Blanks (containing only LB or SCFM2) were included in each experiment. The plates were incubated at 37 °C and 120 rpm for 24 h.
For biofilm treatment with phages, half of the growth medium in the 24-well plates was replaced with fresh LB or SCFM2 medium and phages at a concentration of 1 × 10⁷ PFU/mL. Untreated controls (containing only bacteria) were included in each experiment. Plates were incubated for additional 24 h, at 37 °C and 120 rpm.
After 24 h treatment with phages, the biofilms on the 24-well plates were photographed and imaged using an EVOS FL Auto Imaging System (Life Technologies) with the 2× objective. For the experiments with LB medium, all the content of each well was then transferred into 2 mL screw cap empty tubes and the biofilms were homogenized in a Bead Ruptor 24 Elite homogeneizer (Omni International) for 1 min at 3 m/s. For the experiments with SCFM2, the biofilms were disrupted by sonication at 40 kHz for 5 min (Hei-MIX Titramax 100/101/1000, Heidolph Instruments, Schwabach, Germany) and shaking at 900 rpm for 5 min (Branson 3510, Branson Ultrasonics, Danbury, USA). After biofilm homogenization, the content of the tubes (LB) and wells (SCFM2) was used to perform serial dilutions in saline solution, followed by plating on LB agar plates to determine the number of colony forming units (CFU) after overnight incubation at 37 °C.
Host cell infection, treatment, and bacterial quantification in the three-dimensional lung epithelial cell culture model
The previously established three-dimensional (3-D) lung epithelial cell culture model was generated by culturing the human adenocarcinomic alveolar epithelial cell line A549 (ATCC CCL185) on collagen I-coated microcarrier beads (Cytodex-3 microcarrier beads, Sigma-Aldrich) in a rotating wall vessel (RWV) bioreactor, as previously described20,72. Cells were cultured at 37 °C under static 5% CO2 conditions, in GTSF-2 medium (HyClone, Logan, UT, US) supplemented with 1.5 g/L sodium bicarbonate (Sigma-Aldrich), 10% fetal bovine serum (FBS) (Life Technologies, Carlsbad, CA, US) and 2.5 mg/L insulin transferrin sodium selenite (Lonza, Basel, Switzerland). After 11-14 days of incubation, the culture medium of the 3-D cells was replaced with GTSF-2 without FBS, and 250 μL of the aggregates per well containing 2.5 × 10⁵ cells were transferred to 48-well plates.
For infection of the host cells, an overnight culture of P. aeruginosa M800 was resuspended in GTSF-2 without FBS and added to the 3-D lung cells in the 48-well plates at a concentration of 2.5 × 10⁶ CFU/well (targeted MOI of 10). Plates were incubated for 2 h, at 37 °C under static 5% CO2 conditions.
For treatment with phages, half of the growth medium in the 48-well plates was replaced with fresh GTSF-2 medium without FBS and phages at a concentration of 1 × 10⁷ PFU/mL. Plates were incubated for an additional 4 h, at 37 °C under static 5% CO2 conditions.
To assess the effect of phage treatment on the bacteria associated with the 3-D lung epithelial cells, the entire content of each well was transferred into new 48-well plates, to avoid inclusion of bacteria possibly attached to the wells, and the growth medium was carefully removed. The number of host-associated culturable bacteria was determined as previously described20. Briefly, the cells were washed twice with HBSS (Life Technologies) and vigorously pipetted with 1% Triton X-100 (Sigma-Aldrich) to disrupt the biofilms and lyse the epithelial cells. The number of bacteria in the lysate was quantified by serial dilutions in saline solution and plating in LB medium for CFU counts.
Viability of the epithelial cells was determined using the intracellular lactate dehydrogenase (LDH) assay, as previously described73, to avoid interference of P. aeruginosa with the read-out. Epithelial cell lysates prepared as described above were centrifuged (3700 rpm, 15 min) and the supernatant was used to measure the LDH activity using the LDH detection kit (Sigma-Aldrich) following the manufacturer’s protocol. Cell viability was expressed as a percentage from an uninfected control (without bacteria and phages), processed with HBSS, 1% Triton X-100, vigorous pipetting, and centrifugation, as described above for the other samples.
LPS extraction and silver staining
LPS extraction was based on a previously described protocol74 adapted from75. Briefly, bacterial colonies grown on LB agar were suspended in 1 ml of saline solution. After centrifugation at 10,000 × g for 30 s, the cells were resuspended in 1 ml saline solution, centrifuged again and resuspended in 50 μL of lysis buffer containing 2% w/v SDS, 4% v/v 2-mercaptoethanol, 10% v/v glycerol, 1 M Tris-HCl (pH 6.8) and bromophenol blue. After incubation at 95 °C for 10 min, the cells were allowed to cool down to room temperature, and 10 μL of 2.5 mg/mL Proteinase K was added (freshly prepared by dilution of a 10 mg/mL Proteinase K stock solution with the lysis buffer). After incubation at 56 °C for 1 h, 5 μL samples were loaded on SDS polyacrylamide gels with 4% and 12.5% acrylamide in the stacking and separating gels, respectively. The gels were run at 20 mA in Tris-glycine-SDS buffer.
LPS visualization in the gels was performed according to a previously described silver staining protocol76. Briefly, after overnight fixation in 200 mL of fixation solution (40% v/v ethanol, 5% v/v acetic acid), the gel was incubated for 5 min at 40 rpm in 200 mL of fixer-oxidizer solution (0.7% w/v periodic acid, 40% v/v ethanol, 5% v/v acetic acid). After 3 washes at 40 rpm in 500 mL of MilliQ DI water in a second dish (15 min each wash), the gels were stained for 10 min at 70 rpm with 150 mL of freshly prepared staining solution (28 mL of 0.1 M NaOH, 2 mL of concentrated ammonium hydroxide, 5 mL of 20% w/v silver nitrate, and 115 mL of MilliQ DI water). After 3 washes performed for 10 min each one, as previously described, the gels were developed at 40 rpm in 200 mL of developer solution (50 mg of citric acid, 0.5 mL of 37% formaldehyde, and MilliQ DI water up to 1 L). When completely stained, the gels were washed and stored in distilled water.
Bacterial genomes sequencing and analysis
DNA from the M800 strain and the biofilm-isolated colonies (Supplementary Table 3) was extracted from overnight grown bacteria on LB agar using the Quick-DNA Fungal/Bacterial Kit (Zymo Research).
Libraries were produced following the Hackflex protocol77 and pooled libraries were sequenced on an Illumina NovoSeq 6000 Instrument generating 150 base paired-end sequencing reads. Resulting rawreads were processed with bbduk (bbmap = v38.93) and assembled using shovill (v1.1.0). Whole genome sequences were uploaded to NCBI and are available under BioProject ID PRJNA1266112. Pairwise SNP comparison for tree generation was done using snippy (v4.6.0) and visualized with the R package ggtree.
Statistical analysis
Statistical analysis was performed using GraphPad Prism version 10.5.0. Data comparisons were performed using ordinary one-way analysis of variance (ANOVA) followed by Tukey’s post-hoc tests. Differences were considered statistically significant if p was less than 0.05, and significant p values were indicated in the graphs.
Reporting summary
Further information on research design is available in the Nature Portfolio Reporting Summary linked to this article.
First Appeared on
Source link

