ER remodelling is a feature of ageing and depends on ER-phagy
In vivo imaging of ER dynamics in adult C. elegans
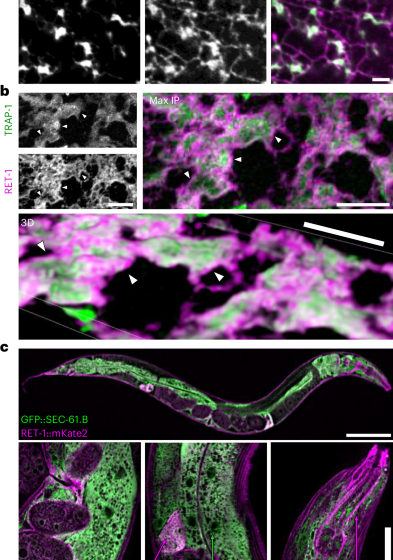
Many ER proteins are enriched in specific structural and functional subdomains20,28,36. To study ER dynamics during ageing, we developed transgenic C. elegans strains with labels capable of distinguishing rough or tubular ER. SEC-61.B is an essential component of the ER translocon enriched in rough ER sheets28. Genomic green fluorescent protein (GFP) fusion produced a native marker, GFP::SEC-61.B, with enrichment in rough ER and relative exclusion from established smooth ER subdomains, such as muscle sarcoplasmic reticulum (Extended Data Fig. 1a). Importantly, the use of native markers circumvents the loss of subdomain fidelity associated with overexpressed and/or heterologous markers28,37 (Extended Data Fig. 1b). To visualize tubular ER subdomains, we inserted mKate2 at the carboxy terminus of the sole C. elegans reticulon RET-1. Among the most highly enriched smooth ER proteins20, reticulons are conserved hairpin-domain proteins that stabilize membrane curvature in ER tubules and sheet edges29. Super-resolution imaging of these endogenous GFP::SEC-61.B and RET-1::mKate2 proteins revealed canonical SEC-61.B-enriched rough ER sheets linked by a RET-1-enriched network of tubules (Fig. 1a). To further validate the labelling, we swapped fluorophores on RET-1 from mKate2 to GFP and combined this with an alternative translocon subunit38, TRAP-1::mCherry. Super-resolution imaging of trap-1::mCherry; ret-1::GFP animals revealed sheet structures bearing distinct enrichment of RET-1 on tubules and sheet edges, with TRAP-1 concentrated on the sheet faces (Fig. 1b). When co-labelled, SEC-61.B and TRAP-1 exhibited strong co-localization (Extended Data Fig. 1c,d).
a, Super-resolution image of a cortical region of the C. elegans hypodermis demonstrating expected subdomain enrichment of the ER reporters RET-1::mKate2 (ER tubules and sheet edges) and GFP::SEC-61.B (patches of ER sheets). Images are representative of seven animals from three independent experiments. Scale bar, 2 µm. b, Confocal imaging of the ER marked by RET-1::GFP (ER tubules and sheet edges) and TRAP-1::mCherry (rough ER) in C. elegans hypodermis. The merged images represent maximum intensity (top right; max IP) and 3D (bottom) projections. Arrowheads indicate RET-1::GFP enriched on the edges of TRAP-1-labelled rough ER sheets. Images are representative of 50 animals from three independent experiments. Scale bars, 5 µm. c, Confocal imaging of GFP::SEC-61.B and RET-1::mKate2 depicting differential enrichment of ER subdomain markers between tissues. Images are representative of 100 animals from three independent experiments. Scale bars, 100 µm (top) and 10 µm (bottom).
Interestingly, the relative abundance of SEC-61.B or RET-1 labelling in different tissues also reflected expected rough or smooth ER specialization (Fig. 1c). Enrichment of smooth ER tubules, observed as high levels of RET-1, was noted in neuronal projections, muscle sarcoplasmic reticulum and the smooth muscle-like spermathecae, whereas the hypodermis and intestine, which execute robust collagen and lipoprotein secretion, were highly enriched for SEC-61.B-labelled rough ER36 (Fig. 1c). Together, these results provide support for native labelling of these ER proteins as a reliable platform for monitoring ER subdomain dynamics in vivo across tissues in C. elegans.
Ageing is associated with declines in total ER mass and remodelling of ER-structure function
To investigate whether ER morphology is dynamic across lifespan, we focused first on the hypodermis, a thin and metabolically flexible cell type well-suited for visualizing fine ER structures in vivo. In young adults, SEC-61.B marked a dense network of cisternal structures extending throughout the cell, with relatively few resolvable RET-1-enriched tubules (Fig. 2a). We then aged animals to day 7 of adulthood, a stage coinciding with the onset of age-dependent functional decline. Consistent with previous descriptions of ageing and progeria models39,40, the SEC-61.B-marked nuclear envelope developed deep invaginations and other structural distortions at this age (Fig. 2a). However, the peripheral ER network was also markedly remodelled (Fig. 2a–c), despite being relatively unexplored in ageing contexts. Chief among the changes was a striking decline in the total amount of ER but the morphology was also altered, with SEC-61.B localizing to small sporadic clusters connected by a largely tubular network (Fig. 2a–c).
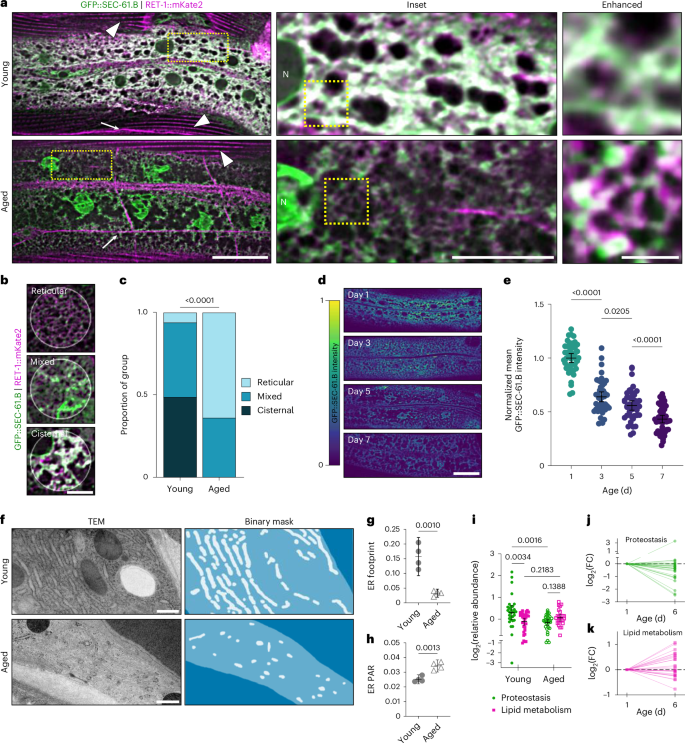
a, Fluorescence imaging of GFP::SEC-61.B; RET-1::mKate2 in young (day 1; top) and aged (day 7; bottom) adults. Arrows and arrowheads indicate smooth ER subdomains of neuronal projections and muscle sarcoplasmic reticulum, respectively. Insets: magnified views of the boxed regions depicting hypodermal ER network. Scale bars, 25 µm (left), 10 µm (middle) and 2.5 µm (right). N, nucleus. b,c, Representative examples of ER morphology (b) and categorical morphologic analysis (c) of n = 123 regions from 42 young worms and 120 regions from 44 aged worms, pooled from two independent experiments. b, Scale bar, 5 µm. c, Analysed using a one-tailed χ2 test. d,e, Representative images (d) and quantification of time course imaging of hypodermal GFP::SEC-61.B (e) in day 1, 3, 5 and 7 adults. d, Scale bar, 10 µm. e, Analysed using a one-way analysis of variance (ANOVA), followed by a two-tailed Šidák post-hoc test; n = 45 worms per age, pooled from three replicates. f, TEM images (left) and binary masks (right) of the ER (white) in the hypodermis (lighter blue) of young (top) and aged (bottom) worms. Scale bars, 500 nm. g,h, Hypodermal ER footprint (g) and PAR (h). Analysed using a two-tailed Student’s t-test; n = 4 worms per group. i–k, The ER proteome in young (day 1) and aged (day 6) worms reveals relative fold change (FC) shifts in functional subdomain composition during ageing. Data points represent the relative abundance of a specific protein within each functional category (proteostasis, n = 31 proteins in both groups; lipid metabolism, n = 32 proteins in young worms and 26 proteins in aged worms). Analysed using a restricted maximum-likelihood mixed-effects model, followed by a post-hoc two-tailed, uncorrected Fisher’s least-significant-difference test. j,k, Age-dependent trajectories were normalized to abundance in young animals. c,e,g–i, P values are shown. Error bars indicate the mean ± 95% confidence interval (CI). Source numerical data are provided.
To quantify these changes and avoid co-expression artifacts, we imaged single-tagged GFP::SEC-61.B and RET-1::GFP animals individually (Extended Data Fig. 2a–h). Both markers showed substantial declines in intensity (approximately 70%) and footprint, or area of the cell occupied by the ER (25–30%), alongside a twofold increase in the perimeter-area ratio (PAR; Extended Data Fig. 2c–h). These findings indicate reduced organelle volume and content with age combined with a shift towards a more tubular network. We confirmed these trends independently of fluorescence imaging using epitope tags and immunoblotting in whole-animal lysates (Extended Data Fig. 2i–l). Interestingly, these blots revealed a more pronounced decline in RET-1 levels across the organism than for SEC-61.B. This result probably reflects certain tissue-specific contributions to the overall protein levels in whole-animal lysates (compare RET-1 and SEC-61.B levels in the intestine, discussed in the next section) but the low levels of RET-1 still raised the question of how a largely tubular network would be supported by tubule-promoting proteins in aged animals. We thus tested the complementary ER tubulating factor in C. elegans, YOP-1 (ref. 41). In contrast to RET-1, the levels of YOP-1 remained largely stable (Extended Data Fig. 2m,n), indicating potential compensation between tubulating factors. Finally, we investigated whether luminal, widely distributed ER proteins also exhibit similar age-dynamics. The GRP78 (also known as BiP) orthologues HSP-3::mScarlet and HSP-4::mScarlet exhibited similar expression and localization trends with age (Extended Data Fig. 3a–d). On the other hand, the levels of the mitochondrial outer membrane marker TOMM-20::mCherry remained stable, demonstrating the specificity of this dynamic to the ER (Extended Data Fig. 3e,f). Collectively these results provide support for a major decline in ER mass while highlighting that individual ER-shaping factors are differentially impacted by ageing.
Next, we tracked the kinetics and ultrastructural impacts of ER remodelling. Daily imaging of GFP::SEC-61.B animals revealed a 36% decline in intensity over the first three days of adulthood, revealing ER remodelling to be an early stage transition (Fig. 2d,e). We also imaged the ER in ageing wild-type animals via transmission electron microscopy (TEM). Consistent with fluorescence imaging, young animals exhibited densely packed stacks of rough ER sheets that gave way to sparse tubular networks in the hypodermis with a reduced footprint and increased PAR (Fig. 2f–h and Extended Data Fig. 4a–d).
These age-dependent morphological changes may correspond to functional shifts from proteostasis of the rough ER sheets to those that are more tubule-associated, such as lipid metabolism2. Notably, this potential transition would be consistent with widely reported declines in global protein synthesis with age17,42. To explore this model, we mined recent proteomic datasets examining the age-dependent proteome of C. elegans across tissues43. We identified ER-resident proteins associated with either proteostasis or lipid metabolism and compared their levels in young and aged animals (Fig. 2i–k and Supplementary Table 1). Although the proteostasis network of the ER undergoes broadscale decline, mirroring the loss of rough ER (Fig. 2i,j), proteins involved in lipid metabolism generally stayed consistent with roughly half increasing with age (Fig. 2i,k). We conclude that ER morphological shifts mirror a functional shift from proteostasis to lipid metabolism based on the declines in total ER abundance and shift in ER-structure function from tightly packed stacks of rough ER cisternae towards diffuse tubular networks.
Age-dependent ER remodelling occurs across distinct tissue types
We also aimed to determine which age-dependent changes in the ER network might be generalizable across cell types. Consistent with the secretory functions of the intestine, intestinal cells possess dense, rough ER networks36 (Fig. 1c). Similar to the hypodermis, the intestine experienced dramatic loss of SEC-61.B at the protein level, reduction in ER footprint and an increase in PAR (Fig. 3a–d). Both the loss of ER mass and sheet-like structures was supported by TEM imaging (Extended Data Fig. 4e,f). Furthermore, we found that male worms exhibited similar age-dependent declines in SEC-61.B intensity, footprint and morphology in both the hypodermis (Fig. 3m–p) and intestine (Extended Data Fig. 5a–d), revealing that ER loss is independent of egg production44. Finally, muscle cells (Fig. 3e–h) and neurons (Fig. 3i–l) also exhibited declines in SEC-61.B intensity, ER footprint and shifts in ER morphology, as measured in the muscle belly and soma, respectively. These results reveal that ER remodelling occurs across most major tissue types in C. elegans.
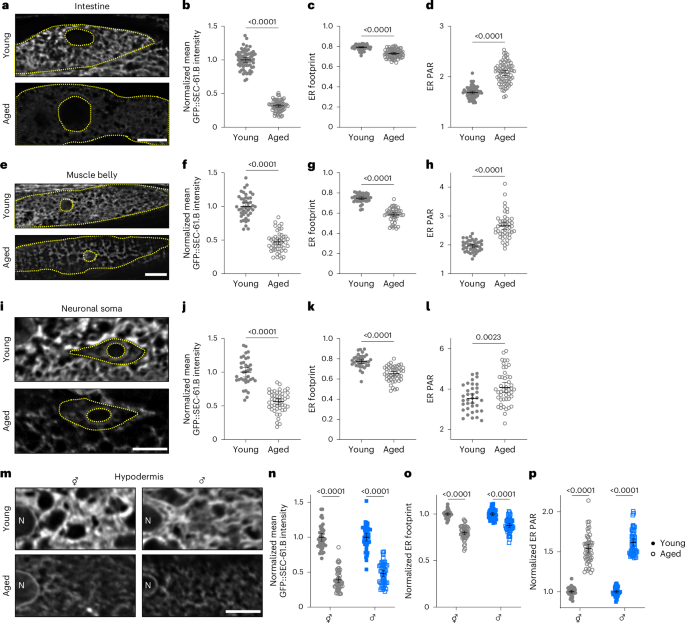
a, Imaging of intestinal GFP::SEC-61.B in young (top) and aged (bottom) worms. b–d, Normalized mean intensity (b), footprint (c) and PAR (d) of intestinal GFP::SEC-61.B in young and aged worms; n = 64 young and 70 aged worms pooled from three replicates. e, Imaging of GFP::SEC-61.B in the body-wall muscle belly of young (top) and aged (bottom) worms. f–h, Normalized mean intensity (f), footprint (g) and PAR (h) in muscle of young and aged GFP::SEC-61.B worms; n = 44 young and 47 aged worms pooled from three replicates. i, Imaging of GFP::SEC-61.B in the soma of the ALM neuron of young (top) and aged (bottom) worms. j–l, Normalized mean intensity (j), footprint (k) and PAR (l) of GFP::SEC-61.B in the ALM soma of young and aged worms; n = 35 young and 46 aged worms pooled from three replicates. m, Imaging of hypodermal GFP::SEC-61.B in young (top) and aged (bottom) hermaphrodite (⚥; left) and male (♂; right) worms. N, nucleus. n–p, Mean intensity (n), footprint (o) and PAR (p) of hypodermal GFP::SEC-61.B in young and aged worms, normalized within each sex to day 1. Hermaphrodites, n = 41 young and 50 aged worms; males, n = 43 young and 49 aged worms; pooled from three replicates. a,e,i, Dotted yellow lines demarcate the cell membrane and nuclear envelope. a,e,i,m, Scale bars, 10 µm. b–d,f–h,j–l,n–p, Analysed using a two-tailed Student’s t-test; P values are shown. Error bars indicate the mean ± 95% CI. Source numerical data are provided.
Although aspects of age-dependent ER dynamics seem to be generalizable across many cell types, we also observed tissue-specific changes. For example, RET-1::GFP labels the young intestinal ER but is virtually undetectable in aged intestine (Extended Data Fig. 5e,f), exhibiting a more pronounced decline than SEC-61.B in this tissue. This near-complete loss of RET-1 in the intestine probably explains why the RET-1 western blots measured from whole animals decline more sharply than SEC-61.B (Extended Data Fig. 2). In addition, muscle cells and neurons each harbour specialized smooth ER subdomains within anatomically distinct regions of the cell: the myofilament lattice and neurites, respectively36,45. Providing support for a model where rough ER subdomains are preferentially lost during ageing, these exclusively smooth ER subdomains seem to be resistant to age-related ER declines, with an approximate 15% decline in RET-1::GFP intensity and 8% decline in sarcoplasmic-reticulum footprint (Extended Data Fig. 5g–i) compared with declines of approximately 55% and 22% in the ER of the muscle belly (Fig. 3e–h). Contrasting every other tissue, neurite ER exhibits notable increases in RET-1 levels during ageing (Extended Data Fig. 5j–l). We observed an approximately twofold increase in RET-1::wrmScarlet intensity with age in representative sensory (ALN and PLM) and motor (DA7) neurons, whereas the cytosolic GFP levels remained static, indicating that the increases in RET-1 are independent of broadscale neuronal changes (Extended Data Fig. 5k,l).
Collectively, these results highlight that age-dependent ER remodelling is a ubiquitous phenomenon in C. elegans but can take distinct forms depending on the tissue. Although a decline in ER volume is the most generalizable effect, notable exceptions such as neurites exist. Furthermore, multiple major metabolic tissues exhibit structural changes consistent with preferential turnover of rough ER and associated sheet-like morphologies during ageing.
Age-dependent ER remodelling is conserved from yeast to mammals
We next set out to determine whether age-onset remodelling of ER is evolutionarily conserved by examining eukaryotes ranging from yeast to mammals. First, the Tabula Muris Senis project46,47 recently performed RNA sequencing analysis of diverse mouse tissues and revealed tissue-specific and animal-wide gene expression trajectories at the messenger RNA level. When gene expression changes were averaged across tissues to identify universal ageing signatures, one of the most strongly downregulated clusters was enriched for genes functioning in ‘protein processing in the ER’ (KEGG mmu0414; Fig. 4a).
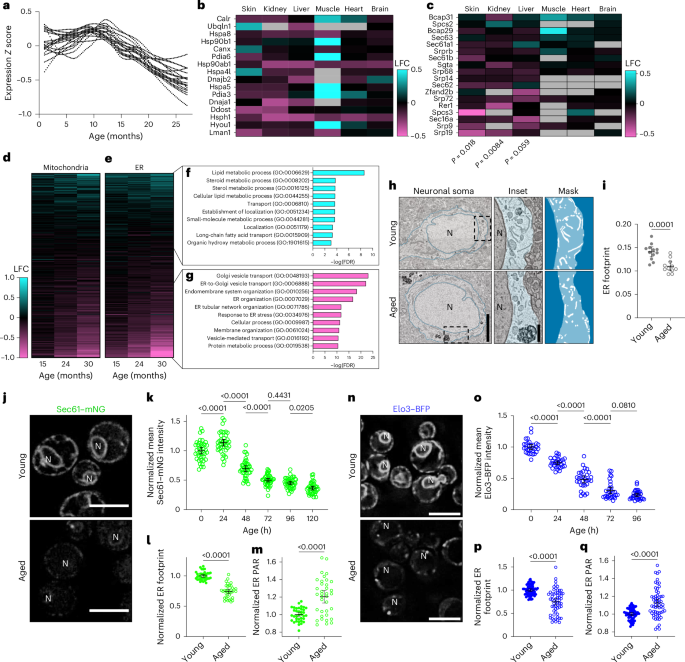
a, Protein processing in the ER. Age-trajectories of individual transcripts with roles in ER protein processing averaged across all tissues. b,c, Log2-transformed fold change (LFC) in protein levels for ER protein processing (b) and protein localization (c) in ER proteins in aged (30 months) versus young (6 months) mice. Analysis of ER protein localization was performed using the Fisher’s exact test. d,e, Fold change in every protein localized to mitochondria (d) and the ER (e) in mice of different ages. f,g, Top ten enriched gene categories among ER proteins that were up- (f) or downregulated (g) in the skin with age. h, Representative scanning electron microscopy images of L2 motor cortex neurons in young (6 months; top) and aged (18 months; bottom) male mice. Magnified views (middle) and binary masks of ER (right; white) of the boxed regions are provided. Scale bars, 2.5 µm (left) and 500 nm (right). i, ER footprint in murine cortical motor neurons. Analysed using a two-tailed Student’s t-test; n = 12 young and 11 aged cells. j, Imaging of Sec61–mNeonGreen (mNG) during chronological ageing in young (0 h; top) and aged (72 h; bottom) yeast cells. Scale bars, 5 µm. k, Sec61–mNG intensity during chronological ageing in yeast. Analysed using a one-way ANOVA, followed by a two-tailed post-hoc Šidák test; n = 40 cells per group, pooled from four replicates. l,m, Normalized ER footprint (l) and PAR (m) in young and aged yeast cells. Analysed using a two-tailed Student’s t-test; P values are shown; n = 36 cells per group, pooled from three replicates. n, Imaging of Elo3–blue fluorescent protein (BFP) during chronological ageing in young (top) and aged (bottom) yeast cells. Scale bars, 5 µm. o, Elo3–BFP intensity during chronological ageing in yeast. Analysed using a one-way ANOVA, followed by a two-tailed post-hoc Šidák test; n = 30 cells per group, pooled from three replicates. p,q, Normalized ER footprint (p) and PAR (q) in young and aged yeast cells. Analysed using a two-tailed Student’s t-test; n = 60 cells per group, pooled from replicates. i,k–m,o–p, P values are shown. Error bars indicate the mean ± 95% CI. N, nucleus. Source numerical data are provided.
Furthermore, a parallel atlas of proteomic changes across several mouse tissues during ageing enabled us to determine whether these mRNA trajectories correspond with protein-level remodelling48. To mine this dataset of samples taken from whole-tissue lysates, we extracted data from the same set of genes involved in ER protein processing identified by Schaum and colleagues46, comparing young (6 months) and aged (30 months) animals. We found consistent downregulation of these genes at the protein level in multiple mouse tissues, most notably skin, liver and kidney (Fig. 4b). Unbiased gene ontology enrichment analysis of these complete proteomic datasets additionally revealed another signature of rough ER remodelling focused on the translocon and protein targeting to the ER, again revealing the strongest and most consistent downregulation in skin, liver and kidney (Fig. 4c). Given that mitochondrial dysfunction is an established hallmark of ageing, we next extracted genes annotated for localization to either the mitochondria or ER to compare the scope and magnitude of changes, focusing on the skin, which showed the most consistent downregulation of ER translocon factors. The mitochondrial and ER proteomes both exhibited substantial progressive alterations relative to the complete cellular proteome (P = 3.21 × 10⁻⁷ and 9.11 × 10⁻⁸, respectively) and the downregulation in each case was similar in scope and magnitude (47% ER proteins downregulated versus 45% of mitochondrial proteins with false detection rate (FDR) < 0.05; Fig. 4d,e). On examination of the categories of proteins that are either down- or upregulated in the ER, we again found notable similarities to C. elegans. The downregulated proteins were enriched for functions in secretion, protein metabolism and ER organization, whereas the smaller group of upregulated genes were enriched for roles in lipid metabolism (Fig. 4f,g). Although the proteomes of the liver and kidney revealed smaller-scale downregulation of the ER proteome, the downregulated proteins were similarly enriched for roles in secretion (Extended Data Fig. 5m,n). Intriguingly, ER proteins with roles in autophagy were consistently upregulated in these tissues (Extended Data Fig. 5m,n). Overall, these results uncover the downregulation of rough ER-associated protein synthesis and secretion as a widespread aspect of the ageing process in mammals.
Finally, we aimed to visualize ER network changes with age in other species. Early neuropathological studies previously suggested that outstanding characteristics of the ageing rodent brain include a decrease in ribosomes and progressive ‘disorganization’ of ER cisternae in neurons49,50, leading us to investigate neurons in mouse brain sections by scanning electron microscopy. We examined cortical neurons of three- and 18-month-old mice, and confirmed statistically significant declines in ER volume with age, even at this relatively early stage of ageing (Fig. 4h,i). Surprisingly, we did not consistently identify stereotypical stacked cisternae even in young animals and thus, were unable to confirm previous observations of cisternal disorganization at this particular age (PAR unchanged, P = 0.71). Finally, we also examined the ER of chronologically aged yeast cells using fluorescence microscopy. We labelled distinct ER proteins known to localize broadly across ER subdomains, Sec61 and Elo3. Both exhibited early and striking declines in intensity and footprint (Fig. 4j–q), overall mirroring findings in C. elegans, although ultrastructural analysis of the uniquely organized yeast ER requires further study. Together, these results demonstrate that functional and structural ER remodelling during ageing is a conserved phenomenon, however, extrapolation across diverse mammalian types necessitates deeper dedicated analyses.
ER-phagy drives age-onset ER remodelling
Next, we set out to identify mechanisms promoting ER remodelling during ageing. Given the pronounced loss of both ER protein and membrane mass during ageing, we reasoned that autophagic and/or lysosomal degradation processes may be involved. Current models suggest that multiple distinct pathways act in concert to deliver ER components to lysosomes: (1) macro-ER-phagy, which requires both canonical autophagy initiation factors like ULK1/Atg1/unc-51 and LC3/GABARAP/Atg8 lipidation; (2) micro-ER-phagy, independent of both ULK1 and Atg8; (3) RecovER-phagy, a micro-ER-phagy variant that utilizes Atg8 and (4) vesicular ER-to-lysosome pathways, which also generally depend on Atg8 lipidation31,32. To help distinguish between these routes, we fed animals double-stranded RNA (dsRNA) targeting either Atg1/unc-51 or Atg8/lgg-1. Autophagy inhibition via depletion of Atg1/unc-51 and Atg8/lgg-1 had relatively small effects on ER size and shape in young adults, indicating that autophagy-mediated turnover plays a limited role in shaping the ER through development (Fig. 5a–d). However, knockdown of Atg1/unc-51 strongly suppressed age-onset changes in SEC-61.B protein levels, footprint and PAR (Fig. 5a–d), and this suppression of age-effects was virtually complete during Atg8/lgg-1 impairment (Fig. 5a–d). These trends generally remained consistent between ER markers (Extended Data Fig. 6a–d) and tissues (Extended Data Fig. 6e–l), although Atg8/lgg-1 RNA interference (RNAi) resulted in modest elevations in RET-1 levels in young animals (Extended Data Fig. 6a,b) and especially strong elevation of RET-1 levels in the aged intestine (Extended Data Fig. 6i,j). Notably, ULK1/unc-51 knockdown also caused the appearance of expanded sheet-like structures (Fig. 5a and Extended Data Fig. 6a), which were not apparent in the Atg8/lgg-1 animals. Together, these findings suggest that macro-ER-phagy, dependent on ULK1/UNC-51, is a primary route for ER-sheet turnover, whereas Atg8-dependent ULK1-independent (vesicular and RecovER-phagy) routes contribute to bulk ER degradation and help balance network morphology.
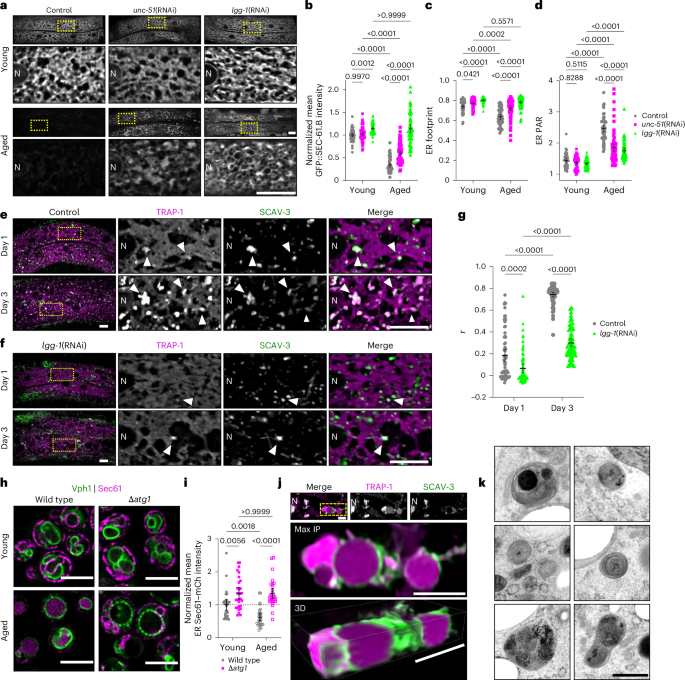
a, Imaging of hypodermal GFP::SEC-61.B in young (top) and aged (bottom) control worms and worms fed dsRNA targeting unc-51 or lgg-1 (unc-51(RNAi) and lgg-1(RNAi), respectively). b–d, Hypodermal GFP::SEC-61.B normalized mean intensity (b), footprint (c) and PAR (d) in young and aged control, unc-51(RNAi) and lgg-1(RNAi) worms. Control (empty vector), n = 57 young and 60 aged worms; unc-51(RNAi), n = 60 young and 67 aged worms; lgg-1(RNAi), n = 54 young and 56 worms; pooled from three replicates. e,f, Hypodermal TRAP-1::mCherry and SCAV-3::GFP in day 1 (top) and day 3 (bottom) control (e) and lgg-1(RNAi) (f) worms. Arrowheads mark regions of co-localization. a,e,f, Scale bars, 10 µm. g, Pearson’s correlation coefficient (r) between mCherry and GFP in the hypodermis of control and lgg-1(RNAi) worms at day 1 and day 3. Control (empty vector), n = 65 day 1 and 69 day 3 worms; lgg-1(RNAi) n = 63 day 1 and 58 day 3 worms; pooled from three replicates. h, Imaging of Sec61–mCherry and Vph1–mNG in young (top) and aged (bottom) control and mutant yeast cells with an atg1 deletion (∆atg1). i, Mean cytoplasmic Sec61–mCherry intensity in control and Δatg1 yeast at 0 and 72 h; n = 30 yeast per group, pooled from two replicates. b–d,g,i, Analysed using a two-way ANOVA, followed by a two-tailed post-hoc Šidák test; P values are shown. j, Representative fluorescence image (top) showing accumulation of ER reporter TRAP-1::mCherry within lysosomes (SCAV-3::GFP) during early ageing (day 3). The boxed region is displayed as maximum intensity (middle) and 3D (bottom) projections. h,j, Scale bars, 5 µm. k, Representative TEM images of autolysosomal compartments filled with characteristic multilamellar ER membrane whorls in aged (day 7) C. elegans. Scale bar, 500 nm. Error bars indicate the mean ± 95% CI. N, nucleus. Source numerical data are provided.
The ER is an important source of membrane for autophagosome formation as well as a potential target of autophagosomes via ER-phagy, and both of these roles could potentially result in reduced ER mass31,51,52. To confirm the ER itself is targeted as cargo for ER-phagy, we employed TRAP-1::mCherry. Unlike GFP and mKate2 labels, mCherry is resistant to lysosomal acidity and degradation, enabling analysis of lysosomal targeting53. In young adult animals, TRAP-1::mCherry and GFP::SEC-61.B labels reveal the same ER network organization (Extended Data Fig. 1c,d). However, TRAP-1::mCherry uniquely begins accumulating in distinct puncta by day 3 of adulthood (Fig. 5e). Consistent with the age-onset formation of these puncta, we observed low co-localization of TRAP-1::mCherry with lysosomal membrane marker, SCAV-3::GFP, in animals on the first day of adulthood and a dramatic increase of TRAP-1::mCherry in SCAV-3+ lysosomes by day 3 (Fig. 5e,g). Atg8/lgg-1 depletion prevented the formation of TRAP-1 puncta and suppressed lysosomal targeting (Fig. 5f, g). Furthermore, the role of autophagy in driving age-onset ER loss is evolutionarily conserved, as the decline of Sec61 in yeast correlated with re-localization to the vacuole via an Atg1-dependent mechanism (Fig. 5h,i). We confirmed the appearance of ER components inside lysosomes through both three-dimensional (3D) fluorescence imaging (Fig. 5j) and TEM (Fig. 5k) of C. elegans. Overall, these results are consistent with a model where activation of ER-phagy in adulthood promotes turnover and remodelling of the ER.
ER remodelling is a common feature of lifespan extension
We next exploited C. elegans to investigate whether established paradigms of lifespan extension involve ER remodelling by ER-phagy. We selected a panel of mechanistically diverse interventions, that is, reduced insulin/insulin-like signalling (daf-2(e1370)), reduced mechanistic target of rapamycin (mTOR) signalling (raga-1(ok386)), germline removal (glp-1(e2141)) and inhibition of translation (dsRNA targeting ifg-1, ifg-1(RNAi)). Consistent with ER remodelling acting as an adaptive step in ageing, these life-extending interventions universally induced dramatic ER remodelling, even at the onset of adulthood (Fig. 6a–e). All interventions promoted substantial reductions in GFP::SEC-61.B intensity and footprint as well as increased PAR (Fig. 5f–h). Although these gross trends resemble changes during normal ageing, we also observed aspects unique to long-lived animals. In contrast to the evenly distributed rough ER sheets under normal conditions (Fig. 6a), cisternal ER networks were condensed into perinuclear regions with large peripheral regions devoid of translocon-labelled ER instead occupied by sparse tubular networks (Fig. 6b–e). This organization suggests enhanced functional compartmentalization of ER networks into distinct sheet- versus tubule-filled regions of the cell, which may correspond with remodelling of other organelle networks and the subcellular architecture more globally. We found that GFP::SEC-61.B intensity, footprint and PAR were restored to levels comparable to controls in animals fed Atg8/lgg-1 dsRNA to impair autophagy (Extended Data Fig. 7a–d), indicating that ER remodelling in long-lived animals involves ER-phagy. However, the regionalized clustering of ER sheets persisted during Atg8/lgg-1 inhibition (Extended Data Fig. 7a), indicating that this aspect of ER network remodelling in long-lived animals is independent of autophagy. Finally, ageing in these conditions resulted in additional declines in ER (Extended Data Fig. 7e–h), consistent with a model where life-extending interventions promote ER-phagy throughout life. Overall, these findings highlight ER network dynamics as an aspect of both life-extending interventions and the normal ageing process.
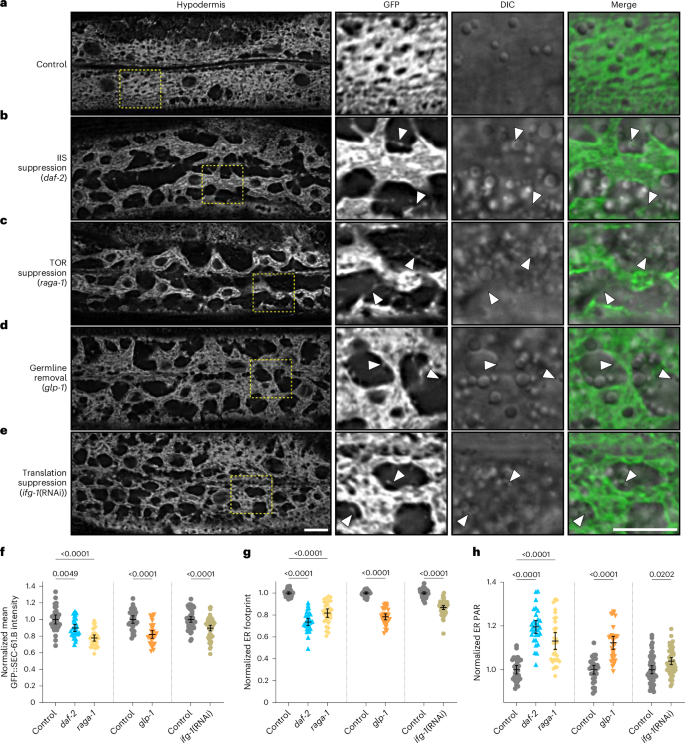
a–e, Imaging of hypodermal GFP::SEC-61.B in young worms from control (a), insulin/insulin-like signalling (IIS) suppression (b), TOR suppression (c), germline removal (d) and translation suppression (e) conditions. Magnified views of the boxed regions are provided; arrowheads indicate sparse ER tubules; DIC, differential interference contrast. Scale bars, 10 µm. f–h, Normalized mean intensity (f), footprint (g) and PAR (h) of GFP::SEC-61.B relative to wild-type (control) worms. Control, IIS and TOR suppression, n = 30 for all groups; germline removal (25 °C), n = 30 for all groups; translation suppression, n = 50 control (empty vector) and 52 ifg-1(RNAi) worms; pooled from three replicates. Worms subjected to different experimental conditions are grouped with their respective controls. Error bars indicate the mean ± 95% CI. Analysed using a one-way ANOVA, followed by a two-tailed post-hoc Šidák test. Source numerical data are provided.
Candidate screening reveals a role for TMEM-131 in age-onset ER remodelling
Mediators of selective ER-phagy are only beginning to be explored in C. elegans54, so we next aimed to elucidate ER-centric processes and molecular mediators linked to turnover during ageing. We thus performed a candidate screen of 35 genes that are orthologues of established ER-phagy mediators or ER-resident proteins harbouring an LIR motif (Supplementary Table 2). As context for our screen, we employed mTOR/raga-1-pathway mutants due to their robust ER depletion even in young animals (Fig. 6c) and the utility of TOR impairment in previous genetic screens for ER-phagy receptors34,55,56. Surprisingly, examination of RET-1::GFP in this background demonstrated that neither canonical ER-phagy receptor orthologues nor the COPII components sec-23, sec-24.1, sec-24.2 and sec-31 (ref. 57) had any discernible effect on ER remodelling in the raga-1 mutants. However, RNAi of tmem-131 (tmem-131(RNAi)), a conserved ER transmembrane protein with a predicted LIR motif, resulted in amelioration of ER loss and an expansion of ER sheets (Fig. 7a). We thus investigated whether tmem-131 promotes turnover of ER during ageing, and found that tmem-131(RNAi) restored SEC-61.B levels and the ER footprint of aged animals to youthful levels (Fig. 7b–e). These results indicate that tmem-131 is required for ER clearance in ageing contexts.
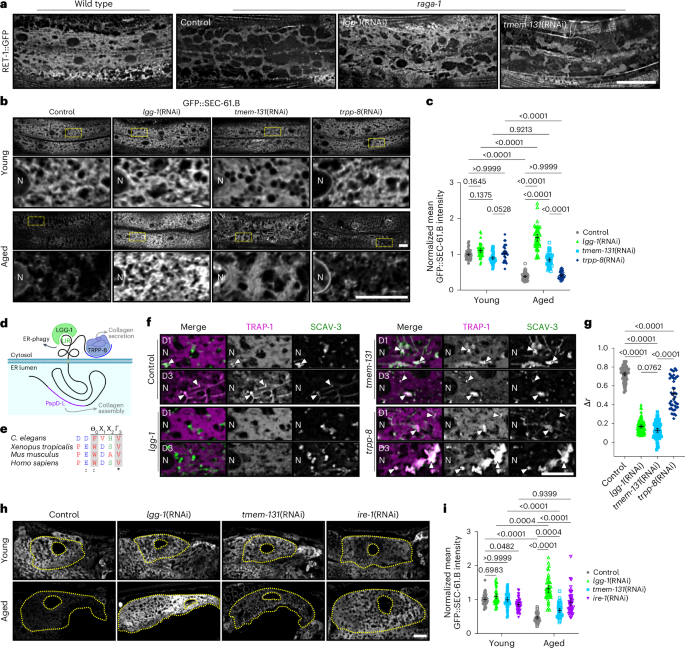
a, Imaging of hypodermal RET-1::GFP in wild-type and raga-1 worms fed dsRNA targeting lgg-1 or tmem-131, or empty vector control as part of ER-phagy regulator screen. b, Imaging of hypodermal GFP::SEC-61.B in young (top) and aged (bottom) control, lgg-1(RNAi), tmem-131(RNAi) and trpp-8(RNAi) worms. Magnified views of the boxed regions are provided beneath the main images. c, Normalized mean intensity of hypodermal GFP::SEC-61.B in young and aged control, lgg-1(RNAi), tmem-131(RNAi) and trpp-8(RNAi) worms. Control (empty vector), lgg-1(RNAi) and tmem-131(RNAi), n = 45 worms per group, pooled from three replicates; trpp-8(RNAi), n = 30 worms per group, pooled from two replicates. d, Cartoon of TMEM-131 and its functional domains. The amino-terminal PapD-L chaperone domain facilitates collagen assembly. The cytosolic LIR motif promotes ER-phagy through binding with Atg8 protein LGG-1/GABARAP. The C-terminal TRAPP III-interacting domain recruits the TRAPPIII complex via TRPP-8 to promote collagen secretion. e, Conservation of the putative LIR (Θ0-Χ1-Χ2-Γ3) motif in TMEM-131 across species. Residues are colored by side chain class: negatively charged (blue), hydrophobic and proline (red) and hydrophilic (green). f, Hypodermal TRAP-1::mCherry and SCAV-3::GFP in day 1 (D1) and 3 (D3) control, lgg-1(RNAi), tmem-131(RNAi) and trpp-8(RNAi) worms. Arrowheads mark ER accumulation in lysosomes. g, Relative change in Pearson’s correlation coefficient (Δr) between mCherry and GFP in the hypodermis of control, lgg-1(RNAi), tmem-131(RNAi) and trpp-8(RNAi) worms during early ageing. Control (empty vector), n = 66 worms; lgg-1(RNAi), n = 76 worms; tmem-131(RNAi), n = 72 worms; trpp-8(RNAi), n = 44 worms; pooled from five replicates. h, Imaging of intestinal GFP::SEC-61.B in young (top) and aged (bottom) control, lgg-1(RNAi), tmem-131(RNAi) and ire-1(RNAi) worms. Dotted yellow lines demarcate the cell membrane and nuclear envelope. i, Normalized mean intensity of intestinal GFP::SEC-61.B in young and aged control, lgg-1(RNAi), tmem-131(RNAi) and ire-1(RNAi) worms. Control (empty vector), n = 42 young and 44 aged worms; lgg-1(RNAi), n = 45 young and 44 aged worms; tmem-131(RNAi) and ire-1(RNAi), n = 45 worms in all groups; pooled from three replicates. c,g,i, Analysed using a one-way (g) or two-way (c,i) ANOVA, followed by a two-tailed post-hoc Šidák test; P values are shown. Error bars indicate the mean ± 95% CI. a,b,f,h, Scale bars, 10 µm. N, nucleus. Source numerical data are provided.
The luminal N terminus of TMEM-131 bears a procollagen binding domain, and the cytoplasmic tail interacts with the transport protein particle (TRAPP) III complex via TRAPPC8/trpp-8 to promote COPII trafficking of collagen cargoes58. However, bioinformatic predictions also indicate a cytosolic domain architecture reminiscent of established ER-phagy receptors33,59, including intrinsically disordered regions60,61 and a conserved LIR motif62 (residues 1517–1520) outside the TRAPPIII-binding region58 (Fig. 7d,e). Furthermore, TMEM-131 was recently proposed as a candidate autophagy receptor in human cells based on proteomic profiling of autophagosomes63. Considering procollagens are an established substrate for both basal and stress-induced ER-phagy64,65, these features suggest TMEM-131 could link luminal ER collagen state to ER abundance (Fig. 7d).
We first tested whether collagen secretion defects could recapitulate the ER phenotypes of tmem-131. Although knockdown of TMEM-131’s binding partner, TRAPPC8/trpp-8, replicates the collagen export defects of tmem-131 (ref. 58), trpp-8(RNAi) failed to rescue ER mass similarly to tmem-131 or Atg8/lgg-1 depletion (Fig. 7b,c and Extended Data Fig. 8a,b). In addition, COPII components play key roles in collagen trafficking, but their impairment did not produce a notable rescue of the ER (Extended Data Fig. 8c). Knockdown of the collagen metallopeptidase dpy-31 (ref. 66) also contrasted sharply with tmem-131, producing a mild reduction in SEC-61.B levels in young animals and a small shift in ER PAR in aged animals (Extended Data Fig. 8d–g). These results collectively argue against a model where general collagen export defects are sufficient to explain the expanded ER mass in ageing tmem-131 animals.
The data instead illustrate a more specialized role for TMEM-131. Aligned with previous reports that procollagen stress is relieved by micro-ER-phagy and ER-to-lysosome-associated degradation-like ER-phagy64,65, impairment of collagen export via either tmem-131(RNAi) or trpp-8(RNAi) elevated baseline TRAP-1 co-localization with lysosomes (Fig. 7f and Extended Data Fig. 8h). Consistent with this, immunoblots of GFP::LGG-1 revealed a pattern in tmem-131 animals consistent with elevated autophagic flux, including reductions in total and lipidated LGG-1 with a twofold increase in free proteolyzed GFP (Extended Data Fig. 8i–l). This suggests that bulk autophagy is activated for procollagen quality control in the absence of tmem-131. However, despite the elevated baseline, tmem-131 blunted the age-induced increase in ER trafficking to lysosomes to a similar extent as Atg8/lgg-1 depletion (Fig. 7f,g) and reduced overall lysosomal trafficking of ER relative to both aged control and trpp-8(RNAi) worms (Extended Data Fig. 8h). This distinction suggests that TMEM-131 plays a specific role in the age-onset macro-ER-phagy that depletes ER volume, which can be at least partly uncoupled from procollagen quality control.
Providing support for the potential for direct recruitment of autophagy machineries, pull-down assays using the TMEM-131 cytosolic domain revealed clear binding with the human Atg8/lgg-1 orthologue GABARAP (Extended Data Fig. 8l). Mutation of the bioinformatically identified LIR motif reduced human GABARAP binding by 25–30% (Extended Data Fig. 8m,n). Although single-LIR receptors generally exhibit stronger dependence, ER-phagy receptors containing multiple LIR motifs (for example, Rtnl3) can form multivalent interactions with the autophagy machinery and exhibit similar partial effects67. Following this result, we indeed discovered at least one additional LIR motif in the cytosolic domain on manual examination (1559: FMNL). To investigate whether TMEM-131 behaves similarly to canonical ER-phagy receptors in vivo, we labelled and imaged endogenous TMEM-131 under ER-phagy-inducing starvation conditions. At baseline, TMEM-131 seemed to localize throughout the ER, forming many foci that did not correspond well with autophagosomes and probably relate to roles in collagen secretion (Extended Data Fig. 8o). Starvation resulted in a clear decline in TMEM-131 levels and footprint, reflecting a global loss of ER, yet TMEM-131 co-localization with autophagosomal puncta increased (Extended Data Fig. 8o–q). Atg8/LGG-1 puncta were consistently present at the boundaries of TMEM-131-labelled ER, including examples of fully co-localized puncta indicative of autophagosomal recruitment (Extended Data Fig. 8o, inset). Finally, consistent with TMEM-131 regulating selective turnover of the ER, tmem-131 depletion failed to promote an increase in mitochondrial volume during ageing (Extended Data Fig. 8r,s). Notably, age-associated mitochondrial fragmentation seemed to be accelerated by tmem-131(RNAi), which may suggest that early stage ER remodelling can promote downstream consequences for other organelle networks. Collectively, these data highlight the requirement of TMEM-131 for age-onset ER turnover. Structural similarities to ER-phagy receptors, evidence for Atg8 binding and recruitment to autophagosomes suggest that TMEM-131 may play direct roles in the targeting of ER by the autophagy machinery. Given that declines in global collagen and matrix secretion are a conserved facet of ageing68, our data may point to a model where TMEM-131 promotes ER turnover when collagen clients are depleted, thus coordinating ER demand with supply.
TMEM-131 and IRE-1–XBP-1 act in distinct tissues to promote age-onset ER turnover
Because we observed ER-phagy-based remodelling of the ER across many tissue types in the worm, we investigated whether TMEM-131’s role extends to other tissues. In contrast to the hypodermis, however, we observed relatively little effect of tmem-131(RNAi) on intestinal ER during ageing (Fig. 7h,i and Extended Data Fig. 9a,b). We therefore returned to the panel of candidate ER-phagy receptors that we initially screened in the hypodermis to test whether an alternate mediator may act in the intestine. We again recovered a single hit from our panel that in this case seemed to fully rescue the age-dependent loss of intestinal ER: the highly conserved, central player in UPR inositol-requiring enzyme (IRE)-1 (Fig. 7h,i and Extended Data Fig. 9a,b). Ire-1 had no impact on the age-dependent changes of the hypodermal ER (Extended Data Fig. 9c–f), just as tmem-131 had little impact on the intestine (Fig. 7h,i). Follow-up experiments revealed that knockdown of the IRE-1 target, the soluble transcription factor XBP-1, also rescues ER loss during ageing in the intestine (Extended Data Fig. 9g–j). Conversely, parallel branches of the UPR, atf-6 and PERK/pek-1, did not demonstrate roles in age-induced ER remodelling (Extended Data Fig. 10). Collectively, these results indicate that the IRE-1–XBP-1 axis promotes age-dependent ER turnover and remodelling, probably through downstream signalling rather than generalized ER stress or a direct role for IRE-1 as an ER-phagy receptor. Together, these findings indicate that the physiological mediators of ER-phagy are not universal but may instead align with the predominant functions of the ER in each tissue. Here TMEM-131 bridges collagen secretion and ER-phagy in the hypodermis, which is responsible for supporting the collagen-based cuticle, whereas ire-1–xbp-1 performs similarly in the intestine, a central hub of UPR signalling in C. elegans1.
ER-phagy promotes mTOR-dependent longevity in yeast and C. elegans
To investigate causal roles of ER-phagy in ageing and lifespan, we turned to yeast and C. elegans models. In yeast, previously validated ER-phagy-specific adaptors allow us to experimentally decouple ER-phagy from bulk macro-autophagy. Given that mTOR inhibition exhibited the strongest ER remodelling phenotype in C. elegans (Fig. 6) and robustly induces both ER-phagy and lifespan extension in yeast34,56,69,70, we investigated whether ER-phagy mediators are important for longevity in rapamycin-treated cells. Alongside macro-autophagy-deficient atg5-deletion mutants (Δatg5) as positive controls, we utilized deletion mutants of the canonical receptor for ER-phagy of peripheral ER (Δatg40)55 as well as deletion mutants of sec66 (Δsec66), which we selected based on its selective localization in ER membranes and its experimentally verified impairment of ER-phagy but not macro-autophagy34. Strikingly, the Δsec66 mutants phenocopied the complete suppression of lifespan of macro-autophagy-deficient Δatg5 mutants and the Δatg40 mutants similarly exhibited a blunted rapamycin effect (Fig. 8a–e). We also tested the role of the tmem-131 and ire-1–xbp-1 ER-phagy-inducing pathways in long-lived C. elegans harbouring mutations in the mTOR activator raga-1. Given the tissue-specific effects of both tmem-131 and ire-1–xbp-1 on ER remodelling, we suspected that multitissue ER-phagy impairment via the combined loss of both pathways would exhibit the strongest impact on lifespan. Consistent with this prediction, we observed a statistically significant suppression of longevity when either tmem-131 or xbp-1 were impaired alone (Fig. 8f–h), with a much more complete suppression when impaired in combination (Fig. 8i). The combined loss of tmem-131 and xbp-1 resulted in a notably short-lived animal regardless of mTOR/raga-1 status. Besides emphasising the importance of ER-phagy in animal health, this dramatic result may also reflect secondary interactions between the two pathways58. Collectively, our results indicate that ER-phagy plays a key role in mTOR-dependent longevity.
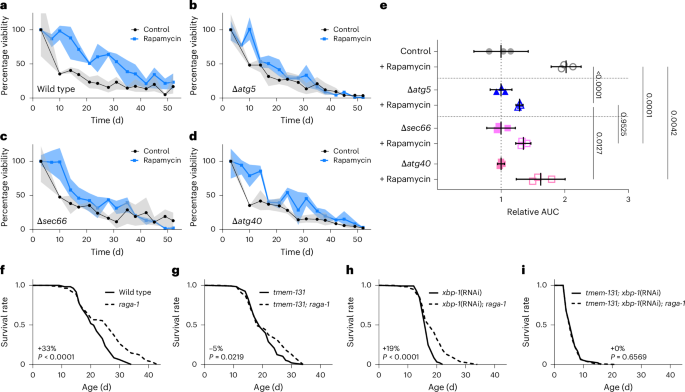
a–d, Chronological lifespan of yeast treated with control or 15 nM rapamycin in wild-type (a), macro-autophagy-mutant (Δatg5; b) or ER-phagy-mutant (Δsec66; c; and Δatg40; d) strains. Three biological replicates per group. Lines indicate the group mean and shading indicates the group range. e, Relative area under the curve (AUC) of lifespan analyses in a–d normalized to control groups. Three biological replicates per group. Analysis using a one-way ANOVA, followed by a two-tailed post-hoc Šidák test; P values are shown. Error bars indicate the mean ± 95% CI. f–i, Lifespan analysis of mTOR/raga-1 mutant worms under control conditions (f), loss of either xbp-1 (g) or tmem-131 (h) alone, and loss of tmem-131 and xbp-1 in combination (i); n = 120 animals per condition, representative of three (f,i) or two (g,h) independent replicates. Analysed using the Mantel–Cox log-rank test; P values as well as the per cent median lifespan extension by raga-1 are provided. Worm lifespan replicate data are available in Supplementary Table 3. Source numerical data are provided.
First Appeared on
Source link

