Excess cysteine drives conjugate formation and impairs proliferation of NRF2-activated cancer cells
Cell culture
Cell lines were acquired from ATCC (H1299, CRL-5803; A549, CCL-185), JCRB Cell Bank (OCUG1, JCRB0191; KKU100, JCRB1568), Takara (HEK293T Lenti-X, 632180), as a gift from S. Saha, Fred Hutch (SNU308, TFK1, SSP25, RBE, YSCCC and CCLP1) or as a gift from M. Linehan, National Cancer Institute (NCI) (UOK262). Cell identities were confirmed using short-tandem repeat profiling and cells were regularly tested to be free of Mycoplasma contamination (MycoProbe, R&D Systems). Cells were sustained in Dulbecco’s modified Eagle medium (DMEM) with pyruvate (Corning, MT-50-003-PC) supplemented 3.7 g l−1 sodium bicarbonate (Sigma, S6297), 10% heat-inactivated fetal bovine serum (FBS) (Gibco, 26140079 and Cytiva HyClone, SH3039603HI) and 1% penicillin–streptomycin solution (P/S) (Sigma, P4333). Cells were incubated in a humidified incubator at 37 °C and 5% CO2.
Western blotting
Cells were seeded at 0.5–1 × 10⁶ cells per 6-cm plate, depending on cell size. The following day, plates were placed on ice, washed once with 1 ml ice-cold phosphate-buffered saline (PBS) and 100 μl RIPA buffer (Thermo Fisher, J63324-AK) supplemented with Halt protease and phosphatase inhibitor (Thermo Fisher, 78442) was added to the plate and cells were scraped into a microcentrifuge tube using the back of a P1000 pipette tip. Samples were kept on ice for 30 min, then centrifuged at 17,000g for 10 min at 4 °C. The supernatant was transferred to a fresh microcentrifuge tube and quantification of protein was performed using a BCA assay (Thermo Fisher, 23225). Samples were denatured using Bolt 4× LDS Sample Buffer (Thermo Fisher, B0007) and Bolt 10× Reducing Agent (Thermo Fisher, B0004) and heated to 95 °C for 5 min, and then gently spun to collect all condensates that formed on the interior of the tube. Samples were then loaded onto a 4–12% SDS–PAGE (Invitrogen, NW04122BOX) and ran at the following voltages and times: 100 V for 10 min, 150 V for 15 min and 165 V for 25 min. After electrophoretic separation, protein was then transferred to a 0.22-mm nitrocellulose blot using iBlot2 transfer stacks (Thermo Fisher, IB23001) and gel transfer device (Thermo Fisher, IB21001) on the P0 setting. The nitrocellulose blot was then Ponceau stained (Sigma, P7170-1L) and cut if probing for more than two proteins with antibodies produced from the same species. Membranes were blocked with 5% bovine serum albumin (Sigma, A4503-100G) dissolved in Tris-buffered saline with 0.1% Tween-20 (TBS-T) and incubated at 4 °C overnight with the following primary antibodies: anti-NRF2 (Cell Signalling, 33649; 1:500 dilution), anti-Vinculin (Sigma-Aldrich, SAB4200729-100UL; 1:10,000 dilution), anti-xCT/SLC7A11 (Cell Signalling, 12691S; 1:1,000 dilution) and anti-NQO1 (Cell Signalling, 62262; 1:5,000 dilution). The following day, membranes were washed three times with TBS-T, and incubated with the secondary antibodies 680RD goat anti-rabbit IgG (Licor, 926-68071; 1:15,000 dilution) and/or 800CW goat anti-mouse IgG (Licor, 926-32210; 1:15,000 dilution) for 1 h. After secondary antibody incubation membranes were washed three times with TBS-T and imaged using a LiCOR Odyssey Near-Infra-red imaging system.
NRF2on cell line classification
To identify cell lines with chronic NRF2 activation, we obtained publicly available datasets measuring variables relevant to NRF2 status from depmap.org for gene essentiality (21Q4 Chronos scores for NFE2L2, SLC33A1, TAPT1 and SUCO), gene expression (21Q4 expression for NRF2 target genes ABCC2, ABCC3, AKR1B10, AKR1C1, GCLM, GSR, ME1, NQO1 and TXNRD1), NRF2 pathway mutations (KEAP1, NFE2L2 and CUL3) and metabolite levels associated with NRF2 activation (NADP+, glutathione disulfide (GSSG) and GSH). NRF2 activation score was calculated by adding the standardized expression scores (xstd) for each of the nine NRF2 target genes using the formula: xstd = (xi − x̄)/σx, where xi = expression of gene x in cell line i, x̄ = average expression of gene x across all cell lines and σx = s.d. of gene x expression across all cell lines. In total, 973 cell lines had measurements of gene essentiality, gene expression and mutations. NRF2on status was defined as cell lines in the top quintile for both NRF2 dependency (Chronos score <−0.3028) and NRF2 activation score (>4.06), yielding 102 NRF2on cell lines and 875 NRF2off cell lines. Cell lines were also classified by annotated cell lineage and NRF2 pathway mutation status, in which a pathway mutation was defined as either a deletion, frameshift, nonsense or splice site mutation in KEAP1 or CUL3, or any missense mutation in KEAP1, CUL3 or NFE2L2. Cell lines of each group were then evaluated for correlations between NRF2on status, NRF2 pathway mutations and phenotypes relevant to NRF2 activation, including dependency on SLC33A1, TAPT1 and SUCO in all cell lines and metabolite levels for the subset of cell lines with corresponding measurements of NADP+ (626/973), GSSG (617/973) or GSH (617/973).
Medium consumption measurements
To measure the flux of metabolite consumption and excretion, cells were plated at 1–2 × 10⁵ cells per well of six-well dishes, factoring in proliferation rates and cell volumes to capture a similar range of cell-volume hours over the experiment, and incubated in 4 ml DMEM with dialysed FBS in multiple parallel wells and, at each time point, 500 μl of the medium was removed and frozen, and the cells were trypsinized and counted using a Beckman Coulter Counter Multisizer 4. To account for changes in medium metabolite fluxes from increasing cell numbers over time, and to normalize differences in cell size and proliferation rates between cell lines, consumption rates were measured by fitting a linear regression using medium metabolite moles and the area under the growth curve, using total accumulated cell-volume (μl) hours at each time point. Similar protocols were used to measure metabolite consumption upon treatment with 200 μM BSO in DMEM with FBS or in Human Plasma-Like Media (HPLM; Thermo Fisher, A4899101).
Media concentrations
After the experiment was completed, 20 μl of each medium sample was extracted with 500 μl 80% HPLC-grade methanol (80:20 methanol:water). Then, 100 μl from that extraction was transferred to a fresh microcentrifuge tube and dried on a Centrivap vacuum concentrator. Samples were reconstituted to 40 μl in 80% methanol containing U-13C, U-15N labelled canonical amino acid mix (Cambridge Isotopes, MSK-CAA-1), U-13C labelled glucose (Cambridge Isotopes, CLM-1396) and U-13C labelled lactate (Cambridge Isotopes, CLM-1579) and transferred to vials for measurement by LC–MS. For HPLM experiments, samples were concentrated by 3.6× compared with DMEM samples. Response ratios were determined by dividing the peak area for each metabolite by the peak area for each labelled standard, which was then mapped to a calibration curve for each metabolite to infer concentration. Medium concentrations were then determined by back calculating for each step introducing a dilution. Finally, medium evaporation and minor pipetting errors introduced before resuspension in isotope standard mix were corrected by normalizing to average phenol red peak area.
Cell-volume-hours calculations
Cells were trypsinized at t = 0 and eight other time points over two experiments, each n = 3, ranging from 6 to 120 h, with time points chosen based on the cell volumes and proliferation rates of each cell line, and total cell volume for each well was determined by Coulter Counter. Cell-volume-hours were calculated at time point t, using the equation:
$${\int }_{{T}^{0}}^{{T}^{1}}N\left(t\right)=\frac{{N}_{0}}{k\mathrm{ln}\left(2\right)}({2}^{{kT}}-1)$$
Where N(t) represents the cell-volume-hours between time points T0 and T1, N0 is the initial total cell-volume (μl), k is the proliferation rate (cell-volume doublings per hour) and T is the time between time points T0 and T1 (hours). Accumulated cell-volume-hours for each well of each time point were determined by adding the calculated cell-volume-hours for that well to the average accumulated cell-volume-hours of the previous time point. Data points were excluded from calculations of medium consumption rates if cells grew to more than 300 μl hours, which was found to slow cell growth rate and is thereby expected to alter metabolic fluxes. Data points were also excluded for the consumption rate calculations for a metabolite and its closely linked metabolite fluxes (for example, glutamate efflux upon cystine depletion) if that metabolite was depleted by 90% or more, which would likely impair uptake rates.
Medium conditions and treatments
SNU308, KKU100, SSP25, TFK1, OCUG1, RBE, YSCCC, CCLP1, UOK262, A549 and H1299 cells were seeded at 0.1–2 × 10⁵ cells per well in standard medium conditions. The following day, cells were washed in PBS and changed to the assay medium (DMEM) containing regular or dialysed FBS (Sigma, F0392) and various treatments and times, as indicated. For U-13C-glucose-tracing experiments, SSP25 cells were washed with PBS and changed into DMEM without glucose, glutamine, pyruvate or sodium bicarbonate (Sigma, D5030), that had been supplemented with standard DMEM concentrations of U-13C-glucose (Cambridge Isotopes, CLM-1396), pyruvate (Sigma, P8574), glutamine (Sigma, G5792), sodium bicarbonate (Sigma, S6297), P/S and dialysed FBS for the indicated times. For low-cystine and low-glucose experiments, cell lines were washed twice with PBS and changed into DMEM without glucose, cystine, pyridoxal HCl or riboflavin (US Biological Life Sciences, D9800-02C), which had been supplemented with glucose (Sigma-Aldrich, G7528) at either 25 mM (normal) or 250 μM (low) and L-cystine (Sigma-Aldrich, C6727) at either 200 μM (normal) or 20 μM (low) and standard concentrations of pyridoxal HCl (Sigma-Aldrich, P6155), riboflavin (Sigma, R9504), P/S and dialysed FBS for 6 h before extraction. Other experiments conducted in standard assay medium included metabolite and/protein extractions after 6-h treatments with 5 mM 2-deoxyglucose (Sigma, D8375), 6 mM glutamate (Sigma G8415), 0.5 μM erastin (Cayman Chemical, 17754) or a dose titration of β-mercaptoethanol (Sigma M3148) and 24-h treatments with 50 μM or 200 μM L-buthionine-sulfoximine (BSO) (Sigma, B2515, Selleckchem S9728), a dose titration of CYS2 (±0.5 μM erastin), 100 μM KI696 (MedChemExpress, HY-101140) or 20 mM NAC (±0.5 μM erastin) (Sigma, A7250). For pyruvate-free experiments, cell lines were washed twice with PBS and changed into DMEM without pyruvate, phenol red, glucose, L-cystine or L-glutamine (US Biological Life Sciences, D9815), that had been supplemented with 25 mM glucose, 1× GlutaMAX (Gibco, 35050-061), P/S and FBS, with or without pyruvate or L-cystine, treated with or without 0.5 μM erastin. For HPLM experiments, cell lines were washed twice with PBS and changed into HPLM that had been supplemented with P/S and FBS, with or without L-cystine or 0.5 μM erastin.
Generation of isotope standard mix for CYS related metabolites
A mix of isotopically labelled CYS metabolite standards was generated for benchmarking abundance changes of CYS related metabolites. Immediately after resuspension, 2.5 mM 3,3-D2-CYS (Cambridge Isotope Laboratories, DLM-769-0.1) was combined with 1 mM dihydroxyacetone phosphate (DHAP; Cayman Chemical, 34641) to generate labelled 1DC or 1 mM glyceraldehyde-3-phosphate (G3P; Cayman Chemical, 17865) to generate labelled 3GC. These two solutions were then diluted a tenfold volume of NEM extraction solution, 80% methanol with the remaining 20% consisting of 10 mM ammonium formate (Sigma, 70221), pH 7 in HPLC-grade water with 2.5 mM N-ethylmaleimide (NEM; Thermo Fisher Scientific, 040526.06) for a final concentration of 2 mM ammonium formate and 0.5 mM NEM) to conjugate residual 3,3-D2-CYS and prevent further oxidation. 3,3-D2-CYS with G3P solution was then diluted 1:10 in 3,3-D2-CYS with DHAP solution. A solution of 75 mM labelled GSH (13C2, 15N (glycine)-labelled glutathione; Cambridge Isotope Laboratories, CNLM-6245-HP-10) was added at 10 µl per 30 ml of previously mixed solution. The final standard mix contained D2 labelled 1DC, 3GC, CYS–NEM and CYS2 (from spontaneous oxidation), and 13C2, 15N labelled GSH–NEM. This isotopically labelled CYS metabolite standard mix was used at a volume of 40 µl per 1 µl of cell volume when reconstituting dried samples, allowing calculations of response ratios of unlabelled metabolites (from biological extracts) to their labelled versions to correct for matrix effects or loading issues. For metabolites with available purified standards, standard curves were generated using unlabelled cysteine (CYS; Sigma, 30089) and reduced glutathione (GSH; Sigma, G6529), with each solubilized from powder with NEM extraction solution. These compounds were dried and reconstituted with 50 µl of isotopically labelled CYS metabolite standard mix. Then, a six-point tenfold dilution series was prepared for each compound. Response ratios for each compound were generated by dividing the peak area (ion counts) by the corresponding labelled standard and used to generate a standard curve (best fit of linear, power or second-degree polynomial) for each compound to enable calculations of CYS–NEM and GSH–NEM concentrations in biological samples.
Metabolite extractions
Cell lines
At the time of extraction, cells were washed twice with ice-cold blood bank saline on ice and carefully aspirated. Two separate extraction solvent solutions were used depending on the experiment goals: (1) standard extraction solvent, which consists of 80% methanol (80:20 methanol:water) with or without a valine D8 loading standard; or (2) NEM extraction solvent, used for quantitative measurements of thiol metabolites (and their disulfide counterparts), which consists of 80% methanol with the remaining 20% consisting of 10 mM ammonium formate, pH 7 in HPLC-grade water with 2.5 mM NEM, for a final concentration of 2 mM ammonium formate and 0.5 mM NEM. After wash solution was aspirated from cells, 500 μl of either extraction solvent was added to each well and cells were quickly scraped with the back of a P1000 pipette tip and pipetted into a microcentrifuge tube and placed on ice. Samples were centrifuged at 17,000g for 5 min at 4 °C, and 350 μl supernatant was transferred to a fresh microcentrifuge tube and dried on a Centrivap vacuum concentrator (Labonco, 10269602). Matching wells for each condition were also counted on the Coulter Counter to determine total average cell volume for each treatment condition. At the time of analysis, cell extracts were resuspended in 80% methanol with or without U-13C yeast extract (Cambridge Isotope, ISO1), with or without NEM and/or isotopically labelled CYS metabolite standard mix at a concentration of 28–40 μl solvent per 1 μl cell volume, vortexed at 4 °C for 5 min and centrifuged at 17,000g for 5 min at 4 °C.
Tumour extracts
LUAD tumour extracts from mice infused with 13C6-CYS2 were previously generated, extracted in NEM extraction solvent as described by Yoon et al., and used without modification7. SqCLC samples were described by Stewart et al. and provided as deidentified samples, aside from annotation of the presence of mutations to KEAP1 or NFE2L2 (ref. 41). Frozen tumour tissues were pulverized with a prechilled Bio-Pulverizer (59012MS, BioSpec). After weighing the tissues, a standard extraction solvent was added to the pulverized tissue for a final concentration of 50 mg tissue per ml extraction, vortexed well, and incubated at −80 °C overnight. Samples were centrifuged at 17,000g for 20 min at 4 °C and kept at −80 °C. Before analysis of SqCLC samples, isotopically labelled CYS metabolite standard mix containing NEM was used as a spike-in standard at a 1:4 dilution. In all cases, 20 μl of the metabolite extract supernatant was transferred to an LC–MS vial until analysis. Samples were kept at −80 °C until the time of analysis.
LC–MS
Metabolite quantitation of resolubilized metabolite extracts was performed using a Q Exactive HF-X Hybrid Quadrupole-Orbitrap Mass Spectrometer equipped with an Ion Max API source and H-ESI II probe, coupled to a Vanquish Flex Binary UHPLC system (Thermo Scientific). Mass calibrations were completed at a minimum of every 5 days in both the positive and negative polarity modes using LTQ Velos ESI Calibration Solution (Pierce). Metabolites were chromatographically separated by injecting a sample volume of 1 μl into a SeQuant ZIC-pHILIC Polymeric column (2.1 × 150 mm 5 mM, EMD Millipore). The flow rate was set to 150 μl min−1, autosampler temperature set to 10 °C and column temperature set to 30 °C. Mobile phase A consisted of 20 mM ammonium carbonate and 0.1% (v/v) ammonium hydroxide, and mobile phase B consisted of 100% acetonitrile. The sample was gradient eluted (% B) from the column as follows: 0–20 min: linear gradient from 85% to 20 % B; 20–24 min.: hold at 20% B; 24–24.5 min: linear gradient from 20% to 85% B; 24.5 min to the end: hold at 85% B until equilibrated with ten column volumes. Mobile phase was directed into the ion source with the following parameters: sheath gas of 45, auxiliary gas of 15, sweep gas of 2, spray voltage of 2.9 kV in the negative mode or 3.5 kV in the positive mode, capillary temperature of 300 °C, RF level of 40% and auxiliary gas heater temperature of 325 °C. Mass detection was conducted with a resolution of 240,000 in full-scan mode, with an AGC target of 3,000,000 and maximum injection time of 250 ms. Metabolites were detected over a mass range of 70–1,050 m/z. Quantitation of all metabolites was performed using Tracefinder 4.1 (Thermo Scientific) referencing an in-house metabolite standards library using ≤5 ppm mass error. For inter-tumour comparisons of metabolite abundance, outliers were excluded using the ROUT outlier test Q = 1%. Data from U-13C glucose stable isotope-tracing experiments include correction for natural isotope abundance using IsoCor software (v.2.2). For fractional labelling measurements in tumours, only samples with detection of both M + 0 and M + 3 isotopologues were included in calculating labelled fractions.
RMA tracing for untargeted metabolite identification
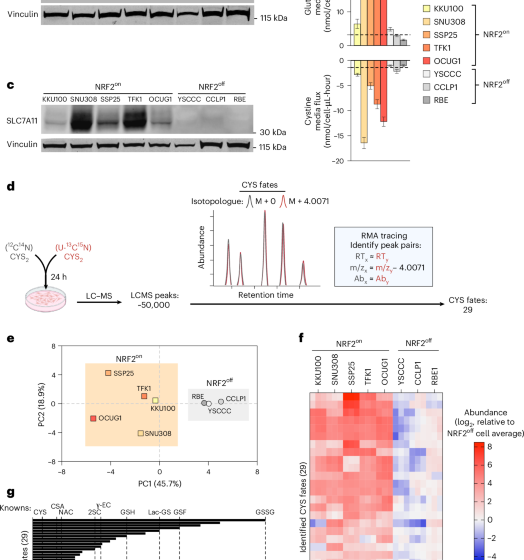
13C15N-cystine tracing
Cells seeded for intracellular metabolite extractions, as described above, and changed to assay medium (DMEM) containing dialysed FBS and a ~1:1 ratio of labelled:unlabelled cystine, accomplished by adding 200 μM 13C615N2 L-cystine (Cambridge Isotopes, CNLM-4244-H-PK) to the medium. Cells were incubated for 24 h, and intracellular metabolites were extracted as described above and analysed by LC–MS.
Peak calling
Raw data generated by LC–MS was first processed using Compound Discoverer 3.0 (Thermo Fisher) to make a list of peaks used in downstream analysis. Each peak in this list has information about the exact mass, retention time, and integrated ion count (peak area) observed in each sample. To generate this peak list, data from each polarity was run as separate instances, spectra were selected using a signal-to-noise threshold of 4 and centroids from multiple files were aligned in retention time space using an adaptive curve model, with a maximum retention time shift of 1 min and a mass tolerance of 5 ppm. The resulting aligned centroids were filtered using signal-to-noise threshold of 5. To collapse centroids derived from the same compound (caused by mass defects, isotopologues and adducts), centroids were assigned to a ‘compound’, which we refer to as peaks. Compound assignment was made using settings of a mass tolerance of 5 ppm, an isotope intensity tolerance of 30%, a signal-to-noise threshold of 5 and a minimum peak intensity of 50,000. Finally, these ‘compounds’ were grouped using a mass tolerance of 5 ppm and a retention time tolerance of 0.4 min. Then, peaks missing in some samples were filled in using the fill-gap function with a mass tolerance of 5 ppm and a signal-to-noise threshold of 1.5.
Identification and filtering of RMA-tracing candidate peaks
The peak lists generated using Compound Discover were processed using Python scripts to identify the peaks fulfilling the criteria under the RMA-tracing scheme. A detailed description of the parameters used can be found on GitHub at https://github.com/krdav/RMA_tracing/blob/main/peak-pair-analysis_bile-duct-cells_cys-tracing.ipynb
First, the peak list was filtered such that all peaks had at least one sample with an ion count over 25,000, at least one sample receiving labelled cystine with an ion count over 15,000 and at least one sample with an ion count fourfold higher than that of any blanks. Peaks with an exact mass of less than 120 Da (one Dalton below cysteine) were also discarded. A number of these peaks were found to be derived from small mass defects that were not collapsed by Compound Discoverer, giving rise to multiple peaks from the same molecule. These situations were identified when two criteria were both fulfilled: (1) an exact mass difference of ≤50 ppm; and (2) a retention time difference of ≤0.1 min or a retention time difference of ≤0.2 min and a Pearson correlation coefficient between the two peak areas across samples of ≥0.9. Upon identification, peaks were merged by taking the sum of the peak areas and keeping the exact mass and retention time from the peak with the largest sum of peak areas. After this filtering, RMA-tracing candidate peaks were found by searching for their cysteine labelled m + 4 isotopologue peaks using a maximum difference between theoretical and observed exact mass of 10 ppm, a maximum retention time difference of 0.25 min and a labelling fraction range of 0.2–0.28 or 0.34–0.42 observed in at least one sample. These labelling ratio ranges were determined using the empirically measured M + 4/M + 0 ratios of known cysteine fates (for example, 2SC, GSH and lactoylglutathione), with the higher range reflecting the expected and measured labelling fraction of molecules incorporating two cysteines (for example, GSSG). These labelling fractions were lower than the expected ~0.5 labelling ratio, possibly reflecting labelling dilution from residual unlabelled cysteine in these cells or contributions of biosynthetic pathways to the cysteine pool from unlabelled sources. The RMA-tracing candidates were compiled as a list of peak pairs with the unlabelled and m + 4 isotopologue peaks and the peak area for each sample. A number of these peak pairs were found to be adducts or isotopologues of a parent peak pair that was not filtered out in previous steps and thus giving rise to multiple peaks from the same molecule. For adducts, potential adduct masses for each peak pair were calculated using a list of known common adducts. Peak pairs with matching exact mass and retention time were identified and flagged as potential adducts using an exact mass difference of less than or equal to 200 ppm and a retention time difference of ≤0.8 min. For isotopologues, potential isotopologue masses for each peak pair were calculated using a list of the most abundant isotope combinations. Peak pairs with matching exact mass and retention time were identified and flagged as potential isotopologues using an exact mass difference of ≤200 ppm, a retention time difference of ≤0.4 min, a Pearson correlation coefficient between the peak area of the predicted isotopologue and its parent across samples ≥0.7 and a requirement that the peak area of the predicted isotopologue be less than that of its parent.
Python scripts for identification and filtering of RMA-tracing candidate peaks can be found in the associated GitHub repository at https://github.com/krdav/RMA_tracing
Stringent filtering of candidate peaks
To generate the final peak list, peak pairs previously flagged as potentially arising from natural isotopes, adducts, known fragments and peak duplicates were removed, and the peak list was subjected to another round of stringent filtering. Stringent filtering was informed by the characteristics of known cysteine fates within the peak list and removed peak pairs with larger deviations in retention times and ppm error from expected masses. As none of the known cysteine fates in the dataset had labelled/unlabelled pairs with a ∆ppm of >0.66 or a ∆RT > 0.04 min, a stringent filter was set to exclude peak pairs with a ∆ppm of greater than or equal to 1.0 or with a retention time difference of greater than or equal to 0.06 min. Finally, for peaks detected in both positive and negative modes the peak with the lower ion count was discarded, yielding the peak final list (Supplementary Table 1).
Generation of CYS fates by combining CYS with purified metabolites
Chemical standards of glucose fates (sugar standards) were solubilized in PBS at 4 mM; 3-phosphoglycerate (Cayman Chemical, 20123), ribose-5-phosphate (R5P) (Sigma, R7750), ribulose-5-phosphate (Cayman Chemical, 21423), glucose-6-phosphate (Cayman Chemical, 20376), glucose-1-phosphate (Cayman, 30566), xylulose-5-phosphate (Sigma, 15732), 2-phosphoglycerate (Sigma, 79470), glyceraldehyde-3-phosphate (G3P) (Cayman Chemical, 17865), dihydroxyacetone phosphate (DHAP) (Cayman Chemical, 34641), phosphoenolpyruvate (PEP) (Cayman Chemical, 19192-250) or 2 mM methylglyoxal (Sigma, M0252), DL-lactaldehyde (Sigma, 49426), hydroxyacetone (Sigma, 138185), sodium lactate (Sigma, 71719) and sodium pyruvate (Sigma, P8574). L-cysteine (Sigma-Aldrich, 30089) was prepared fresh by dissolving in a half volume of 1 M HCl, neutralized with a half volume of 1 M NaOH, and diluted to a 10 mM stock solution in PBS. Sugar standards were then either extracted immediately or combined with L-cysteine in a PCR tube at equal volumes to achieve a final reaction concentration of 5 mM L-cysteine with 1–2 mM sugar standards in duplicate. Reactions were then incubated overnight in a PCR machine at 37 °C and extracted the following day and prepared for LC–MS analysis. To measure the stoichiometry of reactions between cysteine and sugar phosphate standards, 10 mM stocks of DHAP, G3P, and R5P were diluted to 1 mM stock solutions in PBS and placed on ice. A neutralized stock of freshly prepared L-cysteine was generated as above, diluted to 10 mM, 5 mM, 2 mM, 1 mM, 0.5 mM 0.25 mM or 0 mM in PBS, and dispensed into microcentrifuge tubes. Equal volumes of 1 mM stocks of DHAP, G3P or R5P were then added to each tube, to achieve final concentrations of 5 mM, 2.5 mM, 1 mM, 0.5 mM, 0.125 mM and 0 mM L-cysteine and 500 μM DHAP, R5P and G3P. They were then pipette mixed ten times, spun gently, incubated at 37 °C for 1 h and returned to ice. To measure the production of CYS fates with other carbonyls, a reaction solution containing 5 mM L-cysteine and 0.5 mM solution of formaldehyde (Sigma, F1635), acetaldehyde (Sigma, 402788), formic acid (Sigma, 5.33002), acetone (Sigma, 270725-2L) or pyridoxal (Sigma, P6155-5G) in PBS was incubated for 1 h. After incubation, reactions were then dried on a Centrivap concentrator and resuspended at the reaction volume in 80% HPLC-grade methanol (80:20 methanol:water) when ready for analysis, transferred to an LC–MS vial, and submitted for LC–MS measurements.
Lentiviral production and infection
The following plasmids were obtained from Addgene: pMDLg/pRRE (12251, a gift from D. Trono), pMD2.G (12259, a gift from D. Trono), pRSV-Rev (12253, a gift from D. Trono), pDONR223_NFE2L2_p.G31R (81520, a gift from J. Boehm, W. Hahn and D. Root), pInducer20 (44012, gift from S. Elledge), lentiMPHv2 (89308, gift from F. Zhang) and LentiSAMv2 (75112, gift from F. Zhang). NFE2L2_p.G31R was cloned from pDONR223 to pInducer20 using LR Clonase II (Fisher, 11791100). SLC7A11 was cloned via CRISPR Activation. Guide RNAs (gRNAs) were selected for the promoter region of human SLC7A11 using CRISPick software (https://portals.broadinstitute.org/gppx/crispick/public) and the SLC7A11 gRNA oligonucleotide (5’–3’: AAAGAGCTGAGTAATGCTGG) was modified according to BsmbI restriction sites on the customizable lentiSAMv2 plasmid and purchased from Integrated DNA Technologies. LentiSAMv2 was digested to create BsmbI overhangs, and the SLC7A11 gRNAs were annealed and cloned into the digested vector, and verified using whole-plasmid sequencing (Plasmidsaurus). Lentivirus was generated by transfection of HEK293T cells with expression construct plasmid DNA along with pMDLg/pRRE, pRSV-Rev and pMD2.G packaging plasmids with FuGENE transfection reagent (Fisher, PRE2693) in DMEM (Fisher, MT10017CV) without FBS or P/S. The supernatant containing lentiviral particles was filtered through 0.45-µM membrane (Fisher, 9720514) and was supplemented with 8 µg µl−1 Polybrene (Sigma, TR-1003-G) before infection. Cells were cultured to ~20–50% confluency in six-well dishes and centrifuged with lentivirus-containing medium (900g, 90 min, 30 °C). SLC7A11 overexpressing cells received both lentiMPHv2 and lentiSAMv2-SLC7A11 viruses. After 24 h, cells were replenished with fresh medium and after 48 h, cells were selected with 1 or 10 μg ml−1 blasticidin (Fisher, R21001), 150 µg µl−1 hygromycin (Sigma, H7772), 0.8 mg ml−1 G418 (Sigma, A1720) and maintained in selection medium until all uninfected control cells had died.
Proliferation assays
Exponentially growing cells were seeded overnight in standard DMEM onto six-well dishes (Corning, 3516) with an initial seeding density of 0.2–2 × 10⁵ cells per well, based on cell size and proliferation rates. After overnight incubation, replicate wells were trypsinized and counted for a starting cell count at the time of treatment. Remaining cells were washed twice in PBS and 4 ml of treatment medium was added. For all proliferation experiments except NAC treatments, medium was refreshed on day 2. All final counts occurred on day 4. Additional conditions include a 24-h pretreatment (before day 0 counts) with 100 μM KI696 (MedChemExpress, HY-101140) or co-treatment with 0.5 μM erastin (Cayman Chemical, 17754). Proliferation rate was determined by the following equation: proliferation rate (doublings per day, 1/d) = (log2(final cell count/initial cell count))/total days.
Bioenergetic measurements
Oxygen consumption and extracellular acidification measurements were conducted using an Agilent Seahorse Xfp Analyzer. SNU308, TFK1 or CCLP1 cell lines were trypsinized and seeded overnight at 0.1–1 × 10⁶ cells, depending on cell size, in 100 μl of medium in XF96 cell culture microplates (Agilent, 101085-004). The following day, cells were washed once with PBS and 200 μl of DMEM supplemented with P/S and FBS was added, with or without 0.5 μM erastin and 200 μM or 800 μM CYS2. Additionally, the sensor cartridge was incubated overnight in H2O. The morning after, cells were washed twice with PBS and 180 μl of DMEM without bicarbonate and without FBS was added. CYS2 and erastin treatment was maintained. At this time, the sensor cartridge was switched to be incubated in calibrant solution (Agilent 100840-000). The sensor cartridge was loaded with an injection solution yielding a final concentration of 0.5 μM rotenone (rot) (Sigma, R8875) and 0.5 μM antimycin A (AA) (Sigma, A8674). Following the assay, the medium was removed and 10 μl of RIPA buffer was added directly to each well and a BCA assay was conducted to quantify protein in each well. All measurements were normalized to μg of protein. Basal oxygen consumption and extracellular acidification rates were determined by the pre-injector measurements. Non-mito oxygen consumption was calculated to be the oxygen consumption after rot/AA treatment.
Statistics
Identified cysteine fate abundances were normalized to z scores across bile duct cancer cell lines and principal-component analysis was conducted in GraphPad Prism v.10. Statistical tests used across experimental groups are annotated in each figure legend and were conducted in GraphPad Prism v.10. Sample sizes were not predetermined but were based on observed variance in standard measurements (LC–MS experiments, proliferation assays and Seahorse measurements) or by including all available samples (Depmap datasets and tumour samples). Data distribution was assumed to be normal but this was not formally tested. When possible, samples groups were randomized in the order of analysis to distribute systemic errors. Data collection and analysis were not performed blind to the conditions of the experiments. All non-tumour experiments were repeated at least once with qualitatively similar results. For murine and human tumour LC–MS metabolite abundance data, a ROUT outlier test (Q = 1%) was performed before the data were normalized. All measurements shown are from distinct samples, with data points representing technical replicates from parallel conditions on the same experiment, unless stated otherwise.
Reporting summary
Further information on research design is available in the Nature Portfolio Reporting Summary linked to this article.
First Appeared on
Source link

