Exome sequencing and analysis of 44,028 British South Asians enriched for high autozygosity
Protein coding variation and population structure in 44,028 South Asian exome sequences
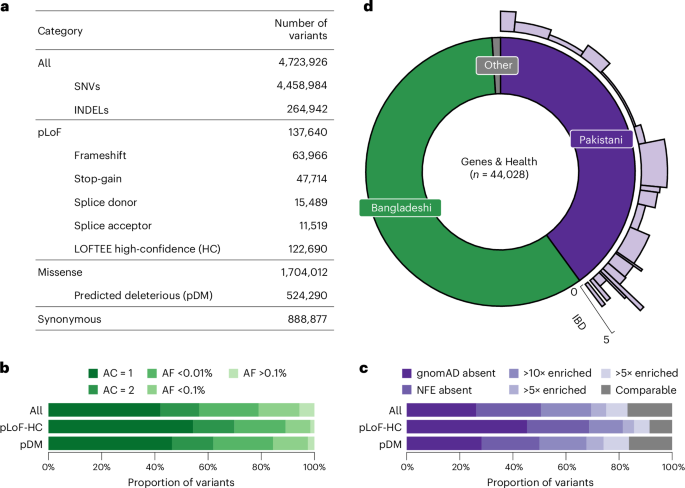
We identified a total of 4,723,926 variants (4,458,984 single-nucleotide variants (SNVs) and 264,942 insertions or deletions (INDELs)) from 44,028 G&H exome sequences after stringent quality control (Supplementary Methods). Across 17,545 transcripts from the Matched Annotation from the NCBI and EMBL-EBI (MANE) project21, we found 122,690 predicted loss-of-function (pLoF) variants that are high-confidence (pLoF-HC) by LOFTEE22, and 1,704,012 missense variants, of which 524,290 are predicted damaging missense (pDM) (Combined Annotation-Dependent Depletion (CADD) score >20, Polymorphism Phenotyping v2 (Polyphen2) score >0.445 and predicted deleterious by Sorting Intolerant From Tolerant (SIFT)) (Fig. 1a). As expected, pLoF and pDM variants were heavily enriched among singleton and ultrarare variants (Fig. 1b). We compared the allele frequency (AF) of the variants in G&H with those in the Genome Aggregation Database22 (gnomAD, v4.1), which catalogs variants from 807,162 genomes and exomes of diverse ancestry, including 45,546 of South Asian ancestry. Among all the variants in G&H, 26.2% are absent from gnomAD, a further 24.4% are in gnomAD but not in the non-Finnish European (NFE) subset, and a further 18.8% have >10-fold higher AF in G&H compared with gnomAD-NFE (Fig. 1c). Compared with gnomAD-NFE, 325,276 variants were significantly enriched in 17,172 unrelated individuals of G&H (Methods) (Fisher’s exact test P < 4.93 × 10⁻⁸ with Bonferroni correction).
a, Number of all variants, including SNVs and INDELs, broken down by functional category. b, AF spectrum of all, pLoF-HC and pDM variants. c, Proportions of variants completely absent in gnomAD, absent in the NFE subset of gnomAD, or with 10×, 5× or 2× greater AF compared with gnomAD-NFE. The gray portion includes variants in both G&H and gnomAD with comparable AF. d, South Asian ancestry breakdown in G&H and subpopulation structure among British Pakistanis. For the British Pakistani subpopulations in light purple, the width indicates the relative proportion of clusters, and the height indicates the IBD score in the clusters.
G&H consists of British residents of self-identified Pakistani (40%) and Bangladeshi (59%) ancestry (Fig. 1d). The cohort has a high rate of self-reported parental relatedness (22.8% related; 15.1% first cousins) and autozygosity. Compared with the European-ancestry subset of UKB, the genetically determined rate of consanguinity (offspring of second cousins or closer) was higher in G&H (33% compared with 2%), and so was the average fraction of the genome in runs of homozygosity (1.8% compared with 0.4%)17. Principal component analysis demonstrates that there is considerable population structure among the British Pakistanis but much less among the British Bangladeshis23 (Supplementary Fig. 1). The population structure of British Pakistanis is strongly influenced by the biraderi social stratification system and is characterized by extensive identity-by-descent (IBD) sharing due to founder effects24. Using an IBD-based clustering method24 (Methods), we identified 21 clusters among 8,109 unrelated British Pakistani individuals (Fig. 1d, Supplementary Figs. 1 and 2, and Supplementary Table 1) representing putative subgroups. Several clusters have particularly extensive IBD sharing (Fig. 1d and Supplementary Fig. 2). We identified 15,200 variants that were significantly enriched in specific clusters compared with all the others combined, which may have resulted from founder events or possibly positive selection, described further in Supplementary Note 1 (Supplementary Figs. 2 and 3, and Supplementary Tables 2 and 3).
There were 8,450 variants across 2,855 genes that were curated as pathogenic or likely pathogenic (PLP) in ClinVar25 and had at least one heterozygous or homozygous genotype in G&H exomes (Supplementary Note 2, Supplementary Fig. 4a and Supplementary Table 4). Among the 81 clinically actionable genes defined by the American College of Medical Genetics and Genomics26 (ACMG SF v3.2), we found 1,012 individuals heterozygous for PLP variants in autosomal dominant genes and 7 individuals homozygous for PLP variants in autosomal recessive (AR) genes. Including pLoF variants that are previously unannotated by ClinVar in genes with a known loss-of-function mechanism further increased these numbers (Supplementary Note 2). Compared with a size-matched subset of European-ancestry exomes from UKB (UKB-EUR), a smaller portion of pLoF and pDM variants in G&H were already present in ClinVar, and a smaller portion of those in ClinVar were annotated as pathogenic or of uncertain significance (Supplementary Note 2, Supplementary Fig. 4b,c and Supplementary Table 5). These presumably reflect the relative paucity of patients of South Asian ancestry who have undergone clinical sequencing, as well as potential geographical differences in the practice of reporting variants to ClinVar.
Rare variant association analyses
Exome-wide association analyses across 645 EHR-derived traits
We performed exome-wide association analyses using REGENIE27 for 54 quantitative traits extracted from routine clinical and laboratory measurements and 591 binary traits derived from diagnosis and clinical procedure codes (Supplementary Table 6 and Supplementary Methods). Given that many phenotypes, variants and gene masks are correlated, we performed permutations at the second step of REGENIE to determine the P-value threshold corresponding to a false discovery rate (FDR) of 5% (Supplementary Methods) rather than applying an overly conservative Bonferroni correction (P < 0.05/1,122,594,120 tests = 4.45 × 10⁻¹¹) (see Supplementary Note 3 for comparison). We permuted the genotypes instead of the phenotypes to control for the fine-scale population structure and relatedness in the samples. There was minimal genomic inflation in the summary statistics, indicating that REGENIE was adequately controlling for these potential confounders (Supplementary Note 4 and Supplementary Table 7).
In total, we found 2,982 single-variant and 907 gene-based associations (FDR <5%; Supplementary Tables 8 and 9). Among the significant single-variant associations, 265 involved variants that are significantly enriched in specific British Pakistani subpopulations, and 218 out of these 265 (82%) involved human leukocyte antigen (HLA) variants (Supplementary Note 1). We removed associations involving HLA variants/genes, synonymous gene masks and associations that were not significant after conditioning on nearby genome-wide association study (GWAS) associations, resulting in the final set of 1,191 single-variant and 722 gene-based associations (Extended Data Fig. 1). These included many known gene–phenotype relationships, and in many cases, variants that were either private or enriched in G&H further expanded the allelic series (Supplementary Note 4 and Supplementary Fig. 5). We attempted replication of the significant associations from G&H in an independent set of 11,863 exomes from G&H (G&H 12k) and in the 430,998 European-ancestry exomes of UKB28. For single-variant and gene-based associations, respectively, we replicated 86.3% and 85.8% at nominal P < 0.05 and 40.2% and 66.7% at Bonferroni-corrected P < 0.05 in either replication dataset (Extended Data Fig. 2, Supplementary Table 10 and Methods).
We assessed whether gene–phenotype pairs with significant associations in G&H have previously been implicated by GWAS or rare variant association studies (Methods). The single-variant and gene-based associations involved 169 unique gene–phenotype pairs for quantitative traits and 40 for binary traits (Supplementary Fig. 6). Among these 209 gene–phenotype pairs, 66 (32%) did not have prior genetic associations, and we term these ‘novel’ (Supplementary Table 11). Variants that are absent in gnomAD or enriched in G&H tended to be rarer and have larger effects on the phenotypes, driving many novel gene–phenotype relationships (Fig. 2a,b). Specifically, among pLoF/pDM single-variant associations, variants in lower minor AF (MAF) bins were more likely to implicate novel gene–phenotype pairs (Cochran–Armitage test, z = 3.37, P = 7.50 × 10⁻⁴; Fig. 2c), as were variants absent from gnomAD (Fisher’s exact test, odds ratio (OR) 5.31, P = 0.026; Fig. 2d).
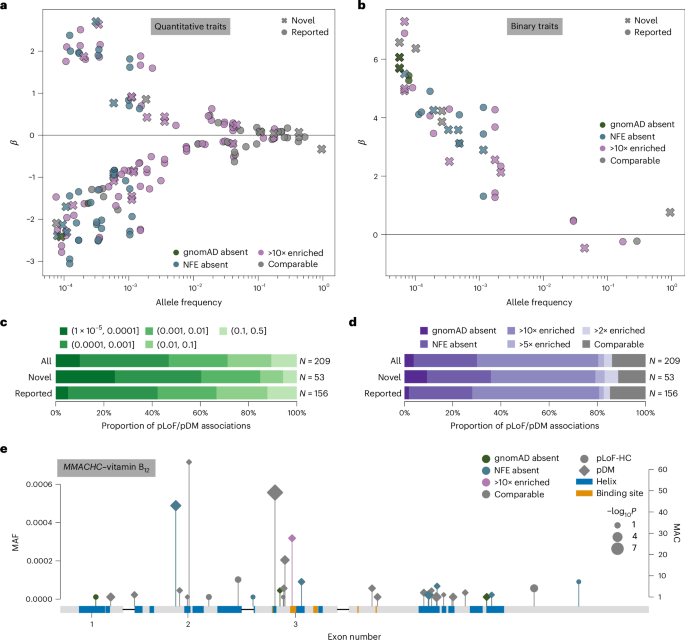
a,b, Single-variant MAF versus effect size (β) for significant quantitative (a) and binary (b) trait associations. Circle markers, pLoF variants; diamond markers, pDM variants; dark marker outlines, novel gene–phenotype association; purple marker colors, G&H MAF enrichment. c, Proportion of pLoF and pDM single-variant associations annotated as novel or previously reported, stratified by MAF bin. d, Proportion of pLoF and pDM single-variant associations annotated as novel or previously reported, stratified by AF ratio between G&H and gnomAD-NFE. e, pLoF-HC and pDM variants in MMACHC with MAF <0.001 that were included in the gene-based test with significant burden association with vitamin B12 levels. Purple marker colors, G&H MAF enrichment; circle markers, pLoF variants; diamond markers, pDM variants. Blue and orange boxes indicate UniProt alpha helices and binding sites, respectively. Marker size indicates −log10P values from the association tests for individual variants; this is on a continuous scale, with just three representative marker sizes shown in the legend.
We highlight two associations that are driven by variants private to or enriched in G&H (for further details, see Supplementary Note 4). First, we identified novel associations between three rare (MAF <0.2%) pDM variants in ABCB6 and increased serum potassium levels. ABCB6 encodes an erythrocyte membrane ABC transporter, and rare ABCB6 missense variants have been reported to cause autosomal dominant pseudohyperkalemia, a temperature-dependent passive leak of red blood cell potassium into plasma29. One variant, p.Arg375Trp (chr2-219216028-G-A), is highly enriched in G&H (MAF 3.4 × 10⁻⁴) compared with gnomAD-NFE (MAF 8.5 × 10⁻⁷) and coincides with a previously reported pedigree for pseudohyperkalemia from East London30. Among these three pDM associations, one replicated at Bonferroni-corrected P < 0.05, another replicated at nominal P < 0.05, and the last was too rare to test in the G&H 12k replication cohort. Another example is the association between the pLoF/pDM burden of MMACHC and vitamin B12 levels (P = 1.61 × 10⁻¹¹, β = 0.49) with nominal replication in G&H 12k (P = 0.004). MMACHC encodes a vitamin B12 transporter, and rare MMACHC mutations cause a vitamin B12 disorder, methylmalonic aciduria and homocystinuria, cblC type31. A noncoding variant 12 kb upstream has been linked to homocysteine levels32, and a previous study reported a single MMACHC missense variant associated with B12 levels33; here, we report multiple coding variants in MMACHC associated with vitamin B12 levels, illustrating a compelling allelic series. Among the 33 variants in the burden, 3 are absent in gnomAD, 8 are absent from gnomAD-NFE, and 1 is 187-fold more frequent in G&H (MAF 3.18 × 10⁻⁴) compared with gnomAD-NFE (MAF 1.70 × 10⁻⁶) (Fig. 2e).
Meta-analyses of 33 cardiometabolic traits with UKB
Cross-ancestry meta-analysis may benefit from increased allelic diversity within a gene and number of carriers leading to improved statistical power for discovery. Because British Bangladeshi and Pakistani communities have the highest prevalence of cardiometabolic diseases in the UK34, we performed meta-analyses for select cardiometabolic traits between 44,028 G&H participants and 409,499 European-ancestry UKB participants (Methods).
From single-variant analyses, we identified 1,738 significant associations with consistent effect direction between G&H and UKB (P < 3.3 × 10⁻⁸ for binary traits, P < 7.5 × 10⁻⁹ for quantitative traits), 399 of which were not identified in either cohort alone (Supplementary Table 12). There were 146 associations for pLoF or pDM variants, 24 of which only became significant in the meta-analysis (Fig. 3a). From gene-based analyses, we identified 577 significant associations (P < 3.5 × 10⁻⁸ for binary traits, P < 4.5 × 10⁻⁷ for quantitative traits), comprising 139 unique gene–phenotype pairs (Supplementary Table 13). Among these, 21 rose to significance only in the meta-analysis (Fig. 3b). In both single-variant and gene-based analyses, the benefit of meta-analysis was particularly prominent for binary traits, with 41% and 50% of the significant associations, respectively, being only identified in the meta-analysis.
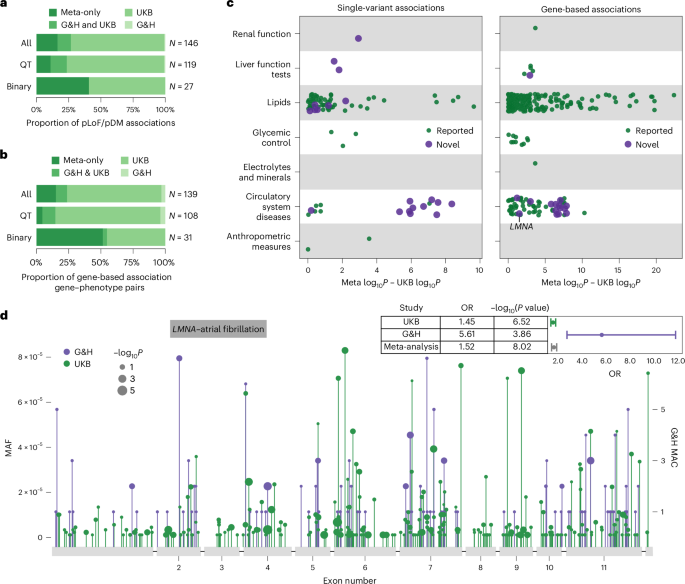
a,b, Proportion of pLoF and pDM single-variant associations (a) and proportion of gene–phenotype pairs with gene-based associations (b) stratified by the significance status in respective studies and by quantitative (QT) and binary traits: only in the meta-analysis; in both G&H and UKB; in UKB only; or in G&H only. c, Difference in −log10 association P values between the meta-analysis and the UKB-only analysis for significant single-variant pLoF/pDM associations (left) and gene-based associations (right) from the meta-analysis. Marker color indicates that the gene–phenotype association is annotated as novel. d, Lollipop plot displaying the location of all pLoF and missense variants with MAF <0.0001 in LMNA in G&H (in purple) and UKB (in green). The y axis represents the MAF or MAC. The marker size corresponds to −log10P values from the association tests for individual variants; this is on a continuous scale, with just three representative marker sizes shown in the legend. The forest plot in the top right corner shows the ORs and P values from G&H, UKB and meta-analysis for the gene-based association between LMNA and atrial fibrillation.
To explore the degree of power gain G&H contributed to the meta-analysis, we compared the P values from the meta-analysis with those from UKB alone (Fig. 3c,d and Extended Data Fig. 3). The greatest power gain was seen for binary traits related to circulatory system diseases in both single-variant and gene-based results. In fact, the associations for these circulatory system diseases had stronger P values in G&H compared with UKB, despite the nearly 10-fold difference in sample size between the two cohorts (Supplementary Fig. 7) and lower case prevalence in G&H compared with UKB (Supplementary Table 6). Both the frequency and effect size of the variants were greater in G&H compared with UKB (Supplementary Fig. 7), probably contributing to the stronger P values. This suggests that power gain in cross-ancestry meta-analysis can be influenced not only by the difference in variant frequency spectrum but also by the difference in variant penetrance between ancestry groups.
Among the 21 and 24 gene–phenotype pairs newly implicated by gene-based and single-variant meta-analyses, 14 and 13 were novel, respectively. One notable example is the association between the pLoF/pDM burden of LMNA and atrial fibrillation and flutter (OR 1.52, P = 9.5 × 10⁻⁹) driven by rich allelic diversity in G&H and UKB (Fig. 3d). Interestingly, the effect size of the burden was much greater in G&H than in UKB (heterogeneity P = 5.51 × 10⁻⁴) (Fig. 3d). A smaller candidate gene study has suggested a potential link between LMNA and lone atrial fibrillation35; here, we report evidence from unbiased genetic association analyses. This association was minimally affected by the removal of individuals with dilated cardiomyopathy (I42), a rare condition previously linked to LMNA, from the analysis. Another example is the association between ADCY6 singleton pLoF-HC burden and intracerebral hemorrhage (OR 326, P = 3.7 × 10⁻⁹). ADCY6 encodes a member of the adenylyl cyclase protein family and plays an important role in maintaining a homeostatic contractile state of smooth muscle cells in the vessel wall and in regulating blood pressure36, which may explain its association with intracerebral hemorrhage. Biallelic mutations (mostly missense and one splice donor) in this gene have been reported to cause a lethal congenital contractures syndrome37 (Online Mendelian Inheritance in Man (OMIM) 616287). Lastly, a rare stop-gain variant (chr14-22773945-G-A, p.Arg473Ter) in SLC7A7 was associated with atherosclerosis (OR 74.28, P = 4.7 × 10⁻⁹). This variant is pathogenic in ClinVar for lysinuric protein intolerance, a rare AR genetic disorder caused by impaired metabolism of lysine. Dysregulation in lysine metabolism has been linked to cardiometabolic pathophysiology38,39, which may influence the risk of atherosclerosis.
Recessive burden analyses with biallelic genotypes
High autozygosity in G&H can provide greater statistical power for recessive association analyses, which have been relatively less explored40,41,42,43. There were 13,821 and 110,194 homozygous genotypes for pLoF and pDM variants with MAF <5%, respectively (Supplementary Table 14). We performed statistical phasing (Supplementary Methods and Supplementary Fig. 8a) to identify compound heterozygous genotypes43, further increasing the number of biallelic pLoF and pDM genotypes by 45% (Extended Data Fig. 4a and Supplementary Table 14). Individual genotypes were then collapsed into three gene burdens, one with biallelic pLoF genotypes alone, another with biallelic pLoF and pDM genotypes, and the third with biallelic synonymous genotypes as negative control. We estimated that, on average across all genes that had at least one biallelic pLoF or pDM genotype, the high autozygosity resulted in 2.44-fold increase in the total number of biallelic genotypes compared with what would be expected under Hardy–Weinberg equilibrium. In Supplementary Note 5 and Supplementary Fig. 9, we illustrate the increase in the statistical power for recessive effects that we gain from autozygosity given a range of parameters. Using REGENIE27, we performed a recessive gene-based test with gene burdens with at least 4 biallelic carriers for 54 quantitative and 439 binary traits (Supplementary Table 6).
We found 13 significant associations under the recessive model (P < 2.89 × 10⁻⁷, FDR ~7.14%; Supplementary Fig. 8b, Supplementary Table 15 and Supplementary Methods), many of which had stronger P values and effect sizes under the recessive model than under the additive model (Supplementary Fig. 10). To identify associations with non-additive effects, we tested for dominance deviation by jointly modeling the additive and dominant effects (Methods). Three associations had significant dominance deviation (Pdomdev < 0.05/13 = 0.0038) with a clear recessive phenotypic pattern (Extended Data Fig. 4b,c) and had no prior associations linking the gene to the phenotype. First is an association of NLRP10 with viral pneumonia (Prec = 6.11 × 10⁻⁸; Pdomdev = 0.0028) (Extended Data Fig. 4b) along with a suggestive association with ‘viral agents causing diseases classified elsewhere’ (Prec = 4.01 × 10⁻⁶; Pdomdev = 0.0028), consistent with a key role of NLRP10 in the inflammasome pathway44. Next, HSD17B14, a gene involved in steroid hormone metabolism45 with possible indirect impact on bone health, was associated with disorders of bone density (Prec = 7.12 × 10⁻⁸; Pdomdev = 2.0 × 10⁻⁵) (Extended Data Fig. 4b). Lastly, we found an association between NCAPD2 and vitamin B12 (Prec = 2.60 × 10⁻⁷; Pdomdev = 2.48 × 10⁻⁴) (Extended Data Fig. 4c). NCAPD2 encodes a condensin I complex subunit essential for chromosome condensation46, and additional studies are needed to establish its relevance to B12 metabolism. More details on these and additional suggestive associations (Prec < 5.0 × 10⁻⁶) are provided in Supplementary Note 6 and Supplementary Table 15. Overall, these results suggest that increasing the sample size of biallelic carriers, especially those of rare variants, for recessive association testing may yield further novel findings that may be missed by additive association testing.
Insights from human knockouts
Discovery of 2,991 genes with putative human knockouts
G&H exomes, as expected, showed higher accrual rate of genes with one or more homozygous pLoF-HC genotypes compared with the ancestry groups in UKB that originate from populations with low consanguinity (Fig. 4a,b). In the 44,028 G&H exomes, we identified a total of 2,991 genes with biallelic pLoF genotypes, referred to as putative human knockouts (Supplementary Table 16): 2,951 genes with 8,144 homozygous genotypes and 249 genes with 473 compound heterozygous genotypes. Genes with biallelic loss in G&H were depleted among the genes that are essential in cell culture, knockout lethal in mice and implicated in AR diseases (Supplementary Note 8, Supplementary Fig. 11 and Supplementary Table 17).
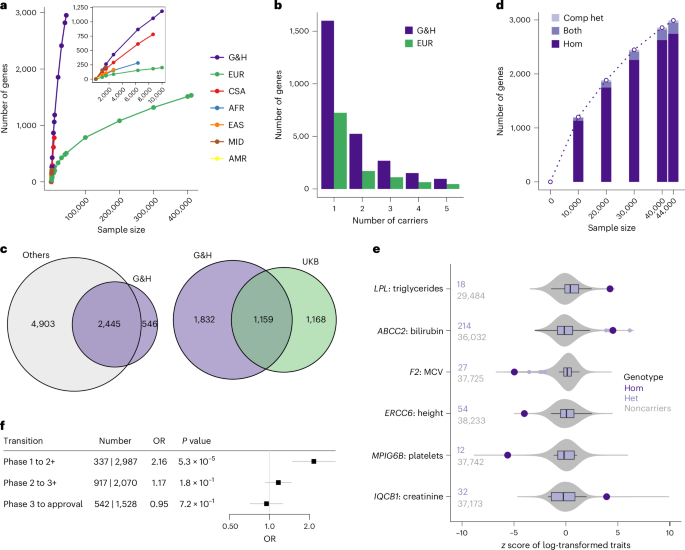
a, Accrual of genes with at least one homozygous pLoF genotype in G&H and UKB exomes stratified by ancestry groups. Inset: magnified data points for smaller sample sizes. EUR, European; CSA, Central/South Asian; AFR, African; EAS, East Asian; MID, Middle Eastern; AMR, admixed American ancestry. b, Number of genes with up to 5 pLoF homozygous genotypes in 44,028 G&H exomes and 469,814 European-ancestry exomes from UKB. c, Overlap of genes with human knockouts in G&H exomes compared with those in four other genomic datasets (left) or with those in UKB exomes (right). d, Accrual of genes with at least one human knockout (either homozygous or compound heterozygous (comp het) genotype) at increasing sample sizes of G&H exomes. e, Disease-relevant quantitative phenotypes in the homozygous carriers of pLoF variants in AR disease genes. Large points in dark purple indicate the lifetime median values of the homozygous (‘Hom’) carriers. Box plots in light purple show the distribution of values among the heterozygous (‘Het’) carriers. The center lines indicate the median values. The edges of the box indicate the first and third quartiles. The whiskers extend to the most extreme data points within 1.5 times the interquartile range. The points indicate the data points that fall outside the range of the whiskers. Gray violin plots show the distribution of the values among the noncarriers. The number of heterozygous carriers and noncarriers are indicated to the left of the plots. f, Enrichment analysis results for antagonistic drugs with human knockouts per clinical trial phase using logistic regression test. The centers and the error bars indicate the ORs and the 95% confidence intervals, respectively.
We compared the list of genes with human knockouts in G&H with those found in other genomic datasets, although some of these studies may not include phenotype information as detailed as that available in G&H. Aggregating across five datasets (gnomAD22 v4 exomes, which includes UKB, RGC-ME47, deCODE18, PROMIS19 and Born in Bradford16), there were 7,348 genes with human knockouts in approximately over 1.4 million individuals. Despite the much smaller sample size, 546 genes were found to have human knockouts only in G&H (Fig. 4c, left). We also found that 1,669 genes have human knockouts only in G&H compared with 2,327 genes with human knockouts in the 430,771 exomes of UKB28, a cohort with broadly accessible phenotypic information (Fig. 4c, right).
In G&H, unlike the ancestry groups with low consanguinity in UKB, the number of genes with human knockouts is growing close to linearly at the current sample size (Fig. 4a,d), suggesting that sequencing of additional individuals will identify more genes with biallelic loss. Because the average level of autozygosity is higher among British Pakistanis compared with British Bangladeshis17, sequencing British Pakistanis is generally expected to find more homozygous pLoF genotypes. However, there is slightly reduced genetic diversity in Pakistanis compared with Bangladeshis, resulting from the historic bottleneck events mentioned above24. We found that, when conditioned on the level of autozygosity and sample size, sequencing British Bangladeshis can maximize the number of unique pLoF variants (and genes) with at least one homozygous genotype, while sequencing British Pakistanis can maximize the number of pLoF variants with more than one homozygous genotype (Supplementary Note 7, Supplementary Fig. 12 and Supplementary Methods).
Clinical utility of human knockouts in variant interpretation for AR disease genes
The high autozygosity and rich phenotypic information in G&H can facilitate the assessment of the clinical impact of variants in AR disease genes.Although pLoF variants in disease genes with a known loss-of-function mechanism are often automatically classified as likely pathogenic, computational predictions may be erroneous22. We found 368 Mendelian disease genes with AR inheritance48 that have individuals homozygous for pLoF variants in G&H (Supplementary Fig. 4d and Supplementary Table 18). Among these pLoF variants, 63% are unreported in ClinVar and 12% have uncertain significance or conflicting interpretations (VUS/CI). We inspected the health records of the homozygous carriers of these variants and identified several examples where they provided supporting evidence that the variants are indeed pathogenic (Supplementary Table 19). One example is a stop-gain variant in LPL (chr8-19955849-C-T, p.Gln262Ter) with conflicting interpretations in ClinVar. Loss of this gene causes lipoprotein lipase deficiency (OMIM 238600) characterized by highly elevated serum triglycerides and ectopic lipid deposition. One homozygous carrier of this variant had significantly elevated serum triglyceride levels from their early 30s (lifetime median of 15.7 compared with 1.5 mM among the rest of the cohort; z-test P = 2.22 × 10⁻⁵), lowered high-density lipoprotein cholesterol levels (0.4 versus 1.2 mM; z-test P = 3.47 × 10⁻⁶), diagnostic codes for E78 (disorders of lipoprotein metabolism) and other related complications including K85 (acute pancreatitis), type 2 diabetes, and steatohepatitis, and prescriptions of Omacor tablets (omega-3-acid ethyl esters used for hypertriglyceridemia). Another example is a frameshift variant in ABCC2 (chr10-99818879-CCT-C, p.Leu788ValfsTer13) with conflicting interpretations in ClinVar. Loss of this gene is implicated in Dubin–Johnson syndrome (OMIM 237500) with clinical manifestation of chronic cholestatic jaundice. One homozygous carrier of this variant had persistently raised bilirubin from their early 30s (56 versus 7 μM; z-test P = 6.06 × 10⁻⁶) and diagnosis codes for E80 (disorders of porphyrin and bilirubin metabolism). This phenotypic profile is comparable to that observed in another homozygous carrier of a likely pathogenic splice donor variant (chr10-99792360-G-A), including consistently elevated serum bilirubin from their mid-20s (65 versus 7 μM; z-test P = 1.17 × 10⁻⁶) and diagnoses codes for E80, K76 (other disorders of liver) and steatohepatitis. Of note, the quantitative phenotypes relevant to the implicated diseases displayed clear recessive patterns (Fig. 4e), confirming the AR nature and the need for homozygous carriers to assess the clinical impact of these variants. These results illustrate G&H as a unique resource to guide variant interpretation for AR disease genes based on the abundance of homozygous genotypes and medical records.
Insights into drug development from human knockouts
The presence of human knockouts without major adverse health outcomes suggests that complete lifelong loss of the gene is compatible with viability and that therapeutic antagonism of the gene may likewise be safe and well tolerated14,16,20. Using the drug dataset from Open Targets (v23.12)49, we examined the enrichment of drugs with human knockouts in their target genes over those without per clinical trial phase transition (Methods). Among 3,324 drugs with antagonistic modes of action, drugs with human knockouts were 2.2 times more likely to transition past phase 1 (P = 5.3 × 10⁻⁵), the primary focus of which is safety and tolerability (Fig. 4f). This pattern was specific to phase 1 transition, drugs with antagonistic modes of action and drugs with non-oncology indications (Supplementary Fig. 13a and Supplementary Table 20). A comparable association was observed when the analysis was restricted to drugs with a single target gene and when enrichment was examined for drugs with human knockouts in all target genes versus in any target gene (Supplementary Fig. 13b and Supplementary Table 20).
Phenotypic profiles in human knockouts can help inform the therapeutic benefits anticipated by antagonizing a gene. For example, SLC10A2, a bile acid transporter, is targeted by several small-molecule inhibitors primarily to treat biliary diseases. We observed that two individuals homozygous for a frameshift variant (chr13-103052648-CA-C, p.Trp186GlyfsTer23) in SLC10A2 have markedly reduced low-density lipoprotein (LDL) cholesterol levels (50.3 and 36.3 compared with 106.3 and 116.0 mg dl−1 among matched noncarriers; z-test P = 6.3 × 10⁻³ and 6.2 × 10⁻⁶, respectively). This is consistent with the significant LDL-cholesterol reduction (13.4–27.0 mg dl−1) observed in the clinical trials of SLC10A2 inhibitors50,51,52,53,54. Notably, we observed minimal alteration in the LDL-cholesterol levels among the heterozygous carriers (114.1 compared with 116.0 mg dl−1 among noncarriers, regression P = 0.93 adjusting for relevant covariates), suggesting that close to complete loss of SLC10A2 action may be necessary to yield changes in LDL-cholesterol levels. Another example is APOC3, which is targeted by several antisense oligonucleotide drugs to treat hypertriglyceridemia based on its well-understood role in triglyceride metabolism. Consistent with previous reports19, we found that one individual homozygous for a stop-gain variant (chr11-116830637-C-T, p.Arg19Ter) in APOC3 had a 62% lower triglyceride level (49.6 compared with 131.1 mg dl−1 among matched noncarriers, z-test P = 0.036), the magnitude of which is comparable to the range of maximal triglyceride reductions (44–77%) reported in clinical trials of APOC3 inhibition55,56,57.
Phenotypic information on human knockouts can also inform the potential safety issues of antagonizing a gene. One example is HSD17B13, which is targeted by several RNA interference therapeutics for the treatment of non-alcoholic liver diseases based on a gene–phenotype association identified through genetic studies58. HSD17B13 belongs to the hydroxysteroid (17b) dehydrogenase superfamily involved in steroid metabolism, raising potential risks for reproductive health. We found four (including one from G&H 12k) individuals homozygous for two frameshift variants (chr4-87318347-ATCTCT-A, p.Glu98AspfsTer14 and chr4-87313944-CG-C, p.Ala192AspfsTer14) in HSD17B13. Three female carriers had medical records indicating successful pregnancy, with one reporting four healthy pregnancies and children at a follow-up research visit. This suggests that the absence of HSD17B13 does not severely impact the reproductive potential or pregnancy in females. The remaining male carrier’s health record was unremarkable. Overall, this is consistent with the lack of major health or reproductive issues reported in phase 1 trials (NCT04565717 and NCT04202354), which included both male and female participants of reproductive age59,60. Another example is IGF1R, which is targeted by several small-molecule inhibitor or antibody drugs for cancer indications. Hyperglycemia was reported as an adverse drug reaction for two inhibitory antibody drugs, while hypoglycemia was reported as a reason for early termination of a trial that tested recombinant IGF1, a ligand of IGF1R (NCT00330668). We found that one individual homozygous for a frameshift variant (chr15-98957361-CGA-C, p.Arg1343ThrfsTer30) in IGF1R has markedly higher HbA1c levels (89 compared with 40 mmol mol−1 among matched noncarriers, z-test P = 4.3 × 10⁻⁴, or 47 mmol mol−1 among the diabetic subset, z-test P = 0.023) despite being prescribed three glucose-lowering medications at maximal doses. HbA1c levels were only mildly elevated among the six heterozygous carriers (41 compared with 38 mmol mol−1 among noncarriers, regression P = 0.087 adjusting for relevant covariates), consistent with the minor increase (1.1 mmol mol−1) observed among the heterozygous carriers of rare damaging missense variants in UKB61.
These results show that the presence of human knockouts and detailed review of their phenotypes can provide meaningful insights for drug development, enabling the assessment of efficacy and possible safety risks of therapeutically targeting a gene.
First Appeared on
Source link

