First atlas of brain organization shows development over a lifetime
The regions of the brain that act in concert change as a person matures. Credit: Microscape/SPL
Scientists have created the first atlas of specific key patterns of brain ‘chatter’ and determined how these patterns change over the entire human lifespan1.
The comprehensive guide draws on brain scans from almost 3,600 people, ranging from infants to centenarians. It maps a property called functional connectivity, which describes the level of coordination between separate brain regions. The data suggest that in young adults, particular patterns of this connectivity are linked to cognitive performance.
Such a guide could be useful for understanding when developmental issues and neurodegenerative conditions emerge, says Jakob Seidlitz, a neuroscientist at the University of Pennsylvania in Philadelphia, who was not involved in the research. “This is an important contribution to the field,” he adds.
The findings were published today in Nature.
Brain power
The brain is a noisy place. Sometimes two brain regions that are far apart are active at the same time, suggesting that they work together to support the same function. Such regions are said to be functionally connected, even though they do not necessarily sit close to each other in the brain.
To understand how this functional connectivity is organized, brain areas are plotted along a scale, or axis, on the basis of their connectivity patterns with the rest of the brain, says study co-author Patrick Taylor, a computer scientist at the University of North Carolina at Chapel Hill who focuses on neuroscience. There are three main functional axes. The sensory-to-association axis, for example, allows researchers to describe brain regions that lie along a continuum from those that focus mainly on processing sensory information to those that are engaged in sophisticated processes such as integrating sensory information into complex thought. The brain regions at each point along the axis have similar patterns of connectivity.
Your brain expands and shrinks over time — these charts show how
At one end of the sensory-to-association axis are brain regions that are heavily involved in sensory processing and that link mainly to other parts that have the same function. At the other end of the scale are brain areas that support higher-level information processing and are connected to a wide variety of other regions. In the middle of the axis are brain regions that act as transition zones linking sensory processing to more abstract thought. This means that these regions are functionally connected to both sensory networks and those involved in complex thought.
Scientists have long sought to understand how this organization arises in the developing human brain. A growth chart2 for brain tissue was published in 2022, but creating similar guides for functional connectivity has proven a challenge.
Previous studies have tracked how functional axes change during various life stages, but no study has captured how all three of the main functional axes develop and evolve over the full human lifespan, says study co-author Pew-Thian Yap, a radiologist at the University of North Carolina at Chapel Hill. “That itself is very important for us to understand the function of the human brain,” says Yap.
Across the lifespan
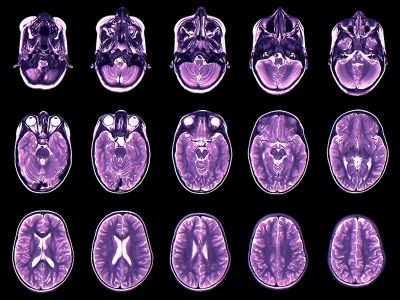
To fill this gap, Taylor, Yap and their colleagues analysed functional magnetic resonance imaging (fMRI) scans — which reveal brain activity — of 3,556 people between the ages of 16 days and 100 years old. The researchers tracked how the three main functional scales developed and changed at different ages.
First Appeared on
Source link

