Genome-wide association analyses highlight the role of the intestinal molecular environment in human gut microbiota variation
Ethical considerations
The current study has been approved by the Swedish Ethical Review Authority (DNR 2022-06137-01, DNR 2024-01992-02). All participants in the respective studies below provided written informed consent. The Swedish Ethical Review Board approval numbers are: SCAPIS (DNR 2010-228-31M), SIMPLER (DNR 2009/2066-32, DNR 2009/1935-32, DNR 2010/0148-32, DNR 2014/892-31/3), MDC (DNR 532/2006, DNR 51-90) and MOS (DNR 2012-594). The PPP-Botnia study received approval from the Ethics Committee of Helsinki University (approval number 608/2003). The HUNT study was approved by the local ethical review board (Regional committee for medical and health research ethics, Central Norway; REK-656785).
Discovery studies
SCAPIS
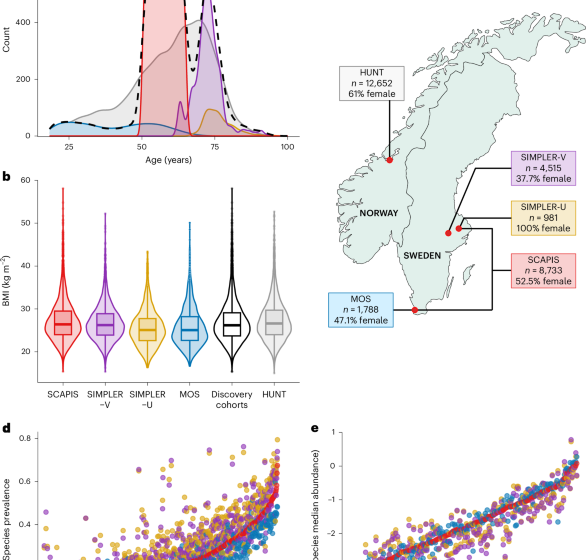
SCAPIS56 is a multicenter cohort comprising 30,154 people aged 50–65 years. For this analysis, 8,733 participants of European ancestry from the Malmö and Uppsala sites with both gut microbiome and genotype data were included. At baseline, participants provided blood samples during the first visit and were asked to collect stool samples at home, storing them at −20 °C until samples were brought to the study center at the second visit for storage at −80 °C. DNA extracted from whole blood was used for genotyping. Birth year and sex were obtained from the Swedish population register. Information on dispensed antibiotics (Anatomical Therapeutic Chemical code J01) in the past 6 months was obtained from the Swedish Prescribed Drug Register. BMI was defined as weight divided by height squared (kg m−2). Habitual alcohol and fiber intakes were estimated from a food frequency questionnaire (g day−1)57. Smoking behavior was assessed using a questionnaire and defined as current, former and never smoker.
SIMPLER-Västmanland and SIMPLER-Uppsala
The Swedish Infrastructure for Medical Population-Based Life-Course and Environmental Research (SIMPLER; https://www.simpler4health.se/w/sh/en) includes data from two large, ongoing population-based studies: the Cohort of Swedish Men (COSM) and the Swedish Mammography Cohort (SMC)58. The COSM initially enrolled 48,850 men born between 1918 and 1952 living in Västmanland and Örebro counties in 1997. The SMC enrolled 66,651 women by sending invitations to all women born between 1914 and 1948 living in Uppsala and Västmanland counties between 1987 and 1990. The current analysis is based on a subsample selected randomly from these studies who were invited for clinical examination with genotype and gut microbiome data: SIMPLER-Västmanland (SIMPLER-V) and SIMPLER-Uppsala (SIMPLER-U). SIMPLER-V includes 4,515 COSM and SMC participants from Västmanland examined between 2010 and 2019. SIMPLER-U includes 981 women from the county of Uppsala, examined between 2003 and 2009 (no stool collected) and re-examined between 2015 and 2019 (stool collected). Participants were asked to collect stool samples at home and store them at −20 °C until they were brought to the test center, where samples were stored at −80 °C. For 115 SIMPLER-V participants, the examination was conducted at home. DNA for genotyping was extracted from whole-blood samples. Information on dispensed antibiotics in the past 6 months was obtained from the Swedish Prescribed Drug Register.
Malmö offspring study
The Malmö offspring study (MOS) includes participants aged ≥18 years who are children or grandchildren of participants from the Malmö Diet and Cancer Study (MDC)—cardiovascular cohort, a subset of the larger MDC59. Data collection in MOS began in 2013 and included 4,721 participants by 2020. The current study included 1,788 participants with genotype and gut microbiome data who attended baseline measurements between 2013 and 2017. Stool samples were collected and stored in home freezers (−20 °C) until they were brought to the study sites, where they were stored at −80 °C in the biobank. DNA for genotyping was extracted from whole-blood samples. Demographic information was collected using a questionnaire. Antibiotic use was self-reported and was also derived from the Swedish Prescribed Drug Register. Participants who were also part of SCAPIS were excluded from the MOS data.
Replication cohort
Norwegian Trøndelag Health Study
The Trøndelag Health (HUNT) study is a long-term population-based health investigation conducted in the Trøndelag county, Norway60,61. Four surveys have been used to collect data and biological samples from participants between 1984 and 2019. Approximately 230,000 people have participated in at least one survey. Of these, around 88,000 participants have undergone genotyping62. Among the 56,042 participants in the HUNT4 survey, 13,268 submitted stool samples for gut microbiome analysis on a filter paper. We included data from 12,652 HUNT4 participants of European descent having both genetic and gut microbiome data available. Sequencing and bioinformatic processing were performed analogously to SCAPIS and MOS at Cmbio (Copenhagen, Denmark).
BMI and age distribution were compared between studies with density plots. A map depicting the study sites was generated with the maps v.3.4.2.1 R package. Other studies (MDC, PPP-Botnia) are described in the Supplementary Note.
Genetic analysis
Genotyping and imputation
DNA extraction, genotyping, pre-imputation quality control and imputation were performed separately in each cohort (SCAPIS, SIMPLER, MOS and HUNT) using high-density Illumina genotyping arrays and standard pipelines for variant calling and quality filtering. Quality control steps removed samples with poor genotyping quality, sex discrepancies, non-European ancestry and markers with high missingness or implausible allele frequencies. Imputation was performed using standard algorithms (EAGLE, minimac, PBWT) at established imputation servers against the Haplotype Reference Consortium (HRC) r1.1 panel. Detailed protocols for each cohort are provided in the Supplementary Note.
Validation of genotypes using Sanger sequencing
Direct genotyping using Sanger sequencing was performed to confirm the variants in rs10836441 (OR51E1–OR51E2 locus) and rs4556017 (MUC12 locus). Details are given in the Supplementary Note.
Stool DNA extraction and metagenomic sequencing
SCAPIS, MOS and HUNT
Stool DNA extraction and quality control for SCAPIS and MOS were performed by Cmbio and described in Sayols-Baixeras et al.63. In brief, samples were randomized on the box level, and DNA was extracted using the NucleoSpin 96 Soil extraction kit (Macherey–Nagel). DNA extraction quality was evaluated using agarose gel electrophoresis. One negative and one positive (mock) control were added to each batch. DNA was quantified with fluorometric techniques both after DNA extraction and after library preparation. DNA extraction and quality control in samples from HUNT have been described in detail in Grahnemo et al.64. In brief, three 6-mm disks were punched out from each filter card into a well. DNA was isolated using the Microbiome MagMAX Ultra kit (Thermo Fisher Scientific) after bead-beating. For all three studies, genomic DNA was fragmented and used for library construction using the NEBNext Ultra Library Prep Kit from Illumina. The prepared DNA libraries were purified and evaluated for fragment size distribution. Libraries from stool DNA were sequenced using the Illumina Novaseq 6000 instrument using 2 × 150-base-pair paired-end reads, generating on average 26.0, 25.3 and 22.9 million read pairs, respectively, in SCAPIS, MOS and HUNT, with 97.8% of the sequenced bases having Phred quality score >20 in SCAPIS and MOS, and more than 85% had a Phred quality score ≥30 in HUNT.
SIMPLER study
SIMPLER stool samples were thawed, a pea-size amount was aliquoted, and 800 µl of DNA/RNA Shield (Zymo Research) was added. These aliquots were refrozen and sent to the Centre for Translational Microbiome Research at the Karolinska Institute in Stockholm, Sweden for DNA extraction and metagenomic sequencing. DNA was extracted with the MagPure Stool kit (Magen Biotechnology). Each batch had one negative (DNA/RNA Shield) and one positive control (Zymo mock). Stool DNA was fragmented and used for library construction using the MGI Easy FS DNA Library Prep Set kit. The prepared DNA libraries were evaluated with a TapeStation D1000 kit (Agilent), and the quantity was determined by QuantIT HighSensitivity dsDNA Assay on a Tecan Spark (Tecan). Equimolarly pooled libraries were circularized using the MGI Easy Circularization kit (MGI Tech) and sequenced using 2 × 150 bp paired-end reads on the DNBSEQ G400 or T7 sequencing instrument (MGI) with an average yield of 51 million reads/sample.
Microbial taxonomic profiling
Read pairs mapped to the human reference genome GRCh38.p14 were removed using Bowtie2 (v.2.4.2)65 in SCAPIS, MOS and HUNT, and against GRCh38 using Kraken 2 (ref. 66) in SIMPLER. Remaining bioinformatic processing, calculation of relative abundances and microbial taxonomic annotation were performed for all studies, including HUNT, at Cmbio using the CHAMP profiler based on the Human Microbiome Reference HMR05 catalog12 (Supplementary Note). The taxonomic annotation was based on the Genome Taxonomy Database (GTDB) release 214 (release date: 28 April 2023). A rarefied species abundance table was produced by random sampling, without replacement, of 190,977 gene counts per sample in SCAPIS and MOS, and 641,964 gene counts per sample in SIMPLER. In total, 4,248 species were detected in the rarefied data in SCAPIS, 3,430 in MOS and 4,192 in SIMPLER-V, and 3,523 in SIMPLER-U. The alpha diversity measures—Shannon index, inverse Simpson index and richness—were calculated using rarefied data with the diversity function of the vegan R package (R v.4.3.1). Only the 921 species with prevalence >5% in all four studies were kept for the species-level analyses. Those detected in fewer than 50% of samples in at least one cohort based on nonrarefied data were converted into a binary present/absent variable. Those detected in more than 50% of samples in all four studies were rank-based inverse normal (RIN) transformed. Alpha diversity measures were also RIN-transformed, and, for significant findings, were also analyzed on a nontransformed scale for increased interpretability. The RIN transformation was performed separately for each cohort.
Analysis of scRNA-seq data
Gene expression data in cells derived from human duodenum, ileum and colon were obtained from Hickey et al.22, and mean gene expression was generated per their annotated clusters. The expression in EECs from human duodenal and ileal organoids was assessed as described23. Briefly, a yellow fluorescent protein was inserted downstream of the Chromogranin A promoter by CRISPR–Cas9 to label EECs. Fluorescent EECs were then isolated using flow cytometry and analyzed by 10× scRNA-seq. Gene expression in EECs from the murine gastrointestinal tract was analyzed with scRNA-seq, as described in Smith et al.24.
Statistical analysis
GWAS of microbiome composition
GWAS was performed separately for microbial alpha diversity and 921 species using REGENIE67 v.3.3 for each cohort (SCAPIS, SIMPLER-V, SIMPLER-U, MOS). A subset of the genotype datasets was created for the first REGENIE step to fit whole-genome regression models including only quality-controlled directly genotyped SNPs with MAF > 1% and Hardy-Weinberg equilibrium P < 1 × 10⁻¹⁵. For the second step, all variants with an information score >0.7 were included in association analyses performed using logistic regression for binary variables and genetic variants with MAF > 5% in all four cohorts, and linear regression for RIN-transformed variables and genetic variants with MAF > 1% in all four cohorts. Covariates were sex, age, age2, plate and genetic principal components (PC) 1–10. The PCs were calculated in unrelated samples, separately for each cohort, with PLINK68 using an LD-pruned dataset, and all samples were then projected onto these components. In SCAPIS and MOS, plate represents metagenomics DNA extraction plate, whereas in SIMPLER it means the metagenomic aliquoting plate. Plate, age and sex were included to increase precision and power. For SCAPIS, the site was accounted for by the plate variable because plates were nested into the site variable. Based on previous nonlinear associations between age and microbiome69 and our results from a naive linear model for the association between age and microbial species, we opted to include age also as age2. REGENIE accounts for population stratification, but to account for any residual bias, we also included genetic PCs 1–10 in the model70. Cohort-specific results were meta-analyzed using the inverse-variance weighted fixed-effects method in METAL71 v.2011-03-25. Independent loci were determined using LD clumping (r2 0.001, window 10 Mb) in PLINK68 v.2.00-alpha-5-20230923 with SCAPIS dosages used to determine the correlation structure. Variant-alpha diversity associations with P < 1.7 × 10⁻⁸ and variant-species associations with P < 5.4 × 10⁻¹¹ were considered study-wide-significant. This threshold was based on a Bonferroni correction of the conventional genome-wide threshold of 5 × 10⁻⁸ for three alpha diversity metrics and 921 species tested. Confidence intervals for the I2 statistic were calculated using the metagen function of the meta v.6.5-0 R package. The loci were annotated using the Open Targets Genetics72 v.22.10 database (variant index, variant to gene and variant to trait annotations). Heritability was determined using SumHer73 v.6 according to the GCTA heritability model, with SCAPIS dosages used to determine the correlation structure.
Sensitivity analyses
Sensitivity analyses were performed for the 149 genome-wide locus-species associations by (1) excluding participants with antibiotic use in the 6 months before sampling, (2) excluding participants with self-reported IBD, (3) retaining an unrelated subset where no participant had third degree relatedness or closer with any other participant using a KING-robust kinship estimator threshold of 0.0442, (4) retaining one random spouse in SIMPLER and one random participant living at the same address in MOS to assess cohabitation (SCAPIS was removed for this analysis), (5) using centered log ratio plus RIN transformation for species analyzed using linear regression, (6) using Firth correction for species analyzed using logistic regression, (7) removing age2 from the covariates, (8) analyzing SCAPIS-Uppsala and SCAPIS-Malmö as two separate cohorts in the meta-analysis and (9–12) adding BMI, alcohol intake, smoking or fiber intake, respectively, as covariates. The analyses adding alcohol, smoking and fiber were performed in SCAPIS only, where data on these variables were nearly complete.
External replication
Associations passing the study-wide threshold were assessed in HUNT by applying the same models as in the Swedish cohorts and using REGENIE with the same model specifications. We further assessed the validity of our findings using summary statistics from the published FINRISK9 and Dutch Microbiome Project7 studies. Details are given in the Supplementary Note.
GWAS of higher taxa
We also performed GWAS of 455 genera, 106 families, 50 orders, 21 classes, 17 phyla and 3 superkingdoms. Relative abundances were created for these higher-level taxa by summation of their respective species-level relative abundances. The 364 taxa detected in 5–50% of samples in each cohort were analyzed using logistic regression (absence/presence), and 288 taxa with prevalence >50% were analyzed using RIN-transformed relative abundances and linear regression. Study-wide significance was considered at P < 5.4 × 10⁻¹¹, the same level as for species.
GWAS of functional modules
Functional gut metabolic and gut–brain modules were attributed to species that contained at least two-thirds of the genes needed for the functionality of that module. If an alternative reaction pathway within a module existed, only one such pathway was required. All reaction pathways were required for modules with fewer than four steps. Module abundances were defined as the sum of the relative abundances of all species in a module. Similar to the GWAS of the species, two modules detected in 5–50% of samples in each cohort were analyzed using logistic regression (absence/presence) and 115 modules with prevalence >50% were analyzed using RIN-transformed relative abundances and linear regression. Study-wide significance was considered at P < 4.3 × 10⁻¹⁰.
Interaction analysis for ABO, secretor status and Lewis blood groups
Blood groups A, B, AB and O were determined based on allele combinations of ABO genetic variants rs505922 and rs8176746 (ref. 74), secretor status based on FUT2 genetic variant rs601338 (ref. 75) and Lewis status (positive, negative) based on allele combinations of FUT3 variants rs812936, rs28362459 and rs3894326 (ref. 75). Blood groups A and AB were combined into antigen A, and blood groups B and AB into antigen B. Mixed models were run for each cohort with species associated with ABO, FUT2 or FUT3–FUT6 at the study-wide significance level as outcome using the lmer (for species assessed with linear regression in the GWAS) and glmer (for species assessed with logistic regression in the GWAS) functions of the lmerTest v.3.1-3 R package. The interaction between antigen (ABO A, B or Lewis) and secretor status was estimated with covariates sex, age, age2, plate and genetic PCs 1–10. First-degree relatedness, determined by KING76 kinship coefficient ≥0.177, was used as a random effect. For the logistic mixed models, random and fixed effects coefficients were optimized in the penalized iteratively reweighted least squares step (setting nAGQ = 0). Cohort-specific results were meta-analyzed with the rma function of the metafor v.4.4-0 R package using the fixed-effect inverse-variance weighted method. Study-wide significance was considered at Bonferroni-corrected P < 3.3 × 10⁻³.
GWAS of GLP-1
After overnight fasting, GLP-1 levels were measured in MDC and PPP-Botnia study participants (Supplementary Note) before and 2 h after a 75-g oral glucose load. GWAS of GLP-1 was performed in 2,588 people with fasting and 2,613 with 2-h GLP-1 in MDC, and in 926 people with fasting and 898 with 2-h GLP-1 in PPP-Botnia. GLP-1 levels were log-transformed before analysis. SNPTEST77 v.2.5.6 was used for genome-wide association analyses, using the frequentist score method adjusted for age, sex and the genetic PC1-4. Results were filtered based on MAF > 0.01, Hardy-Weinberg equilibrium P > 5 × 10⁻⁷, and imputation info scores >0.4. A fixed-effect meta-analysis was performed using GWAMA78.
Functional mapping
Genetic variants associated with microbial alpha diversity or species at the genome-wide significant level were mapped to functional pathways using FUMA26 v.1.5.2. One (out of 2,353) variant without an rsID was removed. If a genetic variant was associated with several traits or was multiallelic, the trait or allele pair with the lowest P was used as input.
Colocalization
Pairwise colocalization analyses were performed to investigate whether microbial richness and the eight study-wide significant species colocalized in the identified study-wide significant loci and with sex hormone binding globulin, WHRadjBMI, LDL cholesterol, IBD, glucose and stool frequency. Details are provided in the Supplementary Note.
Mendelian randomization
We performed two-sample MR analyses to investigate bidirectional effects between specific species (C. saudiense, T. sanguinis, Intestinibacter sp9005540355) and BMI, WHR and LDL cholesterol. Details are provided in the Supplementary Note.
Plasma metabolomics
The plasma metabolomics analysis in SCAPIS has been described elsewhere79 and in the Supplementary Note. Associations of genetic variants with plasma metabolites were analyzed using the same REGENIE pipeline as for the microbiome, adjusting for age, age2, sex, delivery batch and genetic PCs 1–10. Metabolites detected in fewer than 100 samples were excluded. Those detected in 5–50% of samples were analyzed by logistic regression, and those in ≥50% of samples were RIN-transformed and analyzed by linear regression. We report one lead SNP per study-wide locus; when several species were associated, we selected the lead SNP among those replicated in HUNT, prioritizing the lowest P value in Swedish cohorts. FDR correction (Benjamini–Hochberg) of 5% was applied.
Stool metabolomics
To find stool metabolites associated with the study-wide significant loci, we downloaded GWAS of stool metabolites summary statistics (only P < 10−5 available) from Zierer et al.80 (Supplementary Table 16) and lifted the genomic coordinates over to GRCh37 using Ensembl Variation 112 for variants with an rsID and https://genome.ucsc.edu/cgi-bin/hgLiftOver for variants without an rsID. Genetic variants that could not be lifted over were removed (247 out of 46,765). We assessed the same lead variants per study-wide locus as described for the genetic association with plasma metabolites. A lookup was performed for genetic variants within 100 kb of the locus region corresponding to the study-wide significant lead variant.
Short-chain fatty acids
In MOS, a panel of nine plasma SCFAs was measured81. Laboratory method for SCFA measurement is described in the Supplementary Note. The association of genetic variants with SCFAs was assessed with the same REGENIE pipeline as described above for the microbiome, with age, age2, sex, SCFA measurement batch and genetic PCs 1–10 as covariates. SCFAs were RIN-transformed and assessed using linear regression. We assessed the same lead SNPs per study-wide locus as described for the genetic association with plasma metabolites. FDR correction (Benjamini–Hochberg) of 5% was applied.
Reporting summary
Further information on research design is available in the Nature Portfolio Reporting Summary linked to this article.
First Appeared on
Source link

