Genotyping sequence-resolved copy number variation using pangenomes reveals paralog-specific global diversity and expression divergence of duplicated genes
Overview of the genotyping method
We represent variation as haplotype segments that are short enough to minimize disruption by recombination, allowing precise sharing with an NGS sample through identity by descent23 while capturing structural information including phased small variation, structural variation and gene conversion events. We label these haplotype segments as pangenome-derived alleles (PAs) and detect PAs shared with an NGS sample. PA boundaries are arranged to study variation of protein-coding genes. Each PA includes consecutive exons separated by <20 kb and 5 kb of flanking sequences (Methods), reflecting functional proximity of short-range transcription factors24 and population-level genomic linkage. PAs typically range between 10 and 100 kb, corresponding to the scale of linkage disequilibrium (LD) blocks25. While PAs generally correspond to individual genes, they also cover fractions of genes with long introns or, conversely, include tandemly arrayed paralogs within 20 kb.
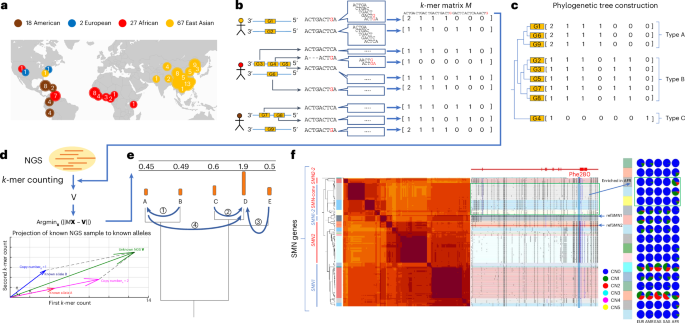
For computational efficiency and to avoid alignment ambiguity in repetitive DNA, we use an alignment-free comparison of low-copy k-mers (DNA fragments of a fixed length k; k = 31) measured in NGS samples to genotype PAs. For each gene, we group all similar PAs in the pangenome, including orthologs, paralogs and homologous pseudogenes, and construct a matrix used in genotyping that contains the k-mer composition of all grouped PAs (Methods). The rows of a matrix correspond to individual PAs, columns correspond to k-mers exclusive to the grouped PAs, and cell values represent the k-mer multiplicity in each PA (Methods and Fig. 1a,b).
a, Demography of the reference pangenome assemblies. Map credit: Hogweard/Wikimedia Commons. b, Construction of pangenome k-mer matrices for CNV genes. Each individual gene is represented as a vector of counts of k-mers exclusively found among homologous sequences. All similar sequences including paralogs and orthologs are included and integrated as a k-mer matrix. c, Construction of phylogenetic trees based on k-mer matrices. d, Schematic of approach to estimate genotypes of alleles using NGS data. The k-mers from each matrix are counted in NGS data and normalized by sequencing depth. The normalized k-mer counts are projected to all pangenome genes. e, Reprojection of the raw results in the last step to integer solutions recursively based on the phylogenetic tree. f, An illustrative annotation and genotyping results on the SMN1 and SMN2 genes using HPRC samples. On the left side of the classification, the phylogenetic tree and heatmap of pairwise similarities are shown along with a mutation plot based on an MSA highlighting point differences in SMN1 in CHM13. All SMN genes are categorized into five major types and 17 subgroups. SMN1 and SMN2 correspond to the most common types of each paralog; SMN1-2, SMN1 partially converted to SMN2; SMN-conv, converted SMN genes, predominantly mapped to the SMN2 locus and found to be enriched in African populations; SMN2-2, a rare outgroup of SMN2. The GRCh38 assembly includes SMN1-2 and SMN2. The Phe280 T variant that disrupts the splicing of SMN2 transcripts is highlighted in red. The genotyping results of 1kGP continental populations are shown on the right. Rows correspond to subgroups, columns correspond to continental populations, and the colors of pie charts give distributions of copy numbers (CNs) among each continental population. AFR, African; AMR, American; EAS, East Asian; EUR, European; SAS, South Asian; ref, reference.
The genotyping is performed per matrix by identifying a combination of PAs (rows) and their copy number with the least-squared distance between their k-mer counts and that from an NGS sample. The sample k-mer counts are projected into the vector space of each k-mer matrix and assigned integer copy numbers using recursive rounding based on the phylogeny of PA sequences (Methods and Fig. 1c–e), resulting in a list of PA-specific copy numbers (paCNs). For example, there are 178 PAs for SMN genes, the gene family associated with spinal muscular atrophy. This includes copies of SMN1, SMN2 and paralogs with gene conversion26, for example, paralogs mapped to SMN2 that contain the SMN1 version of Phe280, the single nucleotide polymorphism (SNP) responsible for dysfunctional exon 7 splicing of SMN2 (ref. 27) (Fig. 1f).
PA database construction
We constructed a PA database for 3,351 genes previously reported as CNVs18,20 (Supplementary Table 1), using 114 diploid PacBio HiFi assemblies from the Human Pangenome Reference Consortium (HPRC), the Human Genome Structural Variation Consortium (HGSVC), the Chinese Pangenome Consortium (CPC) and two telomere-to-telomere assemblies28,29, in addition to GRCh38 and CHM13 (ref. 30). In total, we defined 1,408,209 PAs, organized into 3,307 matrices (Fig. 2a–c).
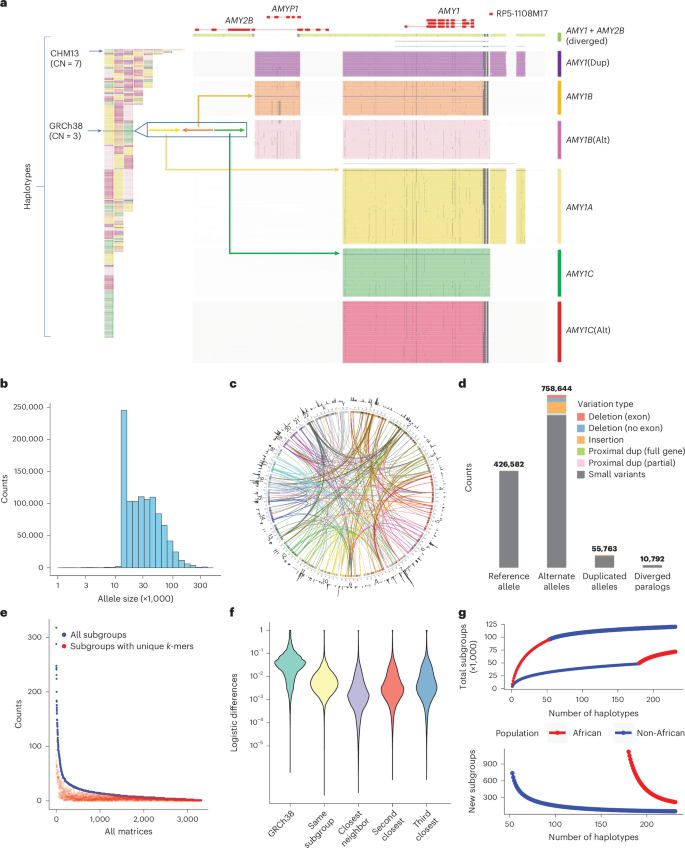
a, An example of amylase 1 PAs. Left: the corresponding order of all AMY1 PAs on assemblies, which are colored based on their major groups (unions of subgroups devoid of SVs >300 bp between members). Right: AMY1 genes are extracted as PAs as well as their flanking genes and sequences, including AMY2B translocated proximally to AMY1 and two pseudogenes: AMYP1 and RP5-1108M17. All PAs are vertically ordered according to the phylogenetic tree and aligned via graphic MSAs (Supplementary Notes). Homologous sequences are vertically aligned. Mutations are visualized as dots, and large gaps (deletions) are shown as spaces. Seven major groups are categorized including five paralogs and two orthologs. There are no pseudogenes around AMY1C, while AMY1A has RP5-1108M17 nearby and AMY1B has AMYP1 nearby. There are alternative versions of AMY1B and AMY1C with sequence substitutions. A new paralog called AMY1(Dup) is found primarily on haplotypes with duplications and has both pseudogenes nearby. Another paralog of AMY1 found with translocated AMY2B is called AMY1 + AMY2B. There are also two rare paralogs (blue and violet) and one singleton ortholog (steel blue). Alt, alternative; dup, Duplication. b, The size distribution of PAs on a log density. c, Circos plot of all PAs. Outer ring, the density of PAs in each Mb on GRCh38. Arcs, interchromosomal PAs are included in the same group. d, Annotation of PAs according to orthology and variants with respect to GRCh38. e, Identifiability of highly similar subgroups by unique k-mers. The total number of subgroups (blue) and the number of subgroups that may be identified by paralog-specific k-mers (red) are shown for each matrix with a size of at least three. f, Distribution of logistic pairwise divergence of PAs depending on orthology and phylogenetic relationship. The values shown are average values from each matrix. Small neighbor distances are an indicator of the strong representativeness of the current cohort. g, Saturation analysis for all subgroups using a recapture mode according to two sorted orders: African genomes considered first and non-African genomes considered first. The former order has a smoother curve than the latter, indicating that there are more African-specific subgroups.
Because of limited human genetic diversity and stronger LD across short distances, PAs are often highly similar or identical. To reduce dimensionality and facilitate cohort analysis, we used their phylogenetic relationships to merge similar PAs into highly similar subgroups (subgroups) treated as equal states (Methods). In total, we defined 89,236 subgroups, which were used to enumerate all PAs, analogous to human leukocyte antigen (HLA) nomenclature (Supplementary Fig. 1).
To annotate low-frequency variants and reference genome locations for orthologous or paralogous relationships, we mapped PAs to GRCh38 (Supplementary Notes). In total, 164,237 paralogous PAs across 6,389 loci were determined. Paralogous PAs that were similar to their corresponding reference locus (≥80% k-mer similarity) were labeled duplicative, and the remaining lower-identity paralogous PAs were labeled diverged. In total, 10,792 diverged paralogs from 2,734 subgroups were identified across 333 matrices (Fig. 2d). The divergent paralogs represent new sequences recalcitrant to canonical reference analysis. For example, some amylase PAs include paralogs for both AMY1 and AMY2B, reflecting an AMY2B translocation (Fig. 2a).
While most duplications were distal to their original genes, 6,673 PAs reflected proximal (<20 kb) duplications, including 1,646 PAs across 36 genes exhibiting ‘runaway duplication’ (ref. 31) with at least three proximal duplications (Supplementary Fig. 2). Proximally duplicated genes were included in the same PA as their ortholog as a heritable unit. Orthologous PAs were classified as reference alleles if they belonged to the same subgroup as the reference gene and as alternative alleles otherwise (Fig. 2d). All PAs were genotyped regardless of paralog–ortholog annotation so that the resulting genotypes contain population and copy number variation.
Ctyper databases capture population diversity
We assessed whether PAs capture unique aspects of genomic information that cannot be replicated by other CNV representations, including copy numbers of reference genes1,31, singly unique nucleotide k-mers1 (SUNKs) and large haplotype structures32,33. We found that PAs provide higher resolution of variation (for example, single-nucleotide variants), as 94.7% of variants are not reflected by sequences in GRCh38. Additionally, both nearby SUNK markers (Fig. 2e) and large haplotype structures were found to be poor proxies for PAs, and only a small proportion of PAs were found to link to SUNKs or larger haplotypes (Methods). Despite largely reduced dimensions, subgroups capture more than 80% of the total population variation (Methods and Fig. 2f). Finally, using saturation analysis34, we estimate that the current cohort represents 98.7% of subgroups in non-Africans and 94.9% in Africans (Methods), suggesting a near-saturated database (Fig. 2g).
Benchmarking genotypes from NGS samples
We genotyped 2,504 unrelated individuals and 641 offspring from the 1000 Genomes Project (1kGP). Most subgroups (99.25%) showed Hardy–Weinberg equilibrium (Methods and Fig. 3a) and thus little bias. There were 27 matrices with >15% subgroups in disequilibrium, which were mostly short genes (median = 4,564 bp) with few low-copy k-mers (Supplementary Table 2). Genotypes were accurate with an average F1 score for trio concordance of 97.58% (Supplementary Notes, Supplementary Table 3 and Fig. 3b), while 18 matrices had high discordance (>15%), primarily for subtelomeric genes or on sex chromosomes with poorer assembly qualities (Supplementary Table 4).
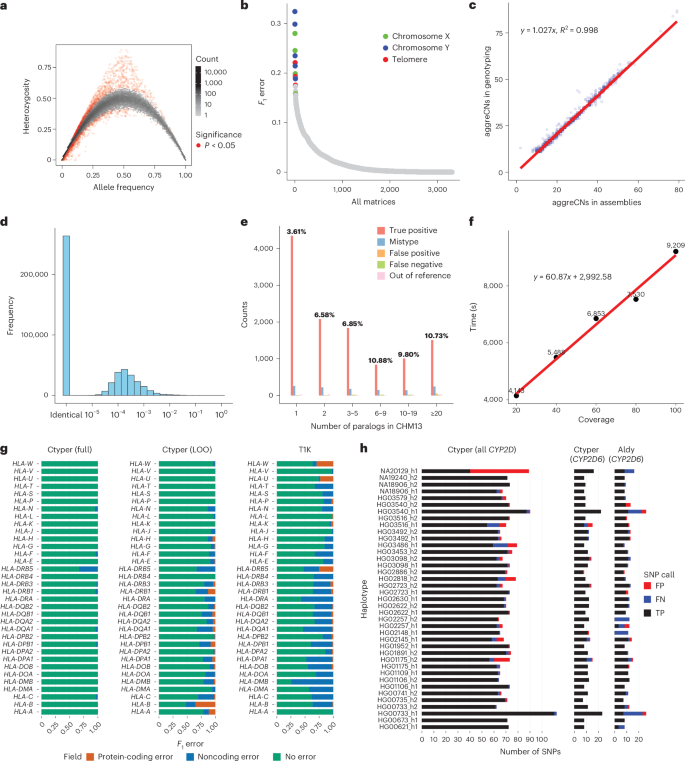
a, Hardy–Weinberg equilibrium of genotyping results from 2,504 1kGP unrelated samples. b, Genotype concordance of genotyping results from 641 1kGP trios, ordered by F1 error. The matrices with an F1 error of more than 15% were labeled by genomic location. c, Copy number comparison between assemblies and genotyping results from 39 HPRC samples shared with 1kGP. d, Sequence differences between genotyped and original alleles during the leave-one-out test using pairwise alignment of nonrepetitive sequences. e, Detailed leave-one-out comparison in the diploid telomere-to-telomere genome CN1. The results are categorized regarding the number of paralogs in CHM13 to show performances on different levels of genome complexity and the main sources of errors. The CN1 NGS sample had about 40-fold coverage. f, Ctyper runtime on all loci in CN1 for varying coverage. g, Benchmarking of HLA genotyping using ctyper on full and leave-one-out (LOO) databases, compared with T1K on 31 HLA genes. h, Benchmarking of CYP2D annotation on all CYP2D genes and CYP2D6 exclusively. FN, false negative; FP, false positive; TP, true positive.
We assessed copy number accuracy and bias among highly duplicated gene families (for example, amylase, NBPF, GOLGA and TBC1D3). The copy numbers derived from genotyping were compared to those from corresponding assemblies for 39 HPRC samples shared with the 1kGP using a database inclusive of these samples. To limit compounded error from misassembled sequences, we excluded samples with low-confidence sequences (Methods). For each sample, we benchmarked on all matrices for which the corresponding assembly was high in copy number (>10). The copy numbers were highly correlated (ρ = 0.996, Pearson correlation) with little bias (Fig. 3c), 0.2% missing copies (false negatives) and 2.4% additional copies (false positives), likely from unassembled genes in assemblies. High concordances remained when tests were expanded to all genotyped genes (ρ >= 0.996, Pearson correlation).
We assessed the sequence similarity of the genotyped alleles to the ground truth genome assembly for the 39 HPRC benchmarking genomes. Each sample was genotyped with the full database (full-set) or the database excluding its corresponding PAs (leave-one-out). We matched the genotyped PAs to the corresponding assembly PAs (Methods), excluding introns and decoys and sequences with <1 kb of nonrepetitive bases, and measured the similarity between the genotyped allele and the assigned query. We performed a similar analysis, treating the closest neighbor to each assembly PA from the database as the correctly genotyped locus. Due to mismatching from database sampling or misassemblies, 2.9% of PAs from the leave-one-out experiment and 1.0% from the full-set experiment were not paired with truth copies for assessment. For the full set, paired PAs had 0.36 mismatches per 10 kb, with 93.0% having no mismatches in nonrepetitive regions. The leave-one-out tests had 2.7 mismatches per 10 kb in nonrepetitive regions, which was 1.2 additional mismatches per 10 kb from the optimal solutions (closest neighbors); 57.3% of alleles had no mismatches, and 77.0% were mapped to the optimal solution (Fig. 3d). The leave-one-out results were 96.5% more similar to the original PAs than the closest GRCh38 gene at 79.3 mismatches per 10 kb.
To isolate sources of errors in cases of misassemblies, we directly compared leave-one-out genotyping results to a telomere-to-telomere assembly28 of genic PAs. The sample genotypes had 11,627 correctly matched subgroups, 599 (4.8%) mistyped to other subgroups, 131 from subgroups unique to the assembly (1.1%; out of reference), 127 false positives (0.5% F1) and 93 false negatives (0.4% F1) for a total F1 error of 6.7% (Methods and Fig. 3e), with a copy number agreement of 99.1%. This is a 3% increase in mistypes compared to trio discordance.
The computational requirements are sufficient for biobank analysis. The average runtime for genotyping 3,351 genes at 30× coverage was 80.2 min (1.0 min per 1× coverage for sample preprocessing and 0.9 s per gene for genotyping) on a single core (Fig. 3f) using ~20 GB of RAM, with support for parallel processing.
We compared the HLA, KIR and CYP2D6 genotypes to the locus-specific methods T1K35 and Aldy36. For 31 HLA genes, ctyper had an F1 score of 98.9% across all four fields of HLA nomenclature37,38 against the full-set analysis and a score of 86.3% for the leave-one-out analysis, while T1K had 70.8%. For protein-coding products (first two fields), ctyper reached 99.98% against the full-set analysis (with 99.9% copy number F1 correctness) and 96.5% (with 99.5% copy number F1 correctness) for the leave-one-out analysis, and T1K had 97.2% (Fig. 3g and Supplementary Tables 5 and 6). For 14 KIR genes, ctyper reached 98.5% across all fields in the full-set analysis and 70.6% for the leave-one-out analysis, while T1K had 32.0% due to the limited database. For protein-coding products (first three digits), ctyper reached 99.2% against the full-set analysis (with 99.9% copy number F1 correctness) and 88.8% for the leave-one-out analysis (with 99.2% copy number F1 correctness), while T1K had 79.6% (Supplementary Fig. 3). Benchmarking CYP2D6 star annotations of assemblies39, ctyper reached 100.0% against the full-set analysis and 83.2% for the leave-one-out analysis, compared to 80.0% using Aldy (Fig. 3h). There was perfect agreement of SNP variants for ctyper against the full-set analysis and 95.7% for the leave-one-out analysis, compared to 85.2% using Aldy.
Finally, we used ctyper to genotype 273 CMR genes40. Unrepetitive regions averaged 0.29 mismatches per 10 kb against the full-set analysis, 99.7% fewer than when comparing assemblies to corresponding GRCh38 sequences (baseline). The genotypes using leave-one-out databases had 4.9 mismatches per 10 kb, 94.8% fewer than baseline (Supplementary Figs. 4–6). Including repeat-masked low-complexity sequences (for example, variable-number tandem repeats), there were 10.5 mismatches per 10 kb against the full-set analysis (97.6% fewer than baseline) and 74.7 mismatches per 10 kb for the leave-one-out analysis (82.7% fewer than baseline; Supplementary Figs. 7–9).
We compared genotyping of HLA and CMR genes to a contemporary method using pangenomes, Locityper41, using leave-one-out analysis. For HLA, Locityper achieved an F1 score of 87.9% (versus ctyper, 86.3%) for predicting all four nomenclature fields, while ctyper performed slightly better on the first two fields for protein-coding variants (96.5% versus 94.0%; Supplementary Notes), although ctyper had a roughly 218× speedup due to alignment-free genotyping. When analyzing CMR genotypes, there were 19.8 fewer mismatches per 10 kb than the Locityper genotypes in comparable regions (Supplementary Notes, Supplementary Table 7 and Supplementary Fig. 10).
Sequence-level diversity of CNVs in global populations
We used principal-component (PC) analysis (PCA) to examine the population structure of PA genotypes in the 2,504 unrelated 1kGP samples, 879 Genotype–Tissue Expression (GTEx) samples and 105 diploid assemblies (excluding HGSVC due to quality filtering), excluding rare subgroups (<0.05 allele frequency) and limiting copy number to ten to balance the weights of PCs (Fig. 4a). All data cluster by population as opposed to source, suggesting little bias between genotyping and assembly or across NGS cohorts. The top 0.1% highest-weighted subgroups in PC1 have an average aggreCN variance of 26.33, significantly larger than the overall of 4.00 (P value = 1.11 × 10⁻¹⁶, F-test). Similarly, PC2 and PC3 have mean aggreCN variances of 19.73 and 7.20, suggesting that CNVs are weakly associated with sequence variants. Furthermore, PC1 is the only PC that clustered all samples into the same sign with a geographic center away from 0, suggesting that it corresponds to modulus variance (hence aggreCN) if treating samples as vectors of paCNs. Meanwhile, PC2 and PC3 were similar to the PCA plots based on SNP data of global samples42, suggesting that they are associated with the sequence diversity of CNV genes. The total number of duplications is elevated in African populations (Fig. 4b), reflected in the order of PC1 (Fig. 4a).
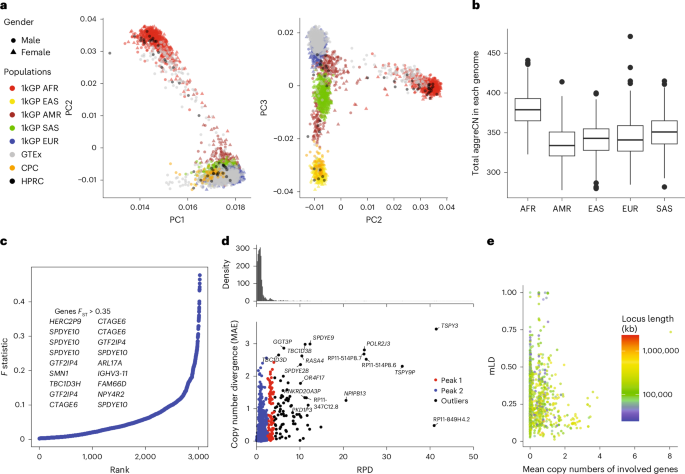
a, PCAs of allele-specific copy numbers on the union of PA genotyping results and assembly annotations. b, Distribution of total autosomal gene copy numbers among unrelated 1kGP samples, including pseudogenes (AFR, n = 685; admixed AMR, n = 352; EAS, n = 511; EUR, n = 522; SAS, n = 516; box shows median and interquartile range; whiskers extend to 1.5× interquartile range, with outliers beyond). c, Population differentiation measured by F statistics of duplications among different continental populations. Genes with a paralogous subgroup with an F statistic of more than 0.35 are labeled. d, Mean absolute variation in copy numbers and RPD in sequences. Based on our genotyping results from unrelated 1kGP genomes, for genes found to be CNV to the population median in more than 20 samples, we determined the average aggreCN difference (MAE) between individuals and estimated the average paralog difference in sequences relative to the ortholog difference. e, mLD between pairs of CNV genes less than 100 kb apart. The larger MAE value of each pair is used for the x-axis values. The total locus length denotes the length from the beginning of the first gene to the end of the last gene.
We examined ctyper genotypes to measure the extent to which duplications show population specificity. We used the F statistic, a generalization of FST that accommodates more than two genotypes (Methods), to test the differences in distributions across continental populations (Fig. 4c). In total, 4.4% (223 of 5,065) of duplicated subgroups showed population specificity (F statistic > 0.2; Supplementary Table 8). The subgroups of PAs with the highest F statistic (0.48) contain duplications of HERC2P9, a known differentiated gene7. Additionally, a converted copy of SMN2 annotated as a duplication of SMN1 is enriched in African populations (F statistic = 0.43).
We then measured the divergence of duplicated genes from their reference copies, indicating recent or ancient duplications and providing a measure of reference bias from missing paralogs. We constructed multiple-sequence alignments (MSAs; Methods) for sequences of each matrix and measured all pairwise differences in nonrepetitive sequences. We determined the average paralog sequence divergence relative to the ortholog divergence (Methods), which we refer to as the relative paralog divergence (RPD). We also measured copy number diversity using mean absolute error (MAE), indicating the CNV level among populations (Fig. 4d). Based on RPD, using density-based spatial clustering of applications with noise43, we identified two peaks at 0.71 and 3.2, with MAE centers at 0.18 and 0.93, corresponding to genes with rare and recent CNVs and more divergent and common CNVs, respectively. The latter reflect CNVs on different structural haplotypes that cannot be analyzed using a single reference genome. For example, AMY1A has a high RPD at 3.10 because of truncated duplications. These results are consistent with ancient bursts of duplications in human evolution44.
We next used ctyper genotypes to investigate recombination at different CNV loci. We determined multiallelic LD45 (mLD; Methods) between PAs using the unrelated 1kGP samples for 989 subgroups that were adjacent less than 100 kb apart in GRCh38 and reported the average mLD within each matrix (Fig. 4e). There was a stronger negative rank correlation between MAE of copy number and mLD (ρ = −0.24, P value = 3.4 × 10⁻¹⁵, Spearman’s rank) than the rank correlation between mLDs and locus length (ρ = −0.21, P value = 1.5 × 10⁻¹¹, Spearman’s rank), suggesting a reduced haplotype linkage in genes with frequent CNVs. The lowest mLD (0.013) was found in FAM90, a gene with frequent duplications and rearrangements46. The 29 loci with highest mLD (mLD > 0.7) were enriched in the sex chromosomes (n = 19). Furthermore, HLA-B and HLA-DRB had mLD > 0.7 and only deletion CNV (Supplementary Notes).
eQTL analysis
To investigate the impact of paCNs on expression, we performed eQTL analysis using the Genetic European Variation in Disease47 (GEUVADIS) and GTEx48 cohorts. There were 4,512 genes that could be uniquely mapped in RNA-seq alignments. An additional 44 genes, such as SMN1, SMN2, AMY1A, AMY1B and AMY1C, have indistinguishable transcription products and were analyzed by pooling among all copies. We assigned PAs to these transcripts based on exonic sequences and performed association analysis with paCNs (Methods and Supplementary Table 9).
After merging paCNs to aggreCNs, 5.5% (178 of 3,224) of transcripts showed significance (corrected P = 1.6 × 10⁻⁵, Pearson correlation) as previously observed31. By contrast, when updating aggeCNs by individual paCNs and performing multivariable linear regression on expression (Methods), there were significant improvements in fit for 27.6% (890 of 3,224) of transcripts (corrected P = 1.6 × 10⁻⁵, one-tailed F-test; Fig. 5a). To test whether the fit was explained by the nonuniform expression of different alleles of the same reference gene, we used a linear mixed model (LMM; Methods) to regress total expression to individual subgroups and estimate allele-specific expression and then compared these values to other subgroups of the same matrix that were assigned to the same reference gene (Supplementary Table 10). For subgroups within solvable matrices and more than ten samples, we found that 7.94% (150 of 1,890) of paralogs and 3.28% (546 of 16,628) of orthologs had significantly different expression levels (corrected with sample size = number of paralogs + orthologs, corrected P = 2.7 × 10⁻⁶, χ2 test; Fig. 5b). Overall, paralogs were found to have reduced expression (Fig. 5c), consistent with previous findings for duplicated genes49.
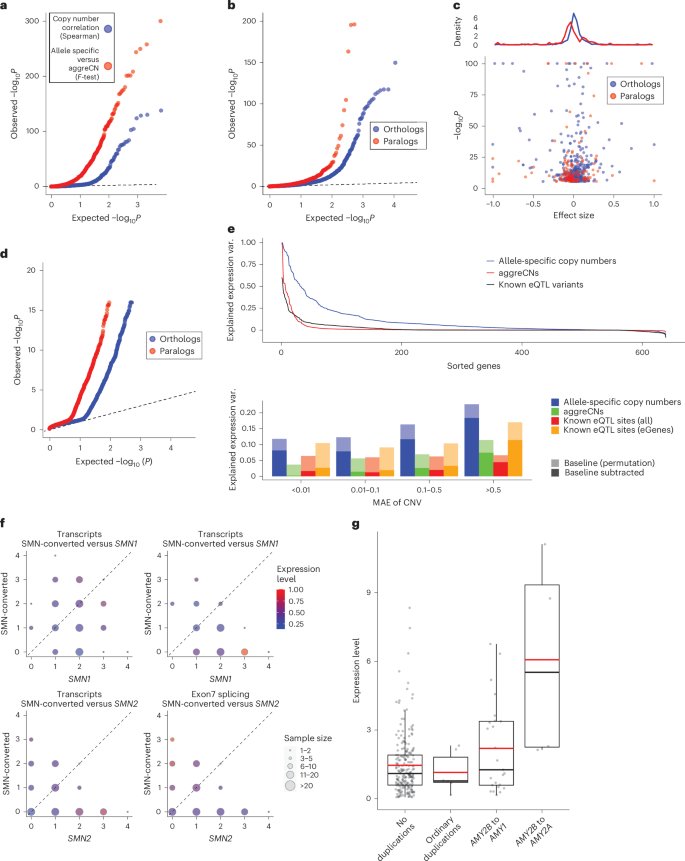
a, Q–Q plot of associations of (blue) aggreCNs with gene expression in GEUVADIS samples (red) and the improvement of allele-specific copy number over aggreCN. b, Comparative gene expression Q–Q plots of orthologs (blue) and paralogs (red). c, Fold change effect size of all significant alternative expressions in b. Fold changes as well as P values are shown. Top: density of fold change effect size of orthologs and paralogs. d, Preferential tissue expression of orthologs and paralogs. e, Top: comparison of different models for explained expression variance (R2). Bottom: quantification of variance explained by different representations at different levels of CNV frequencies: full paCN genotypes, aggreCN and known eQTL variants (var.). f, Case study on SMN genes showing decreased gene expression in SMN-converted. The average expression level in PEER-corrected GEUVADIS samples (n = 386) is shown under different copy numbers of SMN1 (n = 741), SMN2 (n = 569) and SMN-converted (n = 89). Transcript levels are the total coverage of all isoforms, and the exon 7 splicing level is measured by counting isoforms with a valid exon 7 splicing junction. g, Case study on amylase genes showing increased gene expression of translocated AMY2B using PEER-corrected GTEx pancreas data (no duplications, n = 209; ordinary duplications, n = 6; AMY2B to AMY1, n = 25; AMY2B to AMY2A, n = 4; RNA-seq samples, n = 304; box shows median and interquartile range; whiskers extend to 1.5× interquartile range, with outliers beyond).
We compared expression in 57 tissues in the GTEx samples to test for preferential expression of paralogs (Methods and Supplementary Table 11). There was alternative tissue specificity for 132 of 2,820 paralogs (4.68%) and 225 of 19,197 orthologs (1.17%) (corrected P = 6.4 × 10⁻⁸, union of two χ2 tests; Methods and Fig. 5d).
Additionally, we used analysis of variance (ANOVA) to estimate the proportion of expression variance (R2) explained by paCNs in GEUVADIS expression data and compared it to that in a model based on known SNPs, indels and eQTL structural variants (SVs)50 (Methods). As expected, the highly granular paCNs explained the most variance: on average, 10.3% (14.3% including baseline). By contrast, 58.0% of transcripts are genes with known eQTL variants that explained valid variance by 2.14% (1.60% considering experimental noise, in agreement with a previous estimate of 1.97%51). On average, 1.98% of the variance was explained by aggreCNs, and 8.58% was explained by subgroup information. When combining both paCNs and known eQTL sites, 10.4% (19.0% including baseline) of the valid variance was explained (Fig. 5e).
We examined the SMN and AMY2B genes as case studies due to their importance in disease and evolution27,52. The SMN genes were classified as SMN1, SMN2 and SMN-converted. We found no significant difference between the expression of all transcripts of SMN1 and SMN2 (0.281 ± 0.008 versus 0.309 ± 0.009; P = 0.078, χ2 test). However, significant differences were found between SMN-converted, and SMN1 and SMN2 (0.226 ± 0.012 versus 0.294 ± 0.002; P = 1.75 × 10⁻⁷, χ2 test), with a 23.0% reduction in SMN-converted expression. By contrast, despite having lower overall expression, SMN-converted had 5.93× the expression of valid exon 7 splicing53 of SMN2 (P = 2.2 × 10⁻¹⁶, χ2 test), indicating that SMN-converted has full functional splicing54 but lower overall expression (Fig. 5f). We studied the expression of AMY2B duplications, including alleles translocated proximally to other AMY genes, such as the PAs containing AMY1 and AMY2B in Fig. 2a. Using probabilistic estimation of expression residuals (PEER)-corrected GTEx pancreas data, we found that translocated AMY2B genes had significantly higher expression than other duplications (1.384 ± 0.233 versus −0.275 ± 0.183, P = 7.87 × 10⁻⁹, χ2 test) (Fig. 5g).
First Appeared on
Source link

