Large-scale exome analyses reveal new rare variant contributions in amyotrophic lateral sclerosis
Building a harmonized ALS exome dataset for rare variant analysis
To identify rare coding variants involved in ALS, we harmonized 18 whole-exome (WXS) and whole-genome (WGS) sequencing datasets into a discovery cohort totaling 94,545 people. All data were realigned uniformly to GRCh38 and called jointly using the functional equivalence pipeline10,11, substantially reducing technical variation (Supplementary Fig. 1a). Moreover, the distributions of exome-wide URV counts were aligned between ancestry-matched WGS (Project MinE) and WXS (UK Biobank) samples, indicating that sequencing technologies were comparable after joint processing and quality control (Supplementary Fig. 1b). Following strict filtering, the final dataset comprised 13,138 unrelated cases and 69,775 controls of predominantly European ancestry, with 5,207,138 variants (2,367,861 predicted moderate or high impact; Supplementary Figs. 2–4).
Rare single-variant analyses identify five new risk variants and largely recapitulate known rare variant architecture of ALS
We conducted single-variant analyses of 272,925 rare variants that fell within our testable minor allele frequency (MAF) range (5 × 10⁻⁵ < MAF < 0.05) while also satisfying variant effect prediction criteria of either moderate- (missense mutations, in-frame deletions and untranslated region (UTR) truncations) or high-impact (nonsense, splice acceptor/donor and frameshift mutations) annotations. For each variant, we used Firth’s logistic regression to test for an association between ALS status and minor allele count (MAC), adjusting for sex, ten principal components (PCs) and the total number of rare synonymous variants in each person12,13. The resulting test statistics showed no systematic inflation, indicating no residual confounding (λ1,000 = 1.01), and significant variants passed subsequent validation and sensitivity analyses (Extended Data Fig. 1a,b).
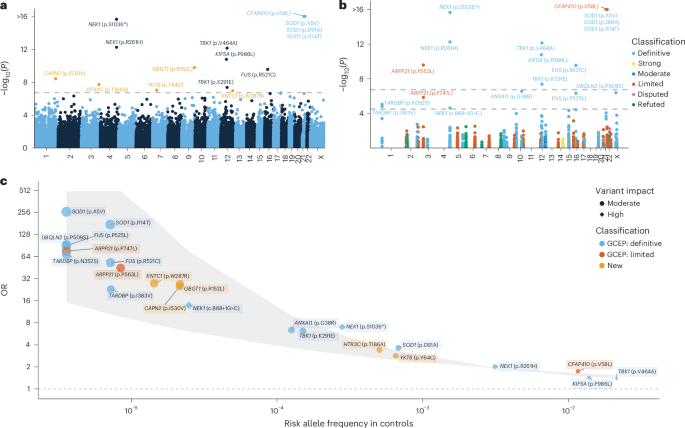
We identified 15 exome-wide significant variants across 11 distinct genes (P < 1.83 × 10⁻⁷; Fig. 1a, Table 1, Extended Data Table 1, Extended Data Figs. 1 and 2 and Supplementary Data 1), for all of which the minor allele was associated with increased ALS risk (Fig. 1c). Among the 15 associated variants, 10 were located in genes previously shown to be related to ALS: SOD1, CFAP410, NEK1, KIF5A, FUS and TBK1 (Fig. 1a and Extended Data Table 1). The remaining five have not been reported previously in ALS (Table 1). These encompass intermediate frequency variants with modest effect size, including HTR3C p.T186A (odds ratio (OR) = 3.41, P = 1.87 × 10⁻⁸) and YKT6 p.Y64C (OR = 2.84, P = 9.08 × 10⁻⁸) as well as rare variants with high effect size, including GBGT1 p.R152L (OR = 26.9, P = 1.68 × 10⁻¹⁰), CAPN2 p.I530V (OR = 25.3, P = 3.66 × 10⁻⁹), and KNTC1 p.W287R (OR = 27.7, P = 1.07 × 10⁻⁷).
a, y axis: exome-wide single variant associations estimated using Firth’s logistic regression with profile penalized likelihood CIs (−log10(P)); x axis: genomic coordinates (GRCh38). Dashed line: exome-wide significance threshold (P < 1.83 × 10⁻⁷). New variants are highlighted in orange. b, Rare single-variant analyses among ALS-linked genes curated by the ALS GCEP. y axis: single-variant associations estimated using Firth’s logistic regression with profile penalized likelihood CIs (−log10(P)); x axis: genomic coordinates (GRCh38). Variants are colored by the clinical validity classification as curated by the ALS GCEP. Lower dashed line: significance threshold across variants in ALS-linked genes (P < 3.20 × 10⁻⁵); upper dashed line: exome-wide significance threshold as presented in a. c, ORs (y axis) and 95% CIs (gray shaded area) plotted against the risk allele frequency in controls (x axis) for significant variants identified in either the exome-wide or GCEP analysis. For variants where the control risk allele frequency was 0, it was set to half the lowest nonzero risk allele frequency observed in the control group. P values are two-tailed and are presented uncorrected for multiple testing.
We also performed a targeted analysis of variants within 51 ALS-linked genes curated by the ALS Gene Curation Expert Panel (GCEP)14. To ensure the inclusion of the full set of GCEP-curated genes, we did not apply the per-supercohort call-rate filter for this analysis, allowing for the assessment of genes exhibiting subpar call-rates in certain subcohorts. This identified eight additional variants across six genes (P < 3.20 × 10⁻⁵; Fig. 1b,c, Extended Data Table 1 and Supplementary Data 2), including variants in genes that were not detected in the exome-wide analysis (ARPP21, ANXA11, UBQLN2 and TARDBP). For all identified variants, the minor allele was associated with increased ALS risk (Fig. 1c and Extended Data Table 1). We provide independent evidence for two rare variants in ARPP21 (p.P563L and p.P747L)—a gene that is currently considered as having limited evidence according to GCEP (p.P563L: OR = 44.8, P = 2.55 × 10⁻¹⁰; p.P747L: OR = 75.8, P = 1.45 × 10⁻⁶) (Fig. 1b,c). Of note, the ARPP21 p.P563L variant had subpar call-rates in some exome cohorts. However, even when restricting the analysis to cohorts meeting stringent call-rate thresholds, the association remained exome-wide significant with a similar odds ratio (P = 1.09 × 10⁻⁸, OR = 38.1; Extended Data Fig. 1c,d).
Principal component analysis (PCA) suggested a mixed pattern of geographical distribution for carriers of the identified variants (Supplementary Fig. 5). For some variants, we observed that carriers exhibited relatively tight clustering in PCA space. This was observed for both well-established ALS variants such as UBQLN2 p.P509S (Sweden) and SOD1 p.A5V (USA), as well for the new CAPN2 p.I540V variant (the Netherlands). Conversely, other variants were distributed more uniformly across patient populations (for example, YKT6 p.Y64C and ARPP21 p.P563L). In silico pathogenicity prediction tools also yielded varying annotations for both previously established and new ALS-associated variants (Supplementary Table 1). Nonetheless, we observed that YKT6 p.Y64C was consistently predicted as damaging by all predictors, and KNTC1 p.W287R was predicted as damaging by all but SIFT.
Ultrarare burden analyses identify new ALS-associated genes
To detect associations among URVs (five or fewer carriers), we performed burden tests using Firth’s logistic regression to evaluate their cumulative effects. URVs were aggregated across several functional units, including genes and protein domains. To enrich for potentially pathogenic variants, we used four filtering strategies based on two criteria: (1) variant frequency—either all URVs or singleton-only variants; (2) variant impact—either only high-impact variants or both high- and moderate-impact variants. Tests across these filtering strategies were combined using the ACAT omnibus test15. We observed no evidence of genomic inflation in any of the analyses performed (gene λ1,000 = 1.011, domain λ1,000 = 1.006; Extended Data Fig. 3a), and all presented genes passed subsequent sensitivity analyses (Extended Data Fig. 3e–g).
URV gene burden analyses across 17,324 protein-coding genes identified eight genes that reached exome-wide significance (P < 2.89 × 10⁻⁶) (Fig. 2a, Table 2, Extended Data Table 2, Extended Data Figs. 2 and 3, Supplementary Data 3 and 4 and Supplementary Fig. 6). Among these were four established ALS genes: SOD1 (P < 1 × 10⁻¹⁶), TBK1 (P < 1 × 10⁻¹⁶), NEK1 (P = 6.49 × 10⁻¹³) and TARDBP (P = 5.02 × 10⁻⁸) (Extended Data Table 2). Furthermore, we identified DNAJC7 (P = 8.77 × 10⁻⁸), which is currently classified as having limited evidence (ClinGen gene curation panel14), and here reaches exome-wide significance for the first time in an exome-wide discovery analysis. New candidate genes included TTC3 (P = 4.16 × 10⁻⁷), UNC13C (P = 2.80 × 10⁻⁷) and KIF4A (P = 1.62 × 10⁻⁶), in all of which higher URV burden increased risk of ALS (Table 2 and Extended Data Fig. 3b). A targeted analysis among the 51 ALS-linked genes classified by GCEP also revealed a significant association for OPTN (P = 1.56 × 10⁻⁵), which is classified by GCEP as a definitive ALS gene (Fig. 2b and Extended Data Table 2).
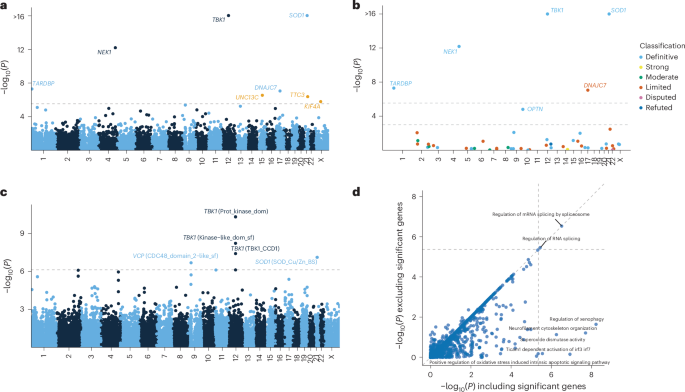
a, y axis: exome-wide gene-based URV associations (−log10(P)); x axis: genomic coordinates (GRCh38). Dashed line: exome-wide significance threshold (P < 2.9 × 10⁻⁶). New risk genes are highlighted in orange. b, URV burden analyses among ALS-linked genes curated by the ALS GCEP. y axis: gene-based URV associations (−log10(P)); x axis: genomic coordinates (GRCh38). Lower dashed line: significance threshold across ALS-linked genes (P < 1 × 10⁻³); upper dashed line: exome-wide significance threshold as presented in a. c, Domain-based URV analyses. y axis: domain associations (−log10(P)); x axis: genomic coordinates (GRCh38). Dashed line: exome-wide significance threshold (P < 7.68 × 10⁻⁷). d, Association P values for URV geneset burden analyses excluding exome-wide significant genes (y axis) versus including exome-wide significant genes (x axis). The dashed lines indicate the multiple testing threshold (P < 4.25 × 10⁻⁶). Association statistics were estimated using Firth’s logistic regression with profile penalized likelihood CIs. P values are from the ACAT omnibus test combining the four variant filtering strategies (Methods) and are two-tailed and uncorrected for multiple testing.
The URV domain analyses across 65,071 domains identified three partially overlapping domains in TBK1 (protein kinase, kinase-like and CCD1 domains), one domain in SOD1 (SOD_Cu/Zn_BS domain) and one domain in VCP (CDC48 domain 2-like domain) at exome-wide significance (P < 7.68 × 10⁻⁷; Fig. 2c, Extended Data Fig. 3c and Supplementary Data 5 and 6). Unlike SOD1 and TBK1, VCP did not reach significance in the whole-gene analysis (Pgene = 8.09 × 10⁻³), suggesting that the CDC48 domain 2-like region harbors the primary association signal with a markedly stronger effect (Pdomain = 2.16 × 10⁻⁷). This domain constitutes the second subdomain of the N-terminal domain, in which most known pathogenic mutations are concentrated16.
Across burden analyses, ORs were generally similar when including all URVs compared to including singletons only, with the notable exceptions of NEK1 and KIF4A, which showed markedly higher ORs in the singleton-only analyses (Extended Data Fig. 3b–d). The observed associations were driven primarily by moderate-impact variants: NEK1 and TBK1 were the only genes showing a significant signal when analyses were restricted to high-impact variants (Extended Data Fig. 3k–m), although some signal among high-impact variants was observed for DNAJC7 and OPTN. Single nucleotide variants (SNVs) were the primary drivers of the associations, with insertions/deletions (INDELs) contributing substantially to the association P values only for NEK1 and DNAJC7 (Extended Data Fig. 3h–j). For UNC13C, TTC3 and OPTN, we identified a small subset of people carrying two URVs, whereas for TBK1 and NEK1, we found people with both a URV and a more common (0.01 < MAF < 0.05) risk variant (p.V464A and p.R261H, respectively). No increased risk was observed in these cases, although this may be due to the low number of co-occurrences (Extended Data Fig. 4a).
Assessing geneset burden and variant co-occurrence
We performed URV geneset burden analyses across 11,777 Gene Ontology (GO), Kyoto Encyclopedia of Genes and Genomes (KEGG) and Reactome genesets from the Molecular Signatures Database (MSigDB v.7.5)17, using the same procedure as the single gene analyses (λ1,000 = 1.006, Supplementary Data 7 and 8). After excluding genesets driven solely by one highly significant gene, two genesets remained significant: ‘GOBP: regulation of mRNA splicing via spliceosome’ (GO:0048024, 96 genes, P = 2.97 × 10⁻⁷) and its parent term ‘GOBP: regulation of RNA splicing’ (GO:0043484, 142 genes, P = 3.50 × 10⁻⁶) (Fig. 2d and Extended Data Fig. 3d). As ‘regulation of mRNA splicing via spliceosome’ is a subset of ‘regulation of RNA splicing,’ we performed a conditional analysis to assess its independent contribution. This revealed that residual signal remains in ‘regulation of mRNA splicing via spliceosome’ (P = 0.0084), suggesting it captures a more specific association within this pathway. Among the 153 unique genes across these two genesets, 30 reached nominal significance (P < 0.05), with top genes including HSPA8, HABP4, NOVA2, HNRNPL and SNW1 (Supplementary Fig. 7a). We also performed a geneset analysis among the 51 ALS-linked genes curated by GCEP14. As expected, this showed that the ‘Definitive’ category was highly significant (P < 1 × 10⁻¹⁶) across allele frequency thresholds, whereas the ‘Limited’ category showed only modest enrichment (P = 0.0015), and no enrichment was seen among the other categories (Supplementary Fig. 7b,c).
We next examined whether carrying several variants among ‘Definitive’ ALS genes as classified by GCEP confers cumulative risk. We observed a clear dose–response relationship across low-frequency variants (MAF < 0.05): the OR increased progressively as people carried one (OR = 1.19, P = 2.11 × 10⁻¹⁵), two (OR = 1.35, P = 8.43 × 10⁻¹³), three (OR = 1.84, P = 2.78 × 10⁻⁸) or four (OR = 4.26, P = 5.35 × 10⁻⁵) qualifying variants (Extended Data Fig. 4c and Supplementary Data 9). This relationship persisted when burden was assessed at the gene level, where several variants within the same gene were counted as a single event (Extended Data Fig. 4d and Supplementary Data 9). Analyses restricted to rarer variants were underpowered due to the low number of people carrying several variants (Supplementary Data 9). We did not observe a similar dose–response relationship when we tested for an association with age at onset and survival (Supplementary Fig. 8).
We next focused on co-occurrence among the specific risk variants identified in this study. Focusing on single variants in ‘Definitive’ GCEP genes, we found that 11.1% of cases carried one variant and 0.54% carried two, whereas the co-occurrence of three or more variants was not observed (Extended Data Table 3). When including variants in genes with ‘Limited’ evidence and new single variants identified in this study, the proportions increased to 14.5% for one, 1.1% for two and 0.0076% for three variants. The proportions increased further to 18.2%, 1.7% and 0.099%, respectively, when also including qualifying variants from the URV burden analyses. Finally, when C9orf72 repeat expansion status was also considered (available for 66% of cases), these totals rose to 23.5%, 3.12% and 0.22%, respectively, totaling 26.9% of cases. The observed co-occurrence rates did not deviate from those expected under an additive model using permutation analyses (P = 0.39). When examining specific variant pairs, we observed numerous instances of cases carrying several variants (Extended Data Fig. 5 and Supplementary Fig. 9). For example, 20% of C9orf72 repeat expansion carriers harbored additional risk variants. Furthermore, some pairs, including CFAP410 p.V58L × NEK1 p.R261H, showed trends suggestive of a synergistic effect (Extended Data Fig. 4e). To formally test whether any of these pairs showed nonadditive effects, we performed pairwise co-occurrence and interaction analyses. No pairs reached significance after correction for multiple testing (Extended Data Fig. 5 and Supplementary Fig. 9). This was consistent with our power calculations (Supplementary Fig. 10), which showed that the study was underpowered to detect all but the largest deviations from additivity for specific variant pairs, and then only for pairs including at least one low-frequency variant (0.01 < MAF < 0.05).
ARPP21 p.P563L is associated with earlier disease onset and shorter disease duration
To assess the impact of genetic variants on disease progression, we analyzed survival and age at onset across candidate genes and variants (Extended Data Fig. 6 and Supplementary Data 10). Consistent with previous reports, SOD1 p.A5V and p.D91A were associated significantly with a lower age at onset (p.A5V: B = −9.44, P = 5.61 × 10⁻⁴; p.D91A: B = −4.82, P = 1.11 × 10⁻⁵), with p.A5V linked to shorter survival and p.D91A to longer survival (p.A5V: hazard ratio (HR) = 13.0, P = 1.19 × 10⁻⁸; p.D91A: HR = 0.453, P = 1.48 × 10⁻⁷). Similarly, FUS p.R521C and p.P525L were associated with earlier onset (p.R521C: B = −16.2, P = 1.90 × 10⁻⁴; p.525L: B = −39.1, P = 1.53 × 10⁻¹⁰), with p.P525L specifically associated with shorter survival (HR = 41.75, P = 1.41 × 10⁻¹⁰). Notably, ARPP21 p.P563L was associated with a significantly lower age at onset (B = −12.7, P = 5.44 × 10⁻⁴) and shorter survival (HR = 5.96, ∆survival time = −19.5 months, P = 2.54 × 10⁻⁶), showing effect sizes comparable to SOD1 p.A5V (Extended Data Fig. 6a). Among URVs, SOD1 was associated with longer survival (HR = 0.45, P = 0.0022), whereas no significant associations were observed for other genes (Extended Data Fig. 6b).
Replication confirms YKT6 and supports HTR3C, GBGT1 and KNTC1 as ALS risk genes
For replication, we generated a cohort comprising 4,781 individuals with ALS and 130,928 controls after applying stringent quality control criteria identical to those used in the discovery set (Supplementary Figs. 11 and 12). Power analyses based on the (winner’s curse adjusted) effect sizes observed in the discovery dataset indicated that this provides between 32% and 91% statistical power for replication across candidate variants and genes (Supplementary Fig. 12).
Of the five new single variants identified in the discovery phase, all showed a consistent direction of effect in the replication cohort (Table 1; λ1,000 = 0.965). Moreover, all five reached exome-wide significance in a meta-analysis of the combined discovery and replication data, with all but CAPN2 p.I530V showing greater significance compared to the discovery phase alone (Table 1). Furthermore, YKT6 p.Y64C achieved replication-wide significance (P < 0.0063), correcting for the eight new associations from the discovery phase (five single variants and three URV genes). Among the three candidate URV genes, a consistent direction of effect was seen only for KIF4A (OR = 2.46, P = 0.26), and none reached replication-wide significance (Table 2; λ1,000 = 1.046).
Establishing independent evidence for ARPP21, DNAJC7 and CFAP410
Next, for the genes that were significant in our discovery analysis that are currently classified by GCEP with ‘Limited’ evidence (ARPP21, CFAP410 and DNAJC7), we aimed to confirm the independence of our findings.
For ARPP21, we identified two rare variants: p.P747L, which has not previously been reported in the scientific literature, and p.P563L, previously reported in UK and Spanish families as candidate variants18,19. To confirm independence for p.P563L, we excluded four potentially overlapping UK carriers (no Spanish carriers were identified). The association remained (OR = 28.3, P = 3.47 × 10⁻⁷; Extended Data Fig. 7a) and was further supported by our replication dataset, which had no potential overlap with previous studies (OR = 16.5, P = 3.29 × 10⁻³). A meta-analysis of these two independent datasets yielded a highly significant association (P = 4.31 × 10⁻⁹), confirming a strong, independent signal. We also validated the reported effects of age of onset and progression19 in our nonoverlapping cohort (Extended Data Fig. 6). Finally, ARPP21 carriers were observed across several cohorts beyond those from the UK and Spain, significantly expanding its known population distribution (Supplementary Fig. 5).
CFAP410 p.V58L was previously identified in two common variant genome-wide association studies (GWAS) (MAF = 0.013)4,20. To confirm independence, we excluded 8,372 cases and 4,159 controls that were duplicated or had second-degree or closer genetic relatedness to the original GWAS cohorts. The association remained highly significant after this exclusion (Pmeta = 1.34 × 10⁻¹⁴), with consistent ORs in both discovery (OR = 1.81, P = 1.32 × 10⁻¹⁰) and replication (OR = 1.61, P = 1.09 × 10⁻⁵) cohorts (Extended Data Fig. 7b).
For DNAJC7, implicated previously in a case–control study of ALS21, we re-evaluated the association after excluding overlapping cohorts (excluding 5,722 cases and 9,849 controls). In this reduced discovery dataset, there remained a robust association with a consistent odds ratio (ncases = 7,606, ncontrols = 59,926; OR = 2.56, P = 1.36 × 10⁻⁴; Extended Data Fig. 7c). This was further supported by our replication cohort, which had minimal overlap (190 cases) with the previous study (OR = 2.41, P = 2.82 × 10⁻³; Extended Data Fig. 7c). Meta-analysis across these two datasets confirmed a strong, independent signal (P = 2.96 × 10⁻⁶).
First Appeared on
Source link

