Mechanism of co-transcriptional cap snatching by influenza polymerase
Cloning and purification of proteins
To generate H7N9 FluPol with impaired endonuclease activity, the PA(E119D) mutation was introduced into the PA gene. A pFastBac Dual vector encoding the influenza polymerase heterotrimer subunits of A/Zhejiang/DTID-ZJU01/2013 (H7N9)35, was used as a template for PCR site-directed mutagenesis and Gibson cloning. This method was also used to generate mutated FluPol variants with altered interface with the Pol II elongation complex. Sequencing of all polymerase subunits confirmed the successful introduction of the site-specific mutations in the PA or PB2 gene.
The wild-type FluPol, FluPol PA(E119D) and other FluPol mutants were essentially expressed and purified as described35, with the following modification for all experiments, except the sample preparation for the post-cleavage structure. Initial viruses were generated using transfection in Sf9 cells (obtained from ThermoFisher, not verified in-house), virus propagation in Sf21 cells and protein expression in Hi5 cells (both obtained from Expression Systems, not verified in-house). Instead of ammonium sulfate precipitation as a first step during purification, the supernatant was clarified by ultracentrifugation in a Ti45 rotor (Beckman Coulter) at 45,000 rpm and 4 °C for 1 h.
To generate the human transcription factor DSIF with altered binding interfaces with FluPol, SPT5 mutations were introduced. The pETDuet-1 plasmid containing the codon optimized human genes33 was amplified using site-directed mutagenesis primers, followed by Gibson assembly, transformation and selection. Plasmids were subjected to full plasmid sequencing to check for correct insertions.
The human transcription factors (DSIF and CAK kinase trimer) were expressed and purified as described previously25,33,60. Mutated versions of DSIF were not dialysed into 300 mM NaCl buffer, but instead cleaved overnight in the elution buffer and then diluted with no salt buffer to the same salt concentration on the next day. Pol II was purified from pig thymus as described in33,49, leaving out the size-exclusion step.
In vitro transcription
The mRNAs were transcribed from two DNA primers61. The primers are complementary at the promoter site for the T7 polymerase, and the desired RNA sequence is single-stranded. The in vitro transcription mixture contained 1 μM primers, 40 mm Tris-HCl pH 8.0, 30 mm MgCl2, 2 mm spermidine, 50 mm NaCl, 5 mm NTPs (pH adjusted to 7), 2% DMSO, 0.01% Triton X-100, and 5% T7 DNA-dependent RNA polymerase (homemade). The in vitro transcription reaction was incubated at 37 °C overnight.
The following day, for 1 ml of reaction, 10 µl of Proteinase K (NEB) and 10 µl of DNAse I (ThermoFisher) were added. The reaction was incubated at 37 °C for another 10 min. In addition, 160 µl EDTA (0.5 M pH 8.0) and 80 µl NaCl (5 M) were added to dissolve pyrophosphate precipitates. Then, the RNA was precipitated by adding 900 µl isopropanol and incubating at −80 °C for 2 h. The mixture was centrifuged at 21,000g at 4 °C for 15 min, and the supernatant was discarded. The pellets were air-dried, resuspended in 150 µl RNAse-free water, 2× RNA loading dye was added to 1× (47.5% formamide, 0,01% bromophenol blue, 0.5 mm EDTA) and incubated at 70 °C for 5 min. This mixture was then loaded onto a 12% denaturing urea polyacrylamide gel (8 M urea, 1× TBE (Sigma Aldrich), 12% Bis-Tris acrylamide 19:1 (Carl Roth)) and run in 1× TBE at 300 V for 30 min. Afterward, the gel was covered in plastic wrap and placed on a fluor-coated cellulose TLC plate (Sigma Aldrich) in a darkroom. The RNA bands were visualized using UV shadowing on the TLC plate at 254 nm.
The desired RNA band was cut out from the gel and shredded by passing the gel through two 3 ml syringes. 0.3 M NaOAc pH 5.2 (Invitrogen) was added to cover all gel pieces and incubated at −80 °C overnight. Then, the small pieces were incubated at 37 °C for 30 min and centrifuged at 21,000g for 5 min, and the supernatant was transferred into a fresh tube. This process of adding NaOAc and collecting the supernatant was repeated five times. The supernatants were filtered using a 0.22 µm syringe filter, precipitated with 70% ethanol, and incubated at −80 °C overnight. On the next day, the mixture was centrifuged at 21,000g at 4 °C for 30 min. The pellet was resuspended in RNAse-free water. Then, the RNA was purified using the Monarch RNA Cleanup Kit (500 µg, NEB). The concentration of the RNA was determined by measuring the absorbance at 260 nm using a NanoDrop‚ microvolume UV/Vis Spectrometer (Thermo Fisher). The RNA was stored at −80 °C until further use.
Capping of RNAs
The Vaccina capping cnzyme system (NEB) was used to generate the 5′ cap structure for the RNAs produced in the in vitro transcription reactions. For the cap(0) structure (m7GpppN-), up to 20 µg uncapped RNA was modified in a 40 µl reaction, containing 1 U µl−1 RiboLock (ThermoFisher), 1× capping buffer (NEB), 0.5 mM GTP (ThermoFischer), 0.2 mM S-adenosyl-methionine (SAM, NEB), and 2 µl of Vaccina capping enzyme (homemade, 3 mg ml−1). For a cap(1) structure (m7GpppNm-) on the RNA, the reaction described above included another 2 µl of mRNA cap 2′-O-methyltransferase (50 U µl−1, NEB). The capping reaction was incubated at 37 °C for 4 h.
Then, the RNA in the reaction was purified using the Monarch RNA Cleanup Kit (50 µg, NEB).
Capping was checked by loading 70 ng of the capped RNAs onto a 20% denaturing urea polyacrylamide gel. The gel was stained with SYBR Gold (1:10,000). The gels were scanned on the Typhoon FLA 9500 (GE Healthcare) for SYBR Gold.
3′-Cy5-labelling of RNAs
The RNA was labelled at the 3′ end using RNA liagtion. Up to 5 µg of RNA were used in a 20 µl reaction, containing additionally 0.5 mM ATP (Jena Bioscience), 50 μM Cy5-pCp (Jena Bioscience), 1× buffer (Jena Bioscience), 2 U µl−1 RiboLock (ThermoFisher), 1 µL T4 RNA ligase (Jena Bioscience). The mixture was incubated at 16 °C overnight. The labelled RNA was purified using a Monarch RNA Cleanup Kit (10 µg, NEB).
Endonuclease activity assay
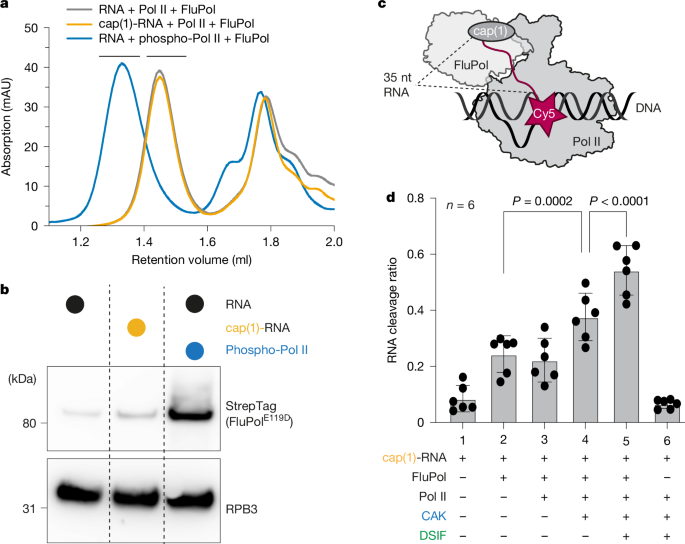
For the endonuclease cleavage assay, 0.05 μM 3′ end Cy5-labelled cap(1)-RNA (m7Gppp2’mrGrArA rGrCrG rArGrA rArGrA rArCrA rCrArGrA rCrArG rCrArG rCrArG rArCrC rArGrG rCr/iCy5C/p) was annealed to 0.05 μM of template DNA (GAT CAA GCT CAA GTA CTT AAG CCT GGT CTA TAC TAG TAC TGC C) in a thermocycler by heating to 72 °C followed by cooling to 4 °C at a rate of 0.1 °C/s. 0.08 μM mammalian Pol II was added to the RNA: DNA hybrid and incubated at 30 °C for 10 min. Then, 0.08 μM non-template DNA (GGC AGT ACT AGT ATT CTA GTA TTG AAA GTA CTT GAG CTT GAT C) was added and incubated at 30 °C for 10 min. Next, 0.12 μM of human elongation factors (DSIF) were added. Furthermore, 0.12 μM CAK and 1 mm ATP were added to generate phosphorylated Pol II. The mixture was incubated at 30 °C for 30 min. After that, 0.01 μM viral WT FluPol or mutated FluPol with equimolar panhandle 5′ vRNA (/5Phos/rArGrU rArGrU rArArC rArArG rArG) and 3′ vRNA (rCrUrC rUrGrC rUrUrC rUrGrC rU) pre-incubated at 4 °C were added. To control for cleavage defect on RNA only, 10× the amount of FluPol and viral RNAs was used. The reactions were incubated at 30 °C, and samples were taken at 0, 10, and 60 min. These reactions occurred in 50 µl with a final buffer composition of 20 mM HEPES pH 7.4, 150 mM NaCl, 4% (v/v) glycerol, 3 mM MgCl2, 1 U µl−1 RiboLock (Thermo Fisher), and 1 mM TCEP.
The reactions were stopped by adding 1 µl of Proteinase K (NEB) to 7 µl of the sample and incubation on ice for 5 min. Then, 7 µl of 2× RNA Loading Dye (1× TBE, 3.6 M Urea, 0,01% bromophenol blue) was added to the sample. The samples were loaded onto 20% denaturing urea acrylamide gels and ran in 1× TBE buffer for 75–90 min at 300 V. The gels were scanned at the Typhoon FLA 9500 (GE Healthcare) for Cy5 fluorescence with a sensitivity setting (PTM) of 750.
This protocol was modified in the following way to check for Mg2+ dependence of the cap-snatching reaction during the sample preparation for cryo-EM. HEPES pH 7.4 was replaced by Bicine pH 8.5. The Mg2+ concentration was altered to 0.1 mM and 3 mM. The ATP concentration was changed to 0.01 mM and 1 mM to avoid complete chelating of Mg2+ by ATP. FluPolE119D was used instead of wild type. Protein and nucleic acid concentration were change to the concentration used in the sample preparation of cryo-EM in a total volume of 15 µl. The reaction was incubated at 30 °C for 10 min, and then analysed as described above.
Quantification and statistical analysis of endonuclease assays
The gels of the endonuclease activity assays were quantified using Fiji (v.2.9.0)62. Therefore, the lanes were selected using rectangular selection masks. Then, the pixel intensities of each lane were plotted using the built-in gel-analysis functions. The intensity profile from each lane was examined, and individual bands could be distinguished as peaks. Vertical lines were drawn to delimit the peaks. The integrated intensities of each peak were measured and quantified as follows: the intensity of all product bands was divided by the sum of the intensities of all product bands and the substrate band (Extended Data Fig. 1c). The procedure allows us to conclude a normalized cleavage ratio of the FluPol. The results were plotted using Graphpad Prism v.9.4.1, indicating all individual data points as circles.
P values were calculated using a two-sided linear mixed-effects model (condition as a fixed effect, experiment as a random effect) with no correction for multiple testing. P values are indicated in the figure.
In vitro FluPol transcription activity assay
For assays, 0.19 μM cap(1)-RNA (rGrArA rGrCrG rArGrA rArGrA rArCrA rCrArGrA rCrArG rCrArG rCrArG rArCrC rArGrG rC) was annealed to 0.19 μM of template DNA in a thermocycler by heating to 72 °C followed by cooling to 4 °C at a rate of 0.1 °C s−1. Mammalian Pol II (0.31 μM) was added to the RNA: DNA hybrid and incubated at 30 °C for 10 min. Then, 0.31 μM non-template DNA was added and incubated at 30 °C for 10 min. Next, 0.12 μM of DSIF were added. Furthermore, 0.50 μM CAK and 1 mm ATP were added to generate phosphorylated Pol II. The mixture was incubated at 30 °C for 30 min. After that, 0.62 μM viral FluPol with modified panhandle vRNAs (3′ vRNA with high G content, rCrUrG rUrGrU rGrCrC rUrCrU rGrCrU rUrCrU rGrCrU and 5′ vRNA /5Phos/rArGrU rArGrU rArArC rArArG rArG) pre-incubated at 4 °C were added. Furthermore, 0.10 μM of CTP and GTP were added, as well as 0.77 µCi µl−1 α-32P-CTP. The reactions were incubated at 30 °C for 2 h. These reactions occurred in 12.9 µl with a final buffer composition of 20 mM HEPES pH 7.4, 150 mM NaCl, 4% (v/v) glycerol, 3 mM MgCl2, 1 U µl−1 RiboLock (Thermo Fisher), and 1 mM TCEP.
The reactions were stopped by adding 1 µl of Proteinase K (NEB) to the sample and incubation at 37 °C for 15 min. Then, 14 µl of 2× RNA Loading Dye (1× TBE, 3.6 M Urea, 0,01% bromophenol blue) was added to the sample. The samples were loaded onto 20% denaturing urea acrylamide gels and ran in 1× TBE buffer for 75 min at 300 V. The gels were incubated for 2 h on a phosphorus screen. The screen was scanned at the Typhoon FLA 9500 (GE Healthcare) with PTM = 800.
Analytical gel filtration on Äkta µ
For an assembly in a 50 µl reaction, 42.75 pmol RNA was annealed to 42.75 pmol template DNA as described for the endonuclease assay. 28.5 pmol mammalian Pol II was added to the RNA:DNA scaffold, followed by 57 pmol of non-template DNA, and incubated at 30 °C for 10 min after each addition. Next, 0.8 μM CAK, 1 mM ATP, and 57 pmol human transcription elongation factors were added and incubated at 30 °C for 30 min. The CAK was omitted for the non-phosphorylation assays. Then, pre-mixed 57 pmol viral FluPol (endonuclease inactive version PA(E119D)) with equimolar panhandle 5′ vRNA (/5Phos/rArGrU rArGrU rArArC rArArG rArG) and 3′ vRNA (rCrUrC rUrGrC rUrUrC rUrGrC rU) were added to the mix. Last, the reaction was incubated at 30 °C for an additional 10 min. The final buffer composition was 50 mM Bicine pH 8.5 at 4 °C, 150 mM NaCl, 4% (v/v) glycerol, 3 mM MgCl2 and 1 mM TCEP.
The fully formed complex was centrifuged at 21,000g at 4 °C for 10 min. The supernatant was injected onto a Superose 6 Increase 3.2/300 column (Cytiva) and ran in SEC buffer (20 mM Bicine pH 8.5 at 4 °C, 150 mM NaCl, 4% (v/v) glycerol, 3 mM MgCl2, 1 mM TCEP) on an ÄKTAmicro (GE Healthcare) system. The absorbances at 280 nm (protein) and 260 nm (RNA/DNA) were measured. The absorbance data were plotted using GraphPad Prism v.9.4.1. The main elution fractions were analysed by SDS–PAGE.
Western blot
Samples of the peak fractions were collected to compare the presence of FluPol in the Pol II containing fractions, mixed with 4× SDS-loading dye (ThermoFisher), and stored at −20 °C until analysis.
The samples were run on one SDS–PAGE (NuPAGE 4–12% Bis-Tris, Invitrogen) in 1× MES buffer (Invitrogen). The gel was then blotted onto a nitrocellulose membrane (GE Healthcare) using a wet-blot system (ThermoFisher) in NuPAGE transfer buffer (Invitrogen). The blot was then blocked for 1 h at room temperature with 5% (w/v) milk powder in PBS-T. Then, the membrane was cut horizontally at the 50 kDa line. The upper half was incubated overnight with a rabbit anti-Strep antibody (1:1,000 dilution; ab76949, Abcam) against the StrepTag II on the FluPol. The lower half was incubated with a rabbit anti-RPB3 polyclonal (1:2000 dilution; A303-771A, Bethyl) as a loading control.
The following day, the membranes were washed 3 × 1 min and 3 × 10 min with PBS-T and incubated with an anti-rabbit antibody coupled to horseradish peroxidase (1:1,000; NA937, GE Healthcare) in PBS-T with 5% milk powder. Then, the membrane was washed three times with PBS-T for 10 min, developed with SuperSignal West Pico Substrate (Thermo Fisher), and scanned using a ChemoCam Advanced Fluorescence imaging system (Intas Science Imaging).
To assess steady-state levels of A/WSN/33-derived PA and PB2 proteins, total lysates of HEK-293T cells transfected with the corresponding pcDNA3.1 expression plasmid were prepared in Laemmli buffer. Proteins were separated by SDS–PAGE using NuPAGE™ 4–12% Bis-Tris gels (Invitrogen) and transferred to nitrocellulose membranes which were incubated with primary antibodies directed against PA (GTX125932, 1:5,000), PB2 (GTX125925, 1:5,000) or tubulin (Sigma Aldrich T5168, 1:10,000) and subsequently with horseradish peroxidase-tagged secondary antibodies (Sigma Aldrich, A9044 and A9169, 1:10,000). Membranes were developed with the ECL2 substrate according to the manufacturer′s instructions (Pierce) and chemiluminescence signals were acquired using the ChemiDoc imaging system (Bio-Rad). Uncropped gels are provided as a source data file.
Sample preparation for Cryo-EM
First, 180 pmol cap(1)-RNA was annealed to 180 pmol 5′-Cy5-labelled template DNA, as stated previously. 120 pmol mammalian Pol II was added to the RNA-DNA scaffold and incubated at 30 °C for 10 min. Then, 240 pmol of non-template was added and kept at 30 °C for 10 min. Next, 1 μM CAK, 1 mM ATP and 240 pmol human transcription elongation factors were added and incubated at 30 °C for 30 min. Last, pre-mixed 240 pmol viral FluPol (endonuclease inactive version PA(E119D)) with equimolar 5′ and 3′-vRNAs was added to the mix and incubated at 30 °C for 10 min. The 3′-vRNA was ATTO532-labelled on the 5′ end. The complex was assembled in a buffer containing 50 mM Bicine pH 8.5 at 4 °C, 150 mM NaCl, 4% (v/v) glycerol, 0.1 mM MgCl2 (3 mM MgCl2 for post-cleavage conformation, 0.1 mM MgCl2 for pre-cleavage conformation), and 1 mM TCEP in a volume of 150 µl. The fully formed complex was centrifuged at 21,000g at 4 °C for 10 min.
The sample was loaded on a continuous 10–40% glycerol gradient containing assembly buffer components. The heavy solution contained additionally 0.1% (v/v) glutaraldehyde. The gradient was centrifuged at 33,000 rpm in a SW60 rotor (Beckman Coulter) at 4 °C for 16 h. The next day, the gradient was fractionated in 200 µl fractions. The cross-linker was quenched by adding 100 mM Tris-HCl pH 8.0 at 4 °C. Fractions were analysed by NativePAGE 3–12% (Bis-Tris, Invitrogen) run at 4 °C. The gel was then scanned for Cy5 and ATTO532 signals, followed by Coomassie staining.
Then, the complex containing fractions were dialysed against 20 mM Tris pH 8 at 20 °C, 20 mM Bicine pH 8.5 at 4 °C, 100 mM NaCl, 4% (v/v) glycerol, 0.1 mM MgCl2 (3 mM MgCl2 for post-cleavage conformation, 0.1 mM MgCl2 for pre-cleavage conformation), and 1 mM TCEP using a 20 kDa Slide-A-Lyzer MINI device (Thermo Fisher) at 4 °C for 4 h. Onto the sample was a continuous carbon film of roughly 3 nm floated for 5 min. The carbon was then fished with a glow-discharged holey carbon grid (Quantifoil R3.5/1, copper, mesh 200). Four microlitres of dialysis buffer was added to the grid, and the grid was placed in a Vitrobot Mark IV (Thermo Fisher) under 100% humidity at 4 °C. The grids were then blotted using Whatman paper with a blot force of 5 for 5 s and directly plunge-frozen in liquid ethane.
Cryo-EM analysis and image processing
A Titan Krios G2 transmission electron microscope (FEI) operated at 300 keV, equipped with a GIF BioQuantum energy filter (Gatan) and a K3 summit direct detector was used to acquire cryo-EM data. Data acquisition was performed at a pixel size of 1.05 Å per pixel using Serial EM, corresponding to a nominal magnification of 81,000× in nanoprobe EFTEM mode.
The pre-cleavage dataset was collected in 5 batches. A total of 60,032 movie stacks were collected. Each movie contained 40 frames and was acquired in counting mode over 1.95 s. The defocus was set to values between −0.1 to −2.0 µm. The dose rate was 20.48 e− Å−2 s−1, leading to a total dose of 39.94 e− Å−2.
The post-cleavage dataset was collected in 3 batches. A total of 20,509 movie stacks were collected. Each movie contained 40 frames and was acquired in counting mode over 2.4 s. The defocus was set to values between −0.1 to −2.0 µm. The dose rate was 18.34 e− Å2 s−1, leading to a total dose of 40 e− Å−2.
Data preprocessing, including stacking, contrast transfer function (CTF) estimation, and dose-weighting, was done using Warp63. In Warp, particles were also picked using an on this data set trained version of the neural network BoxNet2.
For the post-cleavage dataset, 11,935,228 particles were extracted in five batches in RELION-3.1.0 (ref. 64) using a binning factor of four. The box size of the particles was set to 112 pixels with a pixel size of 4.2 Å per pixel. The particles were then imported into cryoSPARC (v.4.3.1)65. In cryoSPARC, particles that do not align were removed, as well as particles that do not contain Pol II using 3D heterogeneous refinements. The 1,975,313 particles that contain Pol II were transferred to RELION and extracted with a box size of 448 pixels and a pixel size of 1.05 Å pixels. These particles were refined using a mask around the Pol II core, followed by Bayesian polishing and CTF refinement for beam tilt and per-particle defocus values. The particles were reloaded into cryoSPARC, combined into three datasets, followed by one round of heterogeneous refining for FluPol occupancy. Then, the datasets were individually non-uniformly refined, locally refined onto the FluPol, and 3D classified. The data sets were merged, locally refined for FluPol, and two times 3D classified. From a final dataset of 63,230 particles, focus refinements on FluPol, Pol II core, Pol II stalk and the interface were performed.
For the pre-cleavage dataset, 6,423,874 particles were extracted in three batches in RELION-3.1 (ref. 64) using a pixel size of 4.2 Å per pixel and a box size of 112 pixels. The particles were then imported into cryoSPARC (v.4.3.1)65. In cryoSPARC, particles that do not align were removed, as well as particles that do not contain Pol II using 3D heterogeneous refinements. The 1,937,625 particles that contain Pol II were transferred to RELION and extracted with a box size of 448 px and a pixel size of 1.05 Å/px. These particles were refined using a mask around the Pol II core, followed by Bayesian polishing and CTF refinement for beam tilt and per-particle defocus values. The particles were focused refined, and classified on the Pol II core, taking only the particles of the class with good-looking Pol II. These particles were globally classified for FluPol occupancy and then focussed classified on FluPol for well-aligning FluPol particles. This final particle set of 369,858 particles was focused refined on Pol II, CTF refined, and Bayesian polished. Focus refinements for Pol II core and FluPol were performed on the basis of the obtained consensus refinement.
Model building
For both structures, initial models of S. scrofa domesticus Pol II (PDB: 7B0Y66), SPT5 KOW2, KOW3, KOWx-4 and KOW5 domains (PDB: 5OIK and 5OHO33) and FluPolA/H7N9 (PDB:7QTL35) were rigid body fitted in ChimeraX 1.6.1 (ref. 67) using the consensus refinement. The RNA and DNA were manually adjusted in Coot68 to fit the sequences used in this study. As the density of the RNA in the endonuclease site is not well enough resolved to call a sequence, we modelled the sequence according to the biochemistry. The linker between KOWx-4 and KOW5 was manually built as well, assuming that the best visible amino acid at the G1 nucleotide is the first phenylalanine of the linker. This model, the focused maps, and the consensus map were loaded into ISOLDE 1.6.0 (ref. 69). The focused maps were aligned to the consensus map in ChimeraX. In ISOLDE, Molecular Dynamic simulation was performed using the starting model restrains. Then, the individual protein components were subjected to Real Space Refinement in PHENIX70 and manual curation in Coot.
For the pre-cleavage conformation, Pol II and KOW5 were refined against the focused map for Pol II. FluPol was refined against the focused map for the FluPol. KOWx-4 was refined against the consensus map.
Pol II (except RPB4 and RPB7) was refined against the Pol II-focused map for the post-cleavage state. SPT5 KOW2, KOW3, KOWx-4, RPB4 and RPB7 were refined against the stalk-focused map. FluPol was refined against the focused map for the FluPol.
Then, the Pol II elongation complex components and the FluPol were rigid body docked into the consensus map in ChimeraX before manually checking interface residues in Coot using the consensus map. The density for SPT4 and SPT4 NGN and KOW1 domain is not well resolved, so the consensus map was lowpass filtered to 6 Å. A deposited model (PDB: 5OIK for pre-cleavage, and 7YCX71 for post-cleavage) for these domains was rigid body fitted into this filtered map using ChimeraX. Interfaces were checked for major clashes. Clashing residues without density were modified in Coot using the most likely non-clashing rotamer.
To determine the range of possible RNA lengths, a series of FluPol structures was modelled in Coot by cropping nucleotides in the less-resolved space between cap-binding domain and endonuclease domain. Then, these structures were loaded into ISOLDE and the RNA was real-space refined. The lower limit was defined as when ISOLDE shifted the RNA through the endonuclease domain. The upper limit was determined by incrementally increasing the RNA length in Coot, refined in ISOLDE, and visually inspected until the obtained model deviated from an expected linear RNA geometry.
Selection of interface residues for mutational analysis
First, a list of 38 amino residues at the interfaces was generated, see Supplementary Table 2. In SnapGene, 7.0.1 two MUSCLE alignments were performed for PA and PB2 (Extended Data Fig. 4a,b). Each alignment contained sequences of 6 influenza A viruses, 2 influenza B viruses, and one influenza C and D virus. Sequences of the following strains were used: A/Zhejiang/HZ1/2013 (H7N9), A/WSN/1933 (H1N1), A/California/04/2009 (H1N1), A/California/04/2009 (H1N1), A/Victoria/3/1975 (H3N2), A/Little-yellow-shouldered-bat/Guatemala/2010 (H17N10), B/Lee/1940, B/Memphis/13/2003, C/Johannesburg/1/1966, D/Bovine/Minnesota/628/2013. The 16 residues with a MUSCLE score of above 50 were considered conserved. These amino acids were mutated to alanine. All mutants were checked for the expression level. The mutant Y131A showed a reduced expression level and was consequently excluded for further analysis. We tested furthermore the following double and triple mutants: PA S140A and E141A; PB2 R375A and R380A; and PB2 D466A, T468A and S470A. From these mutants, only PB2 R375A and R380A had wild-type expression levels.
To investigate the evolutionary conservation of the binding interfaces between mammals and birds, four mammalian species, four bird species and Caenorhabditis elegans were used. Sequences were identified using the BLAST algorithm of Uniprot using the selected species as a search target. To select for the bird species, the human RPB1 sequence was blasted against all avian protein sequences available in Uniprot. Only four bird species had full-length annotated RPB1. These species were used as a search filter while blasting human RPB3, RPB11 and SPT5. A list of all Uniprot sequence IDs is available upon request. The obtained sequences were aligned in Snapgene using the ClustalOmega algorithm. Alignments are depicted in Extended Data Fig. 4d–g.
Cell-based minigenome assay
The plasmids and procedure used for minigenome assays are described in ref. 42. The primers used for mutagenesis of the PB2 and PA plasmids can be provided upon request. In brief, 3 × 10⁴ HEK-293T (obtained from ATCC, authenticated by ATCC using STR profiling, tested for mycoplasma) cells were co-transfected with plasmids encoding the vRNP protein components (PB2, PB1, PA, NP) from the A/WSN/33 (WSN) virus, a pPolI-Firefly plasmid encoding a negative-sense viral-like RNA expressing the firefly luciferase and the pTK-Renilla plasmid (Promega) as an internal control. Mean relative light units (RLUs) produced by the firefly and Renilla luciferase, reflecting the viral polymerase activity and transfection efficiency, respectively, were measured using the Dual-Glo Luciferase Assay System (Promega) on a Centro XS LB960 microplate luminometer (Berthold Technologies, MikroWin v.4.41) at 24 h post-transfection (hpt). Firefly luciferase signals were normalized with respect to Renilla luciferase. To quantify steady-state levels of mRNA, complementary RNA (cRNA) and vRNA, 3 × 10⁵ HEK-293T cells were seeded in 12-well plates and transfected with plasmids encoding the vRNP components (PB2, PB1, PA and NP), along with 5 ng per well of a WSN-NA RNA-expressing plasmid. Total RNA was extracted 24 h after transfection using RNeasy Mini columns (Qiagen), following the manufacturer’s protocol. Strand-specific RT–qPCR was then performed46. In brief, reverse transcription was carried out using primers specific to the viral NA mRNA, cRNA, vRNA and the cellular GAPDH mRNA, with the SuperScript III Reverse Transcriptase (Invitrogen). Quantification was done using SYBR Green (Roche) on the LightCycler 480 system (Roche, Software v.1.5.0.39). RNA levels were normalized to GAPDH when indicated, and relative expression was calculated using the 2−ΔΔCT method72.
Production and characterization of recombinant viruses
The recombinant WSN virus mutants were produced by reverse genetics. In brief, a mix of 3 × 10⁵ MDCK (obtained from National Influenza Center, not authentified in-house, tested for mycoplasma) and 4 × 10⁵ HEK-293T cells were plated in 6-well plate one day before transfection with a mix of 4 expression plasmids for WSN-PB1, PB2, PA and NP proteins and 8 PolI-based plasmids for the 8 viral RNAs, one of the latter carrying a mutation (PA(Y131A), PA(K104A/E141A), PB2(E452R), PB2(D466R), PB2(E452A/D466A) or PB2(K482E)) in Opti-MEM (Gibco) using FuGene6 (Promega) according to the manufacturer’s instructions. The following day, cells were washed twice with DMEM and incubated for 48 h at 37 °C in DMEM containing TPCK-treated Trypsin (Sigma, 0.5 µg ml−1). Viral reverse genetic supernatants were collected, centrifuged and titrated on MDCK cells by plaque assay73. For viral amplification, MDCK cells were infected with the reverse genetic supernatants at an MOI of 0.001 or 0.0001 and incubated for 72 h at 37 °C in DMEM containing TPCK-treated Trypsin (Sigma, 1 µg ml−1). The viral supernatants (P1) were titrated by plaque assay and plaque diameters were measured using the Fiji software. Viral RNA was isolated from P1 viral stocks using the QIAamp Viral RNA Mini kit (Qiagen). The eight genomic segments were subjected to reverse transcription and amplification74. Next generation sequencing was performed using the Nextera XT DNA Library Preparation kit (Illumina), the NextSeq 500 sequencing systems (Illumina) and the IGV 2.19_4 software for analysis.
Reporting summary
Further information on research design is available in the Nature Portfolio Reporting Summary linked to this article.
First Appeared on
Source link

