Mitochondrial complex III-derived ROS amplify immunometabolic changes in astrocytes and promote dementia pathology
Reagents
Details for chemicals, antibodies, primers and other reagents used are listed in Supplementary Tables 4 and 5. Amyloid-β oligomers were prepared from HFIP-dried or TFA-precipitated peptides (r-Peptide). TFA-peptides were solubilized into monomers with ice-cold HFIP for 2 h before evaporating overnight in a chemical safety cabinet. Oligomerization-state was evaluated by western blotting, as previously described103. S3QEL2 was sourced from Cayman Chemicals or custom synthesized by WuXi Apptec. Before use, the potency of new S3QEL2 stocks was evaluated in isolated skeletal muscle mitochondria, as originally described3. The half-maximum inhibitory concentration (IC50) against CIII ROS production for S3QEL2 preparations ranged 1.4–1.7 µM, in agreement with the originally reported IC50 of 1.7 µM. S3QEL1.2 was custom synthesized by WuXi Apptec. During pre-HPLC (formic acid) purification, two stereoisomers were identified, separated as Peak 1 (confirmed trans arrangement of cyclohexane ring) and Peak 2 (unconfirmed cis arrangement), and distinguished by 1H-NMR (400 MHz, dimethylsulfoxide (DMSO)): S3QEL1.2 Peak 1 (trans) = δ 8.16 (t, J = 5.6 Hz, 1H), 8.07 (dd, J = 7.8, 1.2 Hz, 1H), 7.78–17.84 (m, 1H), 7.63 (d, J = 8.0 Hz, 1H), 7.52–7.58 (m, 3H), 7.43– 7.49 (m, 1H), 7.36–7.41 (m, 2H), 6.36 (dd, J = 3.0, 1.8 Hz, 1H), 6.15–6.18 (m, 1H), 4.55 (s, 2H), 4.20 (d, J = 5.8 Hz, 2H), 3.88–3.96 (m, 2H), 2.04– 2.17 (m, 1H), 1.89 (s, 1H), 1.57–1.74 (m, 4H), 1.22–1.28 (m, 2H), 1.00–1.15 (m, 2H); S3QEL1.2 Peak 2 = δ 8.16 (t, J = 5.6 Hz, 1H), 8.07 (dd, J = 8.0, 1.2 Hz, 1H), 7.81 (td, J = 7.6, 1.6 Hz, 1H), 7.63 (d, J = 7.8 Hz, 1H), 7.52–17.58 (m, 3H), 7.43–7.49 (m, 1H), 7.35–7.40 (m, 2H), 6.36–6.39 (m, 1H), 6.17–6.20 (m, 1H), 4.55 (s, 2H), 4.25 (d, J = 5.6 Hz, 2H), 4.01 (br d, J = 6.4 Hz, 2H), 2.23–2.31 (m, 1H), 1.95–2.05 (m, 1H), 1.77–1.88 (m, 2H) and 1.33–1.52 (m, 6H). During potency assessment against CIII ROS, the IC50 of S3QEL1.2 Peak 1 (trans) was determined to be tenfold lower than S3QEL1.2 Peak 2 (52 nM versus 525 nM), so S3QEL1.2 Peak 1 (trans) was used in all subsequent experiments and is referred to as S3QEL1.2 in the text. The IC50 of S3QEL1.2 Peak 1 (trans) closely matches the expected IC50 based on estimates for unseparated S3QEL1.2 (approximately 50–100 nM)3.
Molecular biology and adeno-associated virus preparation
The mtHyPer7 H2O2 sensor targeted to the mitochondrial matrix was PCR-amplified from pCS2+MLS-HyPer7 (donated by V. Belousov, Addgene plasmid 136470; RRID: Addgene_136470) with primers containing SalI and HindIII restriction sites 5′ and 3′ to the coding sequence, respectively (SalI primer = 5′-ATA GTC GAC GAA TTC GCC ACC ATG; and HindIII primer = 5′-GAG AAG CTT GCT AGC TCA ATC GCA GAT GAA GCT AA). For astrocytic expression driven by the truncated human GfaABC1D promoter28,104, digested amplicon was ligated in place of the DIO-TDP43 sequence of pAAV-GfaABC1D-DIO-TDP43(WT)-WPRE-hGHpA28 to generate pAAV-GfaABC1D-mtHyPer7-WPRE-hGHpA. For neuronal expression, the digested amplicon was ligated in place of the mCherry-T2A-CXCR3-Nrxn coding sequence of pAAV-hSyn1-mCherry-T2A-CXCR3-2HA-Nrxn-WPRE-hGHpA28 to generate pAAV-hSyn1-mtHyPer7-WPRE-hGHpA.
Plasmids encoding codon-optimized Cliona intestinalis AOX and catalytically inactive AOX were cloned based on sequence in MAC_C_AOX (donated by M. Varjosalo; Addgene plasmid 111661; RRID: Addgene_111661). An internal BamHI site was silently destroyed in both vectors and four missense mutations were taken from GenBank Accession MW222237 to generate catalytically inactive AOX. BamHI-AOX-NheI and BamHI-AOXmut-NheI DNA sequences without stop codons were synthesized and cloned into pUC-Amp by Genewiz. Coexpression of AOX and mtHyPer7 in astrocytes was achieved by first replacing the NEUROD1 sequence in pAAV-GfaABC1D-NEUROD1-T2A-mCherry (donated by C.-L. Zhang, Addgene plasmid 178582; RRID: Addgene_178582) with AOX or AOXmut using standard BamHI and NheI digestion and ligation to generate pAAV-hGfaABC1D-AOX-T2A-mCherry-WPRE-hGHpA and pAAV-hGfaABC1D-AOXmut-T2A-mCherry-WPRE-hGHpA. mtHyPer7 was cloned in place of the mCherry reporter in these vectors by removing the AgeI-mCherry-HindIII and replacing with PCR-amplified and digested Eco88I- mtHyPer7-HindIII using Eco88I-containing forward primer = 5′-CTA CCC GGG ATG TCC GTC CTG ACG CCG and HindIII-containing reverse primer = 5′-ACT AAG CTT TCA ATC GCA GAT GAA GCT.
Mutant human tauP301S was cloned for AAV-mediated, neuron-specific expression in two stages. First, the wild-type human tau sequence in a pcDNA3.1+ tau-WT-(1N4R) vector (W. Luo, Weill Cornell Medicine) was mutagenized with a Q5 Site-Directed Mutagenesis kit (New England Biolabs) to the P301S mutant using forward primer 5′-ATC AAA CAC GTC TCG GGA GGC GGC and reverse primer 5′-ATT ATC CTT TGA GCC ACA CTT GGA CTG GAC. Next, the validated tauP301S sequence was PCR-amplified with primers containing SalI and EcoRI restriction sites 5′ and 3′ to the coding sequence, respectively (SalI primer = 5′-TAG ATA GTC GAC TCC GGA ATG GCT GAG CCC CGC C; EcoRI primer = 5′-GGC CGA GAA TTC CAA TTG TCA CAA ACC CTG CTT GGC CAG G). Digested amplicon was ligated in place of the DIO-rM3D(Gs)-mCherry sequence of Addgene plasmid 50458 (donated by B. Roth; RRID: Addgene_50458) to generate pAAV-hSyn1-tauP301S-(1N4R)-WPRE-hGHpA.
The AAV vector for astrocyte-specific Cre-dependent expression of 3xHA-tagged Rpl22105 was generated by PCR amplifying the Rpl22-3xHA sequence from pZac2.1-GfaABC1D-Rpl22-HA (donated by B. Khakh; RRID: Addgene_111811) using primers containing NheI and AscI restriction sites 5′ and 3′ to the coding sequence, respectively (NheI primer = 5′-CTA TAG GCT AGC GCC GCC ATG GCG CCT GTG AA; and AscI primer = 5′-TCT AGA GGC GCG CCC TAC TGA GCA GCG TAA TC). Digested amplicon was ligated in place of the TDP43 coding region of pAAV-GfaABC1D-DIO-TDP4328 to generate pAAV-GfaABC1D-DIO-Rpl22-HA-WPRE-hGHpA.
NEB 5-α cells (New England Biolabs) were transformed with pAAV constructs and the integrity of inverted terminal repeats and expression-related elements in selected clones were confirmed by sequencing (Azenta/Genewiz) and restriction digests. AAV2/DJ-hSyn1-tauP301S-(1N4R) particles were produced by the Stanford Neuroscience Gene Vector and Virus Core Facility (RRID:SCR_023250). AAV2/PHP.eB-hGfaABC1D-DIO-Rpl22-HA-WPRE-hGHpA particles were produced by the UPENN Vector Core (RRID: SCR_022432). AAV2/1-CMV-Cre-mCherry was obtained from the University of Iowa Viral Vector Core Facility (Lot Iowa 6855) to express Cre recombinase in WT and Slc8b1-f/f primary astrocytes.
Mice
All animal experiments were conducted in accordance with guidelines set by the Institutional Animal Care and Use Committee of Weill Cornell Medicine. Mice were housed up to five mice per cage in a vivarium and maintained on a 12 h light–dark cycle at 21.1‒23.3 °C and 30%‒70% humidity with ad libitum access to food and water. Experiments were conducted during the light cycle and included littermate controls. Nontransgenic C57BL/6J mice (Jackson Laboratory stock no. 000664), Aldh1l1-Cre mice (B6;FVB-Tg(Aldh1l1-cre)JD1884Htz/J, Jackson Laboratory stock no. 023748) and floxed-stop AOX mice (fl-stop AOX)34 were used for primary cultures. Aldh1l1-Cre mice were backcrossed onto the C57Bl/6J background and express Cre recombinase downstream of the astrocytic Aldh1l1 promoter. Aldh1l1-Cre mice were chosen for the strong astrocyte selectively of the Aldh1l1 promoter in neural tissues106,107,108,109. SNAP-tag floxed-stop AOX mice were generously provided by A. Galkin (Weill Cornell Medicine)110. Slc8b1-floxed mice were generously provided by J. Elrod (Temple University)100. Transgenic mice expressing mutant human tauP301S (B6;C3-Tg(Prnp-MAPT*P301S)PS19Vle/J, Jackson Laboratory stock no. 008169) and nontransgenic littermates were maintained on a B6/C3 hybrid background. Only male tauP301S mice were used in experiments because we and others have observed less pronounced and more variable pathology and early mortality in female littermates58.
In vivo experiments
Pharmacokinetics
Levels of S3QEL2 and S3QEL1.1 in plasma from peripheral blood and saline-perfused brain tissue were quantified by liquid chromatography–tandem mass spectrometry (LC–MS/MS) using calibration standards. Oral gavage studies and associated MS analysis were performed by XenoBiotic Laboratories/WuXi AppTec with time points between 0.25–24 h after administration of 5 mg S3QEL2 per kg body weight using 5% DMSO, 5% Cremophor EL and 90% saline as vehicle. All other studies were conducted at Weill Cornell Medicine with perfused and flash-frozen brain tissue shipped on dry ice for LC–MS/MS analysis by Charles River Laboratories. For peripheral injections, S3QEL2 was suspended in DMSO and diluted to 5% DMSO, 5% Cremophor EL and 90% saline just before injection. Perfused tissue was collected 0–3 h after intraperitoneal injection. For oral administration in almond butter, S3QEL2 or S3QEL1.1 or DMSO vehicle were thoroughly mixed with a sterile spatula in almond butter (Justin’s Classic) pre-weighed into 30-ml plastic medicine cups. Dosing mixtures were then distributed to 15-ml (0.5 oz) plastic feeding cups according to the total mouse weight within each cage (divided into one or two cups for 1–3 or 4–5 mice per cage) to deliver an average of 5 mg S3QEL2 or 3 mg S3QEL1.1 per kg body weight. In time-monitored trials, all mice readily consumed 0.75 g almond butter per 30 g body weight within 2–3 h. For timed dosing trials with almond butter, tissue was collected between 0–24 h. For chronic daily dosing with almond butter for up to 3 months, mice were weighed at least once weekly, and dosing was adjusted accordingly. Daily dosing of 0.75 g almond butter supplement for this duration did not influence body weight. For chronic continual dosing with S3QEL2, chow was formulated with 0–480 mg S3QEL2 per kg Purina 5053 rodent chow by Research Diets (New Jersey). Irradiated chow was stored in Ziploc freezer bags at –80 °C for up to 6 months, and individual bags moved to 4 °C storage for up to 1 month during feeding. The weights of mice, chow provided and chow remaining in food hopper were measured every 1–7 days depending on the trial, stage and duration.
Therapeutic dosing trials
TauP301S mice were dosed daily with 5 mg kg−1 S3QEL2 in almond butter from 8.5–10 months of age. One tauP301S mouse did not consume S3QEL-containing almond butter and was excluded from final analyses. Distinct cohorts of tauP301S mice were dosed with formulated chow (0, 120 or 240 mg S3QEL2 per kg chow) starting at 4 months of age. For pathological, biochemical, and molecular evaluations, tauP301S mice and nontransgenic littermates were killed at 9–10 months of age. For lifespan evaluations, cohorts were dosed continuously with chow until natural mortality or pre-established criteria for humane end points (for example, loss of more than 20% peak body weight). Nontransgenic littermates of tauP301S mice were continuously dosed with 0–240 mg S3QEL2 per kg chow between 4–27 months of age and were assessed for VO2, VCO2 and distance travelled over 24 h using Promethion Metabolic Screening cages (Sable Systems). Cohorts were run in groups of eight and analyses of metabolic data was performed by the Weill Cornell Medicine Metabolic Phenotyping Center.
Hindlimb clasping
After five weeks of vehicle or S3QEL2 administration, nontransgenic or tauP301S male mice (10 months old) were suspended by the tail for up to 60 s and the time until sustained (>2 s) single or double hindlimb clasp was recorded. Mice that did not clasp were scored at 60 s. TauP301S mice exhibiting hindlimb paralysis were not tested and assigned a score of 0 s (refs. 53,111).
Open field activity
After five weeks of vehicle or S3QEL2 administration, nontransgenic or tauP301S male mice (10 months old) were placed in the centre of a clear plastic chamber (41 × 41 × 30 cm) with two 16 × 16 photobeam arrays detecting horizontal and vertical movements. Light in the room was set to 75% red light to limit the anxiolytic effect of 100% white light. Total exploration, rearings and the time spent in the centre or periphery of the arena were measured with an automated Flex-Field/Open Field Photobeam Activity System (San Diego Instruments). The apparatus was cleaned with 70% alcohol between mice28.
Cell culture experiments
All cultures were maintained at 37 °C in a humidified 5% CO2-containing atmosphere. All primary cells were from cortices and hippocampi from mixed sex pups.
Primary astrocyte cultures
Pups at postnatal day 2–3 were dissected in cold PBS (Corning) to remove meninges and dissociated by manual trituration with a P1000 pipette in 1 ml fresh glial culture medium consisting of high-glucose DMEM without glutamine or pyruvate (Corning) and supplemented with 20% heat-inactivated FBS (VWR), 1× GlutaMAX (Thermo Fisher) and 1 mM sodium pyruvate (Thermo Fisher). Cell suspensions were diluted to 3 ml with medium, filtered through a 70 μm cell strainer (VWR), centrifuged at 500g for 5 min at 22 °C, resuspended with culture medium and plated into cell culture dishes (Corning Costar) or glass-bottom plates (Greiner Bio-One). All culture dishes and plates were pre-coated at ambient temperature for at least 30 min with sterile-filtered 100 µg ml−1 poly-D-lysine (Millipore-Sigma or Thermo Fisher) dissolved in cell culture-grade water (Corning) and then rinsed thoroughly with water and dried before seeding cells. At DIV 4–5, the cells were washed in conditioned medium to remove debris before replacement with fresh medium. Cells were used for experiments after 7–14 days in culture. Primary astrocyte cultures were determined to contain greater than 96.5% astrocytes and less than 3.0% microglia, based on immunolabelling for glutamine synthetase, SOX9, Iba1 and DAPI (described under ‘Immunocytochemistry’). Unless specified otherwise, astrocytes were treated during a full medium change to include one or more of the following reagents: 0.3–3 µM S3QEL1.2, 1–20 µM S3QEL2, 1 µM S1QEL1.1, 10 µM S1QEL2.2, 0.1 µM BAY-2402234, 1 µM selegiline, 10–20 µM antimycin A, 5 µM MitoParaquat (MitoPQ), 3–10 µM myxothiazol, 3 ng ml−1 IL-1α, 300 nM oAβ, 30 ng ml−1 TNF, 400 ng ml−1 C1q, 33 ng ml−1 IL-6, 10 ng ml−1 IFNγ, 5 µM APX-115, 1 µM TPCA-1, 10 µM CGP 37157, 1 µg ml−1 IL-1Ra, 3 µM IKK-16, 10 ng ml−1 oncostatin M and 1 µg ml−1 of recombinant 0N4R human tau fibrils (a gift from S.-A. Mok)112,113. Stimuli and inhibitors were co-applied for entire treatment durations except for experiments that included TPCA-1, CGP 37157, IL-1Ra and IKK-16, where astrocytes were pre-treated for 1 h before continued co-treatment with the specified cytokine or pathogenic factor.
Primary microglia cultures
For co-culture experiments, microglia were collected from multiple six-well plates of confluent primary astrocyte cultures at DIV 16–21 by pooling conditioned medium with fresh medium used to gently rinse loose, rounded microglia from the top of the confluent astrocyte layer114. Microglia-enriched suspensions were centrifuged at 1,000g for 5 min and supernatants were carefully aspirated. Pelleted cells were gently combined into a single tube and centrifuged again at 400g for 3 min before carefully aspirating the supernatant and resuspending in glial culture medium for microglia-only cultures or neuronal medium if co-seeded on top of primary neurons (described under ‘Primary microglia-neuron co-cultures’).
For H2O2 efflux and RNA profiling, primary microglial cells were collected from mouse pups at postnatal days 1–3. In brief, brain cortices were isolated and dissociated in 0.05% trypsin-EDTA for 15 min at 37 °C with agitation every 5 min. DNase I (Millipore, 1,000 U) was added and trypsin was neutralized with growth medium (DMEM; Thermo Fisher) supplemented with 10% heat-inactivated FBS (Hyclone). Cells were washed twice by spinning at 500g and resuspending in growth medium. The mixed cultures were maintained in growth medium at 37 °C and 5% CO2 for 2–3 days, followed by a replacement of growth medium containing 5 ng ml−1 granulocyte–macrophage colony-stimulating factor (GM-CSF) to promote microglia proliferation. Primary microglial cells were collected after 10 days by mechanical agitation and 50,000 cells were plated on black-walled, clear-bottom 96-well plates (Corning Costar) pre-coated with poly-D-lysine. Seeded microglia were maintained and treated in high-glucose DMEM without glutamine or pyruvate (Corning) and supplemented with 10% heat-inactivated FBS (VWR), 1× GlutaMAX (Thermo Fisher) and 1 mM sodium pyruvate (Thermo Fisher). One day after seeding, microglia were co-treated with 100 ng ml−1 LPS with or without DMSO vehicle or 20 µM S3QEL2 for 24 h. H2O2 efflux was measured using Amplex UltraRed (described under ‘H2O2 efflux assay’). The efflux rates were normalized to the vehicle condition.
For RNA-related analyses, 3 days after seeding in standard 24- or 96-well plates, microglia-only cultures were treated with 100 ng ml−1 LPS or 3 µM oAβ in prewarmed medium together with DMSO vehicle or 20 µM S3QEL2 for 22–24 h before collecting RNA (described under ‘qPCR’).
Primary neuron cultures
Forebrain neurons at postnatal day 0–1 were obtained as described previously28 with minor modifications. In brief, papain-dissociated cells were filtered through a 40-µm cell strainer (Corning) to enrich for neurons and centrifuged at 500g for 5 min to eliminate small debris. Neurons were suspended in complete neuronal medium consisting of Neurobasal (Thermo Fisher) with B-27 supplement (Thermo Fisher) and 1× GlutaMAX without antibiotics. Cells were seeded at 50,000–55,000 live cells per cm2 into plates coated with 100 µg ml−1 poly-D-lysine. Plating medium was fully exchanged at DIV 1 using the same medium except the substitution for B-27 supplement minus antioxidants (Thermo Fisher). Half-medium exchanges were performed every 3–4 days thereafter.
At 8–9 DIV, neurons in black-walled, clear-bottom 96-well plates (Corning) were transduced with 2.5 × 10⁸ particles of AAV2/DJ-hSyn1-tauP301S-(1N4R)-WPRE-hGHpA per well or treated with PBS vehicle and treated with 1 µM S3QEL2 (Cayman Chemical) or DMSO vehicle during a half-medium exchange (with B-27 minus antioxidants). After 3 days, DMSO or 1× S3QEL2 were added with another half-medium exchange. After 6 days post-transduction, neurons were fixed and labelled for high-content imaging, as described in ‘Immunocytochemistry’.
For H2O2 efflux experiments, neurons were plated as described on black-walled, clear-bottom 96-well plates (Corning Costar) pre-coated with poly-D-lysine and transduced with 2.5 × 10⁸ particles of AAV2/DJ-hSyn1-tauP301S-(1N4R)-WPRE-hGHpA per well or with vehicle for a total of 5 days to capture efflux changes at the onset of degeneration. One day before measurement, neurons were treated with 1 µM S3QEL2. As a positive control, 10 µM MitoCDNB and 5 µM MitoPQ were added 1 h before measurement with Amplex UltraRed (described under ‘H2O2 efflux assay’). The rates of efflux were normalized to protein level per well and then to the vehicle condition.
For live-cell mitochondrial H2O2 imaging, neurons were cultured as described on 96-well glass-bottom microplates (Greiner) pre-coated overnight at 37 °C with sterile-filtered 100 µg ml−1 poly-D-lysine. Cells were transduced with 2.5 × 10⁸ particles of AAV2/DJ-hSyn1-tauP301S-(1N4R)-WPRE-hGHpA per well or with vehicle for a total of 5 days. One day before imaging, neurons were transfected with 100 ng of pAAV-hSyn1-MTS-HyPer7-WPRE-hGHpA per well using Lipofectamine2000 (Thermo Fisher) according to manufacturer instructions. Cells were washed after 5 h and the following day treated for 1 h before imaging with DMSO vehicle or 1 µM S3QEL2 and imaged in Neurobasal (Thermo Fisher) with B-27 supplement without antioxidants (Thermo Fisher) and 1× GlutaMAX without antibiotics. Cells were imaged in an environmental chamber at 37 °C and 5% ambient CO2 with a ×20 objective on a Zeiss LSM 880 confocal laser scanning microscope (described under ‘Live-cell mitochondrial H2O2 imaging’).
Primary astrocyte-neuron co-cultures
Postnatal day 0 neurons were isolated as described above but seeded onto near-confluent monolayers of DIV 4–7 astrocytes as described previously28. Before seeding neurons, astrocytes were rinsed of debris and incubated with prewarmed neuronal medium for 1 h to remove residual serum present in the glial medium.
For end-point imaging experiments, neurons were plated at 45,000 live cells per cm2 and cultured in black-walled 96-well plates as described in ‘Primary neurons cultures’, including the switch to antioxidant-free medium 1 day after plating neurons and half-medium exchanges every subsequent 3–4 days. Neurons were treated with 1 µM S3QEL2 or DMSO vehicle during a half-medium exchange and transduced 15 min later with 1.2 × 10⁹ particles of AAV2/DJ-hSyn1-tauP301S-(1N4R)-WPRE-hGHpA per well. Cultures were fixed and labelled for high-content imaging, as described in ‘Immunocytochemistry’.
For multielectrode array (MEA) experiments, neurons were seeded at 50,000 live cells per well in 48-well CytoView plates (Axion BioSystems). Neurons were seeded for MEA experiments in Neurobasal Plus culture system (Thermo Fisher) with B-27 Plus supplement and 1× GlutaMAX as recommended by Axion BioSystems but switched to medium containing B-27 minus antioxidants at the first half-medium exchange at neuron DIV 5. Before this medium exchange, neuronal activity was recorded for 30 min using the Maestro Pro MEA System at 37 °C and 5% CO2 (Axion BioSystems). Recordings were analysed using Neural Metric Software (Axion BioSystems). Following baseline recording, cells were transduced with 8 × 10⁸ particles of AAV2/DJ-hSyn1-tauP301S-(1N4R)-WPRE-hGHpA per well or treated with PBS vehicle and treated with 1 µM S3QEL2 or DMSO vehicle during a half-medium exchange (with B-27 minus antioxidants). Neuronal activity was recorded every 1–3 days for 10 days with fresh 1× S3QEL or DMSO added with half-medium exchanges every 3 days.
Primary microglia-neuron co-cultures
Postnatal day 0 neurons were seeded at 55,000 per cm2, as described in ‘Primary neuron cultures’, in black-walled, clear-bottom 96-well plates and transduced at DIV 7–8 by diluting 3.5 × 10⁸ particles of AAV2/DJ-hSyn1-tauP301S-(1N4R)-WPRE-hGHpA per well in 25 µl reserved conditioned medium and adding to neurons without medium exchange. The following day, microglia were collected, as described in ‘Primary microglia cultures’ and the final suspension seeded atop neurons in 25 µl fresh neuronal medium at 40,000–50,000 microglia per cm2 without medium exchange. Microglia were allowed to settle onto neurons for 1–2 h in a cell culture incubator before DMSO vehicle or 1 µM S3QEL2 solutions were added in prewarmed, fresh neuronal medium (B-27 minus antioxidants) during a half-medium exchange. Cells were co-cultured for another 5 days before fixing and labelling for high-content imaging, as described in ‘Immunocytochemistry’.
We observed differences in the solubility of S3QELs depending on medium or buffer composition. In particular, S3QELs above approximately 3 µM precipitated in primary neuronal medium but not glial medium that contained 10–20% FBS or buffers that contained added BSA (for example, for determination of S3QEL IC50 in vitro). Therefore, we used 1 µM S3QEL2 in experiments involving primary neurons and either 20 µM S3QEL2 or 0.3–3 µM S3QEL1.2 in experiments involving primary glia; 1 µM S3QEL2 was sufficient in blocking CIII ROS as shown by the effectiveness in preventing neuronal loss and hyperactivity in the presence of astrocytes.
Magpix cytokine measurements
Levels of cytokines in astrocyte-conditioned medium were determined using the Milliplex Mouse Cytokine/Chemokine Magnetic Bead Panel (Millipore-Sigma) according to the manufacturer’s instructions. In brief, primary astrocytes were treated for 24 h with vehicle, 3 ng ml−1 IL-1α, 1 µM oAβ or 1 µg ml−1 0N4R tau fibrils. Astrocyte-conditioned medium was collected, spun down at 21,000g for 10 min at 4 °C and the undiluted supernatant was analysed.
Immunocytochemistry
All immunolabelling steps were performed at ambient temperature unless specified otherwise. In brief, cells were fixed with 4% paraformaldehyde and 4% sucrose in PBS (Corning) for 10 min, rinsed four times with PBS with 0.01% Triton X-100 and blocked and permeabilized in 5% normal goat serum and/or 5% normal donkey serum in 0.2–0.3% Triton X-100 in PBS for 1 h. Cells were incubated overnight at 4 °C with primary antibodies diluted in 1% BSA (Sigma), 2% normal donkey serum or 2% normal goat serum in 0.2–0.3% Triton X-100 in PBS: anti-human tau (clone HT7) (Thermo Fisher, MN1000; 1:50), anti-tau (clone Tau5) (Millipore-Sigma, MAB361; 1:400), anti-MAP2 (Abcam, ab5392; 1:3,200), anti-NeuN (Millipore-Sigma, ABN78; 1:1,000), anti-Iba1 (Wako, 019-19741; 1:1,000), anti-SOX9 (Millipore-Sigma, AB5535; 1:500), anti-glutamine synthetase (Abcam, Ab16802; 1:500), anti-STAT3 (Cell Signaling, 9139; 1:1500), anti-p-STAT3 (Y705) (Cell Signaling, 9145; 1:100), anti-GFP (Abcam, Ab6658; 1:750) and anti-citrate synthase (Cell Signaling, 14309; 1:100). Cells were rinsed four times with PBS with 0.01% Triton X-100 and incubated for 1 h with 1:500 fluorescent-conjugated secondary antibodies (Thermo Fisher) and 2.8 µM DAPI diluted in 1% BSA, 2% normal donkey serum and/or 2% normal goat serum and 0.2% Triton X-100 in PBS. Cells were rinsed twice with PBS with 0.01% Triton X-100 and twice with PBS before imaging. For p-STAT3 and total STAT3 immunolabelling, astrocytes were fixed as described but permeabilized with pre-chilled 100% methanol at –20 °C for 10 min according to manufacturer’s instructions. Methanol was aspirated and cells were rinsed with PBS and then blocked and immunolabelled as described above.
Colocalization of mtHyPer7 with the mitochondrial enzyme citrate synthase was estimated using linear regression of intensities across a 40 µm line region of interest obtained using the Plot Profile function in Fiji software (v.2.3).
Immunohistochemistry
Mice were anaesthetized with Avertin (2,2,2-tribromoethanol, 400–600 mg kg−1 body weight) and transcardially perfused for 2.5 min at 3 ml 0.9% saline per min before hemibrains were removed and stored in fixative (4% paraformaldehyde in PBS) overnight at 4 °C on a rocking platform. Hemibrains were subsequently incubated in cryoprotectant (30% sucrose in PBS) for at least 48 h before cryosectioning.
Mouse brain tissue was sectioned (30-μm-thick sections) using a SM2010 R sliding microtome (Leica) equipped with a BFS-3MP freezing stage and cooling unit (Physitemp). Free-floating sections were collected into cryopreservative (30% ethylene glycol and 30% glycerol in PBS) for long-term storage at –20 °C.
Double or triple immunolabelling of free-floating mouse sections was performed with minor modifications depending on the antibodies used. All steps were performed at ambient temperature unless specified. Cryopreserved sections were thoroughly rinsed in PBS, permeabilized for 1 h in PBS containing 0.5% Triton X-100 (PBS-T), blocked with 10% donkey and/or goat serum in PBS-T for 1–2 h, incubated in primary antibodies in 3% serum in PBS-T for up to 48 h at 4 °C: anti-phospho-tau (ser202, thr205) (clone AT8) (Thermo Fisher, MN1020; 1:150 dilution), anti-GFAP (Millipore-Sigma, G9269; 1:1,000 dilution), anti-ASC (Adipogen, AG-25B-0006; 1:400 dilution) and anti-CD11b (Bio-Rad, MCA711G; 1:500 dilution). Sections were rinsed with PBS-T and protected from light in all subsequent steps. Tissue was incubated with 1:500 diluted fluorescent-conjugated secondary antibodies (Thermo Fisher) and 4.7 µM DAPI in 3% serum in PBS-T for 2 h rinsed with PBS-T, mounted and dried on Superfrost glass slides (Electron Microscopy Sciences) before sealing beneath no. 1.5 coverglass (Corning) with Prolong Diamond Antifade Mounting Medium (Thermo Fisher). Slides were allowed to set overnight before acquiring images.
For phospho-STAT3 immunolabelling, the Alexa Fluor 488 Tyramide SuperBoost kit (Thermo B40922) was used according to manufacturer protocol with minor modifications. In brief, cryopreserved sections were thoroughly rinsed in PBS before being permeabilized in ice-cold 100% methanol for 10 min at –20 °C. Endogenous peroxidases were blocked for 60 min with 3% H2O2 and non-specific antigens were blocked for 90 min with blocking buffer provided in the kit. Sections were incubated in anti-phospho-STAT3 (Cell Signaling 9145S; 1:500 dilution) and anti-GFAP (Sigma MAB3402B; 1:1,000 dilution) antibodies with 10% serum in PBS overnight at 4 °C. Sections were rinsed in PBS, then co-incubated with poly-HRP-conjugated secondary antibody provided in the kit, Alexa Fluor555 (Thermo Fisher) and 4.7 µM DAPI for 60 min at room temperature. Sections were rinsed and incubated according to vendor recommendations with a solution of tyramide, H2O2, and reaction buffer for 10 min at room temperature before stop reagent was added. Sections were washed in PBS, coverslipped and dried as described above.
Microscopy and image analyses
Fixed-cell or tissue imaging
Fixed and immunolabelled cultures were evaluated for phospho-tau or cell-type-specific markers using procedures outlined previously28. In brief, plates were imaged using a ×10 objective on an ImageXpress MICRO Confocal Automated High-Content Analysis System (Molecular Devices) at the Weill Cornell Medicine Automated Optical Microscopy Core Facility. For counts of neuronal cell loss, four or nine images were acquired around the centre of each well and analysed with the ‘Neurite Outgrowth’ and ‘Multi Wavelength Cell Scoring’ modules of MetaXpress software (Molecular Devices) to determine the number of NeuN-positive cells and total MAP2-positive neuronal process length in each image. NeuN immunolabelling was used as the nuclear-seed of MAP2-positive outgrowth.
For characterization of astrocyte cultures, fixed and labelled cells were manually counted as doubly positive for DAPI and astrocytic markers (glutamine synthase or SOX9) or microglial marker (Iba1) using a ×20 objective on a BX-X710 microscope (Keyence).
To evaluate the intensity of protein expression in labelled mouse brain sections, slides were imaged on a BX-X710 microscope (Keyence) with a ×10 or ×20 objective (Nikon) using the tiling function. Images were stitched with BZ-X Analyzer Software (Keyence) and Fiji software (v.2.3) was used for background subtraction and quantification of intensity and area of regions of interest, as previously described28.
To measure the thickness of hippocampal pyramidal cell layer in the cornu ammonis (CA1) and granule cell layer of the dentate gyrus (DG), the length of lines crossing each layer was measured in Fiji using ×20 images. The average of ten lines for each region was obtained from two sections per animal.
Live-cell mitochondrial H2O2 imaging
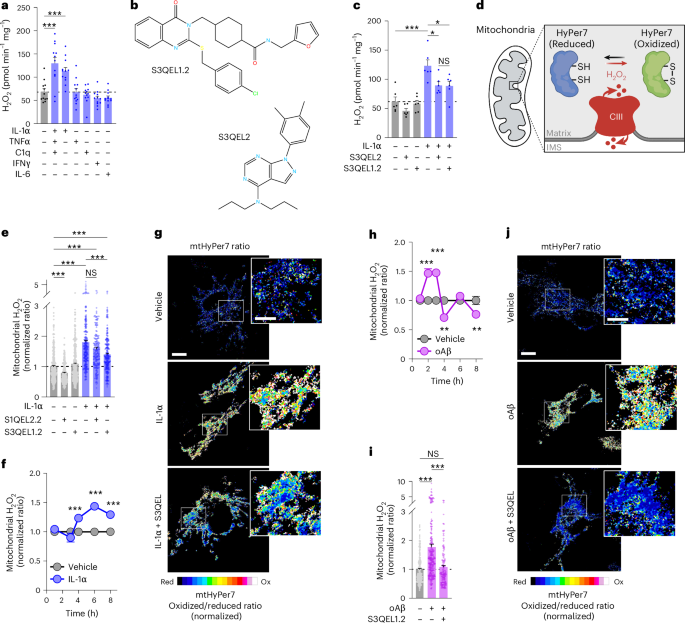
Astrocytes were cultured on 96-well glass-bottom microplates (Greiner) or ten-chamber glass-bottom cell culture slides (Greiner) pre-coated with sterile-filtered 100 µg ml−1 poly-D-lysine, as described in ‘Primary astrocyte cultures’. Confluent astrocytes were transfected with 10 ng of pAAV-GfaABC1D-mtHyPer7 using Lipofectamine3000 (Thermo Fisher) according to manufacturer instructions, rinsed with PBS after 5 h, and switched to imaging medium consisting of phenol red-free DMEM powder (Millipore-Sigma) supplemented with 20% heat-inactivated FBS, 1× GlutaMAX, 1 mM sodium pyruvate, 25 mM glucose and 44 mM sodium bicarbonate, pH 7.7, at ambient temperature and CO2 levels. The following day, astrocytes were stimulated for 0–8 h with cytokines, oligomeric Aβ, antimycin A, or vehicle controls without or with S3QEL or other pharmacological co-treatments. Cells expressing mtHyPer7 were imaged inside an environmental chamber at 37 °C and 5% ambient CO2 with a ×20 objective on a Zeiss LSM 880 confocal laser scanning microscope with spectral GaAsP detector or a Leica Stellaris 8 Confocal. Reduced and oxidized mtHyPer7 was detected by collecting 499–598 nm emission from sequential excitation with the 405 nm or 488 nm laser lines, respectively. Images from each channel were background-subtracted and fluorescence intensities within hand-drawn regions of interest encompassing entire individual astrocytes were determined for each wavelength using Fiji (v.2.3). mtHyPer7 oxidized-to-reduced ratios were calculated for each cell, outliers were removed via robust regression and outlier removal (ROUT) analysis115 (GraphPad Prism) and ratios were normalized to vehicle within each experimental biological replicate. Representative oxidized-to-reduced ratio images were generated using the Calculator Plus-Divide function in Fiji and presented using the 16 colours LUT.
H2O2 efflux assay
Rates of H2O2 efflux were determined indirectly by HRP-coupled oxidation of Amplex UltraRed (Thermo Fisher), according to established protocols29. In brief, astrocytes were cultured on black-walled, clear-bottom 96-well plates (Corning Costar) pre-coated with poly-D-lysine, as described in ‘Primary astrocyte cultures’. Astrocytes were treated with cytokines, S3QELs or other modulators in culture medium for 6–24 h, rinsed once with Krebs-Ringer Buffer (135 mM NaCl, 5 mM KCl, 1 mM MgSO4, 0.4 mM K2HPO4 and 20 mM HEPES, pH 7.4) containing 25 mM glucose, 1x GlutaMAX, 1 mM sodium pyruvate and 0.1% w/v BSA (Sigma) prewarmed to 37 °C, and then equilibrated in fresh prewarmed buffer for 30 min at 37 °C and ambient atmosphere in a temperature-controlled BioTek Synergy H1 plate reader (Agilent). After equilibration, buffer was aspirated and replaced with H2O2 detection solution consisting of complete buffer with 25 μM AmplexRed, 25 U ml−1 superoxide dismutase and 5 U ml−1 horseradish peroxidase. Fluorescence (530 nm excitation and 560 nm emission) was measured on a plate reader every 90 s for 45 min. Rates of H2O2 production were calibrated in parallel with each assay in cell-free control wells using H2O2 standard curves prepared in the detection solution. Following H2O2 measurements, medium was aspirated, cells were washed once with DPBS, and then lysed for 10 min with 30 µl of RIPA buffer containing 10 mM Tris, pH 7.5, 150 mM NaCl, 0.5% deoxycholate, 0.5% Triton X-100, 1× Complete Protease Inhibitor Cocktail (Millipore-Sigma) and 1% each of Phosphatase Inhibitor Cocktails 2 and 3 (Millipore-Sigma). Then, 10 µl of lysate was transferred to a clear 96-well plate (Corning) and mixed with 350 µl of detergent-compatible Bradford reagent (Pierce) before measurement of absorbance at 595 nm on a BioTek Synergy H1 plate reader (Agilent). BSA standards were included in parallel blank wells.
Cellular metabolism assays
Total ATP levels were measured using CellTiter-Glo 2.0 (Promega). Astrocytes were cultured in 96-well plates in standard medium, as described in ‘Primary astrocyte cultures’. The day before ATP measurements, growth medium was replaced with glucose-free DMEM (Millipore-Sigma) containing 20% heat-inactivated FBS, 1× GlutaMAX, 1 mM sodium pyruvate and 10 mM galactose to enforce reliance on mitochondrial oxidative phosphorylation for cellular ATP production116. After 24 h, medium was removed and astrocytes were treated for 10 or 30 min with indicated concentrations of S3QEL2, S3QEL1.2, S1QEL2.2, antimycin A or myxothiazol in galactose-containing medium. At the indicated end points, 100 μl of medium was removed from each well and replaced with 100 μl prewarmed CellTiter-Glo 2.0 reagent. Plates were mixed for 3 min on a benchtop shaker (VWR), then incubated without shaking for an additional 10 min at ambient temperature. Lysates were triturated to mix and 150 μl of each sample was transferred to a white 96-well plate (Costar) for luminescence measurement on a BioTek Synergy H1 plate reader (Agilent).
Oxygen consumption rates were measured on a Seahorse XFe96 analyzer (Agilent) according to manufacturer directions and as described previously117. In brief, primary astrocytes were plated on a 96-well Seahorse culture plate pre-coated with poly-D-lysine, as described in ‘Primary astrocyte cultures’. Before the assay, cells were incubated for 45 min with Seahorse XF Base Medium (Agilent), pH 7.4, supplemented with 20% FBS, 1 mM sodium pyruvate, 25 mM glucose and 2 mM glutamine (or 1× GlutaMAX). Seahorse sensor cartridges (Agilent) were hydrated overnight in molecular biology grade water (Corning) and then calibrated in calibrant medium (Agilent) for at least 1 h before loading into the analyser.
Compounds were added directly to wells just before the assay or, where indicated, cytokines, S3QEL or other modulators were loaded into the injection ports of pre-equilibrated sensor cartridges. To evaluate AOX function in transgenic astrocytes, myxothiazol, FCCP and rotenone were injected sequentially following baseline respiration measurements. Oxygen consumption rates were determined using the Seahorse Wave software. Rates for individual wells were normalized to total protein using the detergent-compatible Bradford assay described in ‘H2O2 efflux assay’.
Mitochondrial membrane potential
Tetramethylrhodamine methyl ester (TMRM) was used to assess the mitochondrial membrane potential. Astrocytes were cultured in 96-well glass-bottom microplates that were pre-coated with sterile-filtered 100 µg ml−1 poly-D-lysine, as described in ‘Primary astrocyte cultures’. Cells were switched to imaging medium consisting of phenol red-free DMEM powder (Millipore-Sigma) supplemented with 20% heat-inactivated FBS, 1× GlutaMAX, 1 mM sodium pyruvate, 25 mM glucose and 44 mM sodium bicarbonate, pH of 7.7 at ambient temperature and CO2 levels. Before imaging, 5 nM TMRM was pre-equilibrated for 1 h before treatments except for time-courses lasting longer than 1 h. In these cases, TMRM was equilibrated during the final hour of treatment. The mitochondrial uncoupler BAM15 was used to depolarize ΔΨm and normalize assay measurements. Cells were imaged in an environmental chamber at 37 °C and 5% ambient CO2 with a ×20 objective on a Zeiss LSM 880 confocal laser scanning microscope with spectral GaAsP detector or a Leica Stellaris 8 Confocal. TMRM was excited at 548 nm and emission collected between 553–700 nm. Images were thresholded to a common value for each experiment to eliminate background (typically the average non-specific fluorescence within nuclear regions) and average fluorescence intensity of each image was determined using Fiji (v.2.3).
Polar targeted metabolomics
Astrocytes were cultured in 10-cm plates that were pre-coated with sterile-filtered 100 µg ml−1 poly-D-lysine, as described in ‘Primary astrocyte cultures’. Astrocytes were then treated for 6 h with vehicle, IL-1α, IL-1α and TPCA-1, or IL-1α and S3QEL1.2 (n = 4 replicates per condition). Following treatment, polar metabolites were extracted on dry ice using pre-chilled 80% methanol (–80 °C). The extract was dried with a Speedvac, and redissolved in HPLC grade water before it was applied to the hydrophilic interaction chromatography LC–MS. Metabolites were measured on a Q Exactive Orbitrap mass spectrometer (Thermo Scientific), which was coupled to a Vanquish UPLC system (Thermo Scientific) via an Ion Max ion source with a HESI II probe (Thermo Scientific). A Sequant ZIC-pHILIC column (2.1 mm × 150 mm i.d., particle size of 5 µm, Millipore-Sigma) was used for separation of metabolites. A 2.1 × 20 mm guard column with the same packing material was used for protection of the analytical column. Flow rate was set at 150 μl min−1. Buffers consisted of 100% acetonitrile for mobile phase A and 0.1% NH4OH/20 mM CH3COONH4 in water for mobile phase B. The chromatographic gradient ran from 85% to 30% A in 20 min followed by a wash with 30% A and re-equilibration at 85% A. The Q Exactive was operated in full scan, polarity-switching mode with the following parameters: the spray voltage 3.0 kV, the heated capillary temperature 300 °C, the HESI probe temperature 350 °C, the sheath gas flow 40 units, the auxiliary gas flow 15 units. MS data acquisition was performed in the m/z range of 70–1,000, with 70,000 resolution (at 200 m/z). The AGC target was 1e6 and the maximum injection time was 250 ms. The MS data were processed using XCalibur (v.4.1) (Thermo Scientific) to obtain the metabolite signal intensities. Identification required exact mass (within 5 ppm) and standard retention times. Signal intensities were normalized to the total protein levels for each sample, uploaded to MetaboAnalyst (v.6.0), median normalized and log transformed, and analysed by unpaired t-tests. Corrected P values were determined within MetaboAnalyst using the Benjamini–Hochberg false discovery rate calculation to adjust for multiple testing.
Metabolomic Pathway Analysis and cys-redox proteomic integration
For Metabolomic Pathway Analysis, metabolites significantly changed in the IL-1α + S3QEL versus IL-1α condition were added to the Pathway Analysis module on MetaboAnalyst after correction for multiple comparisons. Metabolites found to be increased or decreased by S3QEL were analysed separately to inform pathway direction. A reference metabolome was uploaded for comparison, and the parameters included the Fisher’s exact test for enrichment and relative between-ness centrality for topology. The KEGG library from Mus musculus was used and pathways were reported if the corrected P value was <0.05. For integration of metabolomic and cys-redox proteomic data, the Joint Pathway Analysis module was used on MetaboAnalyst. As input from the cys-redox proteomic data, cysteines oxidized >10% by IL-1α and reduced >5% by S3QEL co-treatment were included. Metabolites from the IL-1α + S3QEL versus IL-1α comparison were included if the P value was <0.05 following correction for multiple comparisons. The KEGG pathway library from Mus musculus was used and all pathways (integrated) was chosen for analysis. Fisher’s exact test was used for enrichment and degree centrality for topology measurement. Queries were combined for integration. Pathways were sorted by P value and plotted.
Western blotting
Cultured cells were rinsed with ice-cold PBS before lysis with ice-cold RIPA buffer containing 10 mM Tris, pH 7.5, 150 mM NaCl, 5 mM EDTA, 0.5% deoxycholate, 0.5% Triton X-100, 1× Complete Protease Inhibitor Cocktail (Millipore-Sigma) and 1% each of Phosphatase Inhibitor Cocktails 2 and 3 (Millipore-Sigma). Collected lysates were sonicated on ice with a probe sonifier (Branson) for 5 s at 10% power, centrifuged at 10,000g for 10–15 min at 4 °C, and assayed for protein content using a detergent-compatible Bradford assay (Thermo Fisher).
For brain tissue, cortices were homogenized in 150–200 µl RIPA lysis buffer containing HALT protease inhibitor (Thermo Fisher) in a Fisherbrand Bead Mill 24 (Fisher Scientific) for 40 s at a speed setting of 5 in a pre-chilled adaptor tube rack. Samples were centrifuged at 1,000g for 2 min at 4 °C before sonication, lysate clarification, and protein content determination as described for cell culture lysates.
For all samples, 20 µg RIPA-soluble lysates were resolved on Bis-Tris SDS–PAGE gels (Thermo Fisher) and transferred onto nitrocellulose membranes using a Mini Blot Module (Thermo Fisher). Membranes were blocked with 5% BSA (VWR) or 5% non-fat milk (VWR) in Tris-buffered saline (TBS) before probing overnight at 4 °C with primary antibodies diluted in TBS containing 3% BSA and 0.2% Tween-20 (TBS-tw): anti-p-tau (ser202, thr205) (clone AT8, Thermo Fisher, MN1020; 1:60), anti-GFAP (Millipore-Sigma, G9269; 1:1,000), anti-STAT3 (Cell Signaling, 9139; 1:1,000), anti-p-STAT3 (Y705) (Cell Signaling, 9145; 1:1,000), anti-NF-κB (Cell Signaling, 6956; 1:1,000), anti-p-NF-κB (S536) (Cell Signaling, 3033; 1:1,000), anti-γ-tubulin (Millipore-Sigma, T5326; 1:1,250), anti-β-actin (Millipore-Sigma, A2066; 1:2,000), anti-total oxphos antibody cocktail (Abcam, Ab110413; 1:250) and anti-citrate synthase (Cell Signaling, 14309; 1:1,000). After overnight incubation in primary antibodies, all blots were rinsed with TBS-tw and probed with 1:15,000 IR Dye 680RD donkey anti-mouse and IR Dye 800CW donkey anti-rabbit fluorescent secondary antibodies (LI-COR) in TBS-tw with 3% BSA for 1 h. Blots were rinsed twice with TBS-tw, once with TBS and dried for at least 1 h before scanning on the Odyssey CLx imaging system (LI-COR). Expression levels were quantified using LI-COR Image Studio software.
Stoichiometric cys-redox proteomics
Quantification of the oxidation state of individual cysteine residues throughout the proteome was performed as described for cultured cells41. In brief, astrocytes treated with vehicle, IL-1α or IL-1α and S3QEL1.2 (n = 6 replicates per condition) were collected in ice-cold 20% trichloroacetic acid and lysed at 4 °C with Lysing Matrix SS tubes (MP Biomedicals) on a Fisher Bead Mill 24 at speed 4 for 1.5 min. Lysates were divided into two 300 μg half-samples for reduction and 6C-CPT tagging (for ‘total’ cys measurement) or iodoacetamide-blocking followed by reduction and CPT tagging (for ‘oxidized’ cys measurement). Samples were further processed as originally described except the TMTpro 18-plex (Thermo Fisher) was used for TMT-labelling (Lot XC342531 for TMTpro 16plex and XB338618 for TMTpro-134C and TMTpro-135N). Pooled-sample TMT ratio checks, final LC–MS detection and analyses were performed by the Weill Cornell Medicine Proteomics and Metabolomics Core Facility. Raw files were processed using the MaxQuant computational proteomics platform (v.2.4.2.0) for protein and peptide identification. Fragment spectra were used to search the UniProt mouse protein database (downloaded on 21 September 2017). TMT 18-plex on peptide N-term/lysine, oxidation of methionine, protein N-terminal acetylation and CPT on cysteine were used as variable modifications for database searches. Both peptide and protein identifications were filtered at 1% false discovery rate based on a decoy search using a database with the protein sequences reversed. Cysteine-containing peptides were excluded if the probability of the identified cys position was less than 95% (24 cysteine peptides excluded). Total peptides in each channel were normalized based on the second ratio check of pooled TMT-labelled samples. For each cysteine-containing peptide, the TMT reporter ion intensity from the ‘oxidized’ channel was divided by the TMT reporter ion intensity from the ‘total’ channel to retrieve the % oxidation of each cysteine residue. Cysteine peptides with 0 values in the TMT reporter ion intensity of the ‘total’ channel were removed from analysis (130 cysteine peptides excluded). Cysteine peptides that showed greater than 100% total oxidation were corrected to 100% oxidation (146 cysteine peptides). Then, 8,292 cysteine peptides were included in the final analysis after application of these criteria.
Cys-redox proteomics Gene Ontology enrichment and subcellular localization analysis
Gene Ontology (GO) enrichment analysis was performed using g:Profiler (ve111_eg58_p18_f463989d). For analysis of cysteines ‘changed upon IL-1α stimulation’, the input consisted of all cysteines oxidized or reduced 10% or more following IL-1α stimulation (403 cysteines). For ‘effects of S3QEL on IL-1α-induced oxidation’, the input consisted of cysteines that increased oxidation 10% or more following IL-1α stimulation compared with vehicle and were reduced in oxidation 5% or more by S3QEL co-treatment (155 cysteines). P values were calculated using the cumulative hypergeometric test and corrected using the g:SCS multiple testing correction with a significance threshold of 0.05. GO_BP terms containing 10–1,000 genes were included for analysis to focus on specific categories. The GO_BP annotations are as follows: GO: 0009117 (nucleotide metabolic process), GO: 0006753 (nucleoside phosphate metabolic process), GO: 0006163 (purine nucleotide metabolic process), GO: 0072521 (purine-containing compound metabolic process), GO: 0055086 (nucleobase-containing small molecule metabolic process), GO: 0006740 (NADPH regeneration), GO: 0006739 (NADP metabolic process), GO:0030163 (protein catabolic process), GO:1903047 (mitotic cell cycle process), GO:0051169 (nuclear transport), GO:0006913 (nucleocytoplasmic transport), GO:0009894 (regulation of catabolic process), GO:0000278 (mitotic cell cycle), GO:0042176 (regulation of protein catabolic process), GO:0051129 (negative regulation of cellular component organization), GO:0019941 (modification-dependent protein catabolic process) and GO:0043632 (modification-dependent macromolecule catabolic process).
To determine the subcellular localization of proteins containing oxidized cysteines, experimentally validated protein localization data were downloaded from the Human Protein Atlas. Subcellular localizations from the atlas were then mapped onto proteins that contained cysteines that increased oxidation 10% or more following IL-1α stimulation (183 cysteines). Proteins without assigned locations were excluded from the analysis (49 cysteines). Proteins with one or more subcellular localizations in the following categories were grouped under single locations: ‘nucleus’, annotation for nucleus, nucleoplasm, nucleoli, nuclear bodies, nuclear fibrillar centre, nuclear speckles or nuclear membrane; ‘cytoskeleton’, annotation for cytoskeleton, actin filaments, cytokinetic bridge, microtubules, intermediate filament, centrosome, focal adhesion sites, midbody or cell junctions; and ‘vesicles’, vesicles or cytoplasmic bodies. All other proteins contained localizations that fit into single categories of cytosol, plasma membrane, cytoskeleton, Golgi apparatus, mitochondria, peroxisome or endoplasmic reticulum. The number of proteins assigned to these compartments was summed and plotted.
Retro-orbital injection and immunoprecipitation of ribosome-bound RNA
To confirm Slc8b1 enrichment in astrocytes in vivo, Aldh1l1-Cre mice were briefly anaesthetized with isoflurane (3%, Covetrus) and AAV2/PHP.eB-hGfaABC1D-DIO-Rpl22-HA (1 × 10¹¹ vg) diluted in saline to 100 µl was injected into one retro-orbital sinus. Petrolatum ophthalmic ointment (Puralube Vet Ointment) was applied to the injected eye and vectors were allowed to express for 3 weeks before isolating total RNA and astrocyte-specific ribosome-bound RNA. Mice were killed by cervical dislocation and dissected cortices were thoroughly homogenized using glass Dounce homogenizers (20 times with each pestle and 0.013–0.064 mm final clearance; Kimble Chase) in polysome buffer consisting of 50 mM Tris, pH 7.5, 100 mM KCl, 12 mM MgCl2, 1% Nonidet P-40, 1 mM dithiothreitol (DTT), 200 U ml−1 RNasin (Promega), 1 mg ml−1 heparin, 100 g ml−1 cycloheximide and cOmplete protease inhibitor tablets (Sigma) at 10% wet w/v. Samples were transferred to a fresh RNase-free tube (Eppendorf), centrifuged at 10,000g for 10 min at 4 °C, and 20% of cleared supernatant was frozen at –80 °C until subsequent extraction for total RNA input. The remaining 80% cleared supernatant was transferred to a clean RNase-free tube and incubated with mouse anti-HA antibody (1:250; clone 16B12, BioLegend) on a rotating mixer for 4 h at 4 °C while 300 μl protein G magnetic beads (Dynabeads; Invitrogen) were washed on a magnetic stand (Thermo Fisher) with 500 μl citrate-phosphate buffer consisting of 24 mM citrate and 52 mM phosphate at pH 5.0 followed by three 500 μl washes with immunoprecipitation buffer consisting of 50 mM Tris, pH 7.5, 100 mM KCl, 12 mM MgCl2 and 1% Nonidet P-40. After anti-HA incubation, homogenates were added directly to the washed magnetic beads and allowed to incubate on a rotating mixer overnight at 4 °C after which the beads were placed on a magnetic stand, the supernatant with unbound RNA was aspirated, and Rpl22-HA-coupled beads were washed three times with high-salt buffer containing 50 mM Tris, pH 7.5, 300 mM KCl, 12 mM MgCl2, 1% Nonidet P-40, 1 mM DTT and 100 μg ml−1 cycloheximide. After the final wash, 200 μl RNA lysis buffer consisting of 1% β-mercaptoethanol in RLT Plus (QIAGEN) was added to the beads, vortexed to lyse Rpl22-HA-bound RNA and transferred to a clean RNase-free tube. The extraction was repeated with 150 μl lysis buffer and the combined 350 μl bound RNA fractions processed for RNA extraction using the RNeasy Plus Micro kit (QIAGEN 74034). The total RNA input from the 20% reserved cleared homogenate was thawed on ice and extracted using the RNeasy Mini kit (QIAGEN 74106) with on-column DNase treatment (QIAGEN 79256) according to manufacturer instructions.
RT–qPCR
Total RNA was extracted using the RNeasy Mini kit with on-column DNase treatment. Cultured primary cells were rinsed once with ice-cold PBS and collected in freshly prepared extraction buffer consisting of 1% β-mercaptoethanol in RLT (QIAGEN). Saline-perfused, microdissected mouse brain tissue was frozen on dry ice and stored at –80 °C until RNA extraction. Tissue was homogenized for 20 s in fresh extraction buffer using a Fisher Scientific Bead Mill 24 at a speed setting of 5 in a pre-chilled adaptor tube rack.
Microfluidic quantitative PCR with reverse transcription (RT–qPCR) was performed as previously described28. In brief, complementary DNA was synthesized with Protoscript First Strand Synthesis kit (NEB), treated with RNase H (NEB), and pre-amplified for 14 cycles against a pool of primers (Supplementary Table 4) using PreAmp Grandmaster mix (TATAA Biocenter) before exonuclease I treatment (NEB). Pre-amplified cDNA was diluted at least fivefold with nuclease-free water and mixed with SsoFast EvaGreen with Low ROX (Bio-Rad) and chip-specific DNA Sample Reagents before loading into primed Flex Six or 96.96 Dynamic Array chips (Standard Biotools). Individual primers were mixed with DNA assay reagent (Standard Biotools) and loaded into chip inlets. Chips were primed and loaded using an IFC Controller HX (Standard Biotools) before measuring and analysing amplification and melting curves on a BioMark HD System (Standard Biotools). Cycle of quantification (Cq) values were thresholded equally for all inlets across each chip run and normalized to the average of reference genes (Actb and Gapdh for tissue samples; Actb and/or Tbp and/or Gusb for cultured cells) before determining ddCq and fold change relative to experimental control groups. Corrected P values were calculated based on the Benjamini–Hochberg method to adjust for multiple testing.
For targeted analysis of specific genes, RT–qPCR was performed on cDNA using PowerUp Sybr Green Master Mix (Thermo Fisher) and a CFX96 Touch Real-Time PCR Detection System (Bio-Rad). All qPCR primer sequences are detailed in Supplementary Table 4.
RNA sequencing
RNA was extracted and cDNA synthesized as described for qPCR. cDNA was submitted to the Weill Cornell Genomics Resources Core Facility for quality control analysis and bulk RNA sequencing (n = 3–6 biological replicates per condition). The libraries were sequenced with paired-end 50 bp on a NovaSeq6000 sequencer. The raw sequencing reads in BCL format were processed through bcl2fastq (v.2.20) (Illumina) for FASTQ conversion and demultiplexing. The adaptors were trimmed with cutadapt (v.1.18) (https://cutadapt.readthedocs.io/en/v1.18/), RNA reads were aligned and mapped to the GRCm39 mouse reference genome by STAR (v.2.5.2) (https://github.com/alexdobin/STAR)118 and transcriptome reconstruction was performed by Cufflinks (v.2.1.1) (http://cole-trapnell-lab.github.io/cufflinks/). The abundance of transcripts was measured with Cufflinks in fragments per kilobase of exon model per million mapped reads (FPKM)119. Raw read counts per gene were extracted using HTSeq-count (v.0.11.2)120. Gene expression profiles were constructed for differential expression, cluster and principle- component analyses with the DESeq2 package (https://bioconductor.org/packages/release/bioc/html/DESeq2.html)121. For differential expression analysis, pairwise comparisons between two or more groups were made using parametric tests where read counts follow a negative binomial distribution with a gene-specific dispersion parameter. Corrected P values were calculated based on the Benjamini–Hochberg method to adjust for multiple testing. Corrected P values of 0 were corrected to the minimum calculated non-zero value.
Gene network analyses
QIAGEN Ingenuity Pathway Analysis (IPA) was used to identify gene networks that regulate, and are regulated by, CIII ROS. DEGs were imported into IPA with log2 fold change values and corrected P values to identify the involved pathways. For comparisons with greater than 5,000 DEGs, the top 5,000 were used as IPA input. A Fisher’s exact test was used to calculate the P value of the overlap of our dataset with those genes of a reference set known to be regulated by particular upstream factors, with a statistical significance level P < 0.05. z-scores were also calculated, with positive and negative scores indicating activation and inhibition of an upstream regulator, respectively.
Statistical analyses
No statistical methods were used to pre-determine sample sizes but our sample sizes were determined based on our preliminary data and previously published studies3,16,26,28. Animals and cell-culture wells were randomly assigned to the various treatment groups whenever feasible. Experimenters were blinded to the genotypes and treatment groups for in vivo data collection (RT–qPCR, brain processing, immunohistochemistry, image collection and processing). Experimenters were unblinded during cell culture experiments to ensure that the treatments of various cell-culture wells and plates could be carried out. Statistical specifications are reported in the figures, corresponding figure legends and Supplementary Table 6. Data are presented as mean ± s.e.m. All statistical tests were performed using GraphPad Prism 10, except Fisher’s exact test used in QIAGEN IPA and MetaboAnalyst, and the cumulative hypergeometric test used in g:Profiler. The criterion for data point exclusion was established during the design of the study and was set to values above or below 2 × s.d. from the group mean or, in the case of cell culture studies and experiments like mtHyPer7 imaging with quantification of individual cells, removed by robust regression and outlier removal (ROUT) analysis115. A two-sided Student’s t-test was used to determine statistical significance between two groups. Differences among multiple groups were assessed by one-way analysis of variance (ANOVA) followed by Tukey’s or Dunnett’s multiple comparisons post hoc tests or by two-way ANOVA or mixed model analysis followed by Bonferroni’s test, as specified in the legends. mtHyPer7 measurements were not normally distributed according to the Kolmogorov–Smirnov test and were analysed using non-parametric tests. A Mann–Whitney unpaired two-tailed U-test and the Kruskal–Wallis with Dunn’s test were used to assess differences between two or more groups, respectively. A pairwise Mantel–Cox test was used for lifespan analysis. Null hypotheses were rejected at P < 0.05.
Resource availability
Further information and requests for resources and reagents should be directed to the lead contact, A.L.O. ([email protected]).
Materials availability
Plasmids generated in this study are available from the lead contact but may require a completed materials transfer agreement and coverage of any shipping charges.
Reporting summary
Further information on research design is available in the Nature Portfolio Reporting Summary linked to this article.
First Appeared on
Source link

