Single-cell spatial transcriptomic analysis of human skin anatomy
A single-cell spatial MERFISH atlas of normal human skin
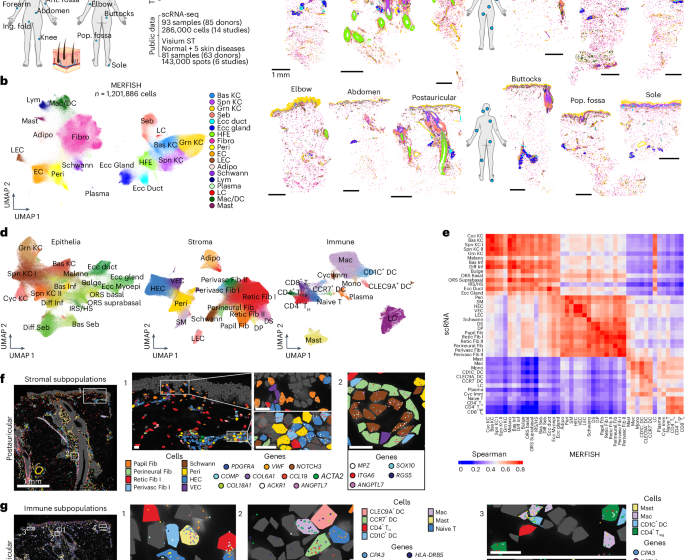
To map the cellular and spatial diversity of human skin within and across anatomic sites, we profiled clinically and histologically normal skin (NS) from 22 donors (10 males, 12 females; age = 25–83 years) across 15 anatomic sites (Supplementary Table 1). Up to 12 matched sites per donor were collected during autopsies with a postmortem interval (PMI) of <24 h (n = 99 samples, n = 9 donors), along with live tissue from surgically discarded panniculectomy (n = 6 samples, n = 6 donors) and tumor-free Mohs reconstruction tissue (n = 9 samples, n = 7 donors) to include facial sites. To resolve the >40 skin cell types defined by scRNA-seq studies, MERFISH balances high transcript sensitivity that can be negatively impacted in capture-based spatial sequencing methods17 with the multiplexing capacity necessary to distinguish subpopulations and interrogate cell–cell communication. Therefore, we designed two custom 500-gene MERFISH panels (434 overlapping genes) comprising approximately equal parts of cell-type markers and ligand–receptor (L–R) pairs (Methods; Extended Data Fig. 1a and Supplementary Table 2).
Using an optimized protocol, we generated MERFISH data from 114 samples, detecting 105,046,537 transcripts (Fig. 1a; Methods). Attesting to high sample preparation consistency, adjacent tissue sections were highly concordant in transcript detection (Spearman ρ = 0.98; Extended Data Fig. 1b), as was overlapping gene expression across panels (ρ = 0.86; Extended Data Fig. 1c). MERFISH RNA counts correlated with GTEx bulk RNA-seq (ρ = 0.77–0.81; Extended Data Fig. 1d), confirming accuracy. Unexpectedly, DV200 was not a good predictor of MERFISH data quality (Extended Data Fig. 1e), whereas autopsy PMI modestly correlated with reduced transcript detection (ρ = −0.29; Extended Data Fig. 1f), likely from RNA degradation. After segmentation and filtering, we recovered 1,201,886 cells with an average of 63 ± 78 transcripts and 27 ± 20 genes per cell (mean ± s.d.), comparable to previous MERFISH studies (Extended Data Fig. 1g,h; Methods)18,19. Most transcript density variation was attributable to gene panel and donor (Extended Data Fig. 1i).
a, Overview of the study. b, UMAP of integrated MERFISH data from 114 human skin samples labeled by broad cell types. c, Single-cell spatial localization of cell types labeled in b from 12 anatomic sites from a single donor (D165) profiled with MERFISH. Scale bars, 1 mm. d, UMAP of epithelial, stromal and immune subpopulations identified by MERFISH and labeled by cell type. e, Pairwise Spearman correlations of overlapping gene expression in MERFISH and scRNA-seq cell types. f,g, Spatial localization of stromal (f) and immune (g) subpopulations in D165 postauricular sample, where each dot represents a transcript. Scale bars for all zoom-in panels, 25 μm. Adipo, adipocyte; Bas, basal; Cyc, cycling; DC, dendritic cell; Diff, differentiated; DP, dermal papilla; DS, dermal sheath; Ecc, eccrine; Fib, fibroblast; HFE, hair follicle epithelia; HS, hair shaft; Imm, immune; Inf, infindibulum; IRS, inner root sheath; LC, Langerhans cell; LEC, lymphatic endothelial cell; Lym, lymphocyte; Mac, macrophage; Melano, melanocyte; ORS, outer root sheath; Papil, papillary; Peri, pericyte; Perivasc, perivascular; Retic, reticular; Seb, sebaceous; SM, smooth muscle; Spn, spinous; TC, cytotoxic T cell; TH, T helper cell; Treg, regulatory T cell; Ant. fossa, antecubital fossa; Pop. fossa, popliteal fossa; Cen. scalp, central scalp; Occ. scalp, occipital scalp; Ing. fold, inguinal fold; postauric, postauricular; UMAP, Uniform Manifold Approximation and Projection.
Integration of the full MERFISH dataset revealed 18 major cell populations with distinct spatial localizations and accurate canonical marker expression (Fig. 1b,c and Extended Data Fig. 2a,b; Methods). Batch effects from collection source, donor or gene panel were minimal (Extended Data Fig. 2c). To validate MERFISH cell-type annotations, we integrated NS scRNA-seq from 84 donors across 14 previously published studies (n = 285,887 cells; Extended Data Fig. 2d–f and Supplementary Table 3; Methods)10,12,14,15,20,21,22,23,24,25,26,27,28,29,30. MERFISH recapitulated scRNA-seq cell types, while additionally capturing dissociation-sensitive adipocytes and sebocytes31 (Extended Data Fig. 2g). Despite lower transcript and gene counts in autopsy samples (Extended Data Fig. 1h), all cell types remained detectable, suggesting minimal impact on clustering and annotation (Extended Data Fig. 2h). Together, these data represent an organ-wide single-cell spatial transcriptomic atlas of adult human skin.
MERFISH localizes 45 cellular subpopulations in human skin
We then resolved major epithelial, stromal and immune subpopulations (Fig. 1d). Within epithelium, MERFISH distinguished five interfollicular epidermis (IFE) keratinocyte (KC) states—basal, spinous I, spinous II, cycling and granular—expressing expected markers and localized appropriately (Extended Data Fig. 3a–c). Additional epithelial states included infundibular basal/differentiated KCs; bulge, outer root sheath/inner root sheath populations; basal/differentiated sebocytes; eccrine duct, gland and myoepithelial cells; and melanocytes (Fig. 1d). Their canonical markers matched analogous scRNA-seq clusters and spatially localized to expected tissue areas (Extended Data Fig. 3a–c)17.
Notably, we observed two spinous KC clusters, Spn KC I and Spn KC II. Spn KC II was most prominent in the scalp and sole and displayed an elevated infundibular-like (S100A8, SOX9, GJB2 and GJB6) gene expression profile similar to previously described S100A8+ scalp KCs26 and SOX9+ palmoplantar KCs15 (Extended Data Fig. 3b–g and Supplementary Tables 4 and 5). To directly compare these, we assessed whether scalp and sole KCs were transcriptionally distinct in our integrated scRNA-seq reference. Basal and spinous KCs from both sites clustered together and segregated clearly from infundibulum clusters, which were enriched in scalp (Extended Data Fig. 3d–g). Sole KCs showed higher GJB2, GJB6 and SOX9 expression, whereas scalp KCs expressed more S100A8 (Extended Data Fig. 3h), but the lack of donor-matched datasets complicates distinguishing site-specific expression from donor-specific expression. Neither scRNA-seq nor MERFISH resolved discrete scalp-specific or sole-specific IFE KC subsets; thus, we hypothesize that Spn KC II represents a shared, specialized spinous population across these sites.
We then characterized 15 stromal subpopulations, including fibroblasts, pericytes, endothelial cells (ECs), adipocytes and Schwann cells (Fig. 1d,f and Extended Data Fig. 4a). We identified eight fibroblast subpopulations—papillary (Papil Fib), two reticular (Retic Fib I and Retic Fib II), two perivascular (Perivasc Fib I and Perivasc Fib II), perineural, dermal papilla (DP)-like and dermal sheath (DS) subsets (Fig. 1f and Extended Data Fig. 4a–c). MERFISH localized all fibroblast groups, including previously described CCL19+ Perivasc Fib I fibroblasts near vasculature19. Notably, ANGPTL7 marked two populations—perineural fibroblasts (ANGPTL7+/ITGA6+/KLF5+) that colocalized with Schwann cells; and Retic Fib II (ANGPTL7+/PRG4+/COMP+) previously observed in palmoplantar skin22, which localized diffusely throughout the sole dermis (Extended Data Fig. 4c–e). Our perineural fibroblasts also confirmed previously identified fibroblast subpopulation coexpressing ANGPTL7, ITGA6, KLF5 and EGFR (Extended Data Fig. 4e and Supplementary Tables 4 and 5)10,15. The two APOE+/CXCL12+/C3+ perivascular populations were distinguished by CCL19 expression in Perivasc Fib I, which were enriched near superficial blood vessels and resembled recently named ‘F3’ fibroblastic reticular cell-like CCL19+/HLA-DRA+/CD74+ fibroblasts32. In contrast, Perivasc Fib II cells were more enriched around deeper vessels. DP-like cells occupied the epithelial-adjacent regions of the upper hair follicle, while DS cells lined the hair follicles (Fig. 1d,f and Extended Data Fig. 4c). ECs clustered into lymphatic (LECs, TFPI+/CCL21+) and two vascular EC (VEC) subsets distinguished by ACKR1 expression resembling a high endothelial venule-like EC (HEC; Fig. 1d and Extended Data Fig. 4a)33.
Finally, we identified 13 immune cell types, including DC subtypes (CD1C+, CLEC9A+ and CCR7+), Langerhans cells, monocytes, macrophages, mast cells, plasma cells, cycling immune cells and T cell subsets (naive, CD4+ TH, CD4+ Treg and CD8+ T cells; Fig. 1d,e,g), consistent with scRNA-seq profiles (Extended Data Fig. 4f and Supplementary Tables 4 and 5). While Langerhans cells localized in the IFE and hair follicle epithelia (Fig. 1g and Extended Data Fig. 3c), most other immune cells localized to perivascular regions, except for macrophages, which were additionally scattered throughout the dermis (Fig. 1g). Expression profiles of all 41 overlapping subpopulations identified between MERFISH and scRNA-seq correlated well, as scRNA-seq did not capture sebocytes, adipocytes or eccrine myoepithelial cells (Fig. 1e).
Collectively, MERFISH identified and localized 45 unique cell populations in adult skin at a comparable granularity to scRNA-seq, yielding a high-resolution single-cell spatial atlas of human skin (Supplementary Video 1).
Stereotypic cellular distribution patterns across anatomic sites
To explore functional specialization across body sites, we quantified cellular diversity (Shannon index, a proxy for specialization) and density (cells per 100 µm2). Hair-dense regions, such as the scalp, face and postauricular sites, showed the highest diversity, while extensor sites, such as the elbow and knee, featured the lowest (Fig. 2a,b). While higher diversity at face and scalp may reflect an increase in hair follicle-associated populations, the sole also exhibited high diversity despite being hairless. Furthermore, flexural sites, such as the antecubital and popliteal fossae, were more diverse than neighboring extensor regions despite similar regional coordinates along the extremities. Finally, centrally located body sites (buttocks, abdomen and back) were low in diversity, suggesting diversity increases centrifugally from central to peripheral sites. Similarly, density broadly correlated with diversity, suggesting a centrifugal density axis across the body plan (Fig. 2a,b).
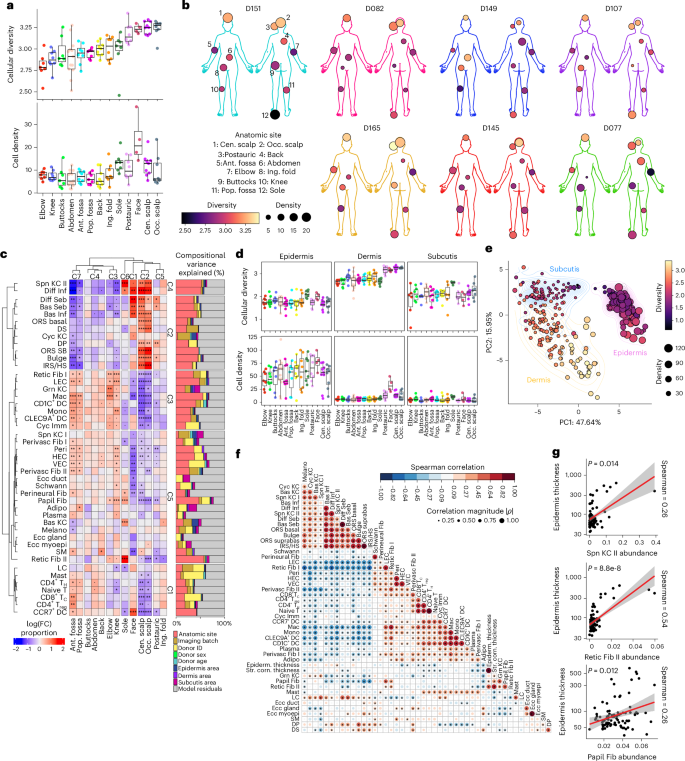
a, Box plots of cellular diversity (Shannon index) and density (cells per 100 μm2) at each anatomic site, ranked from low to high diversity. Box plots are defined as median ± Q1 (bottom bound) or Q3 (upper bound), with whiskers extending to the smallest (bottom) or largest (top) value no further than 1.5× IQR from the lower (Q1) or upper (Q3) hinge representing the IQR (Q3 − Q1). b, Body maps depicting diversity and density for seven donors with 12 anatomic sites profiled. c, Left: clustered heatmap of cellular abundances across anatomic sites. Right: bar plots of variance portioning showing contributions of each metadata to the variance in data. Padj < 0.1; *Padj < 0.05; **Padj < 0.01; ***Padj < 0.001; two-sided moderated t test; Benjamini–Hochberg correction for multiple comparisons. d, Box plots of cellular diversity (Shannon diversity index) and density (cells per 100 μm2) at each anatomic site by tissue compartment, ranked from lowest to highest overall diversity, as in a. Box plots are defined as in a. e, PCA of tissue compartment density and diversity. Analyses from a, c, d and e are from n = 109 samples from n = 19 donors. f, Spearman correlations of cell-type proportion and epidermal/stratum corneum thickness. *P < 0.05; two-sided (n = 89 samples from 7 donors with 12 sites profiled). g, Scatterplots and Spearman correlations of epidermal thickness with Spn KC II, Retic Fib II and Papil Fib abundances. Each point is a tissue sample (n = 89 samples from n = 7 donors with 12 sites profiled). IQR, interquartile range; adj, adjusted.
We then assessed underlying cell-type abundance differences driving diversity across sites with a mixed linear model framework (Methods)34,35,36. Remarkably, anatomic sites exhibited similar compositional patterns within flexural (antecubital and popliteal fossae), extensor (elbow and knee), trunk (back, abdomen and buttocks) or scalp (central and occipital scalp) sites, while face and sole were unique (Fig. 2c), highlighting robust cell abundance patterns across donors. Uniform Manifold Approximation and Projection visualization of cell-type abundances recapitulated these groupings across body categories and density–diversity (Extended Data Fig. 5a–c) and demonstrated donor-level consistency (Extended Data Fig. 5d). High-diversity sites such as the face and scalp featured a wider variance in cell-type abundances, while low-diversity buttocks, abdomen and back exhibited minimal enrichment or depletion of any cell type (Fig. 2c). Variance partitioning of demographic and technical covariates confirmed that the cell-type abundances largely varied by anatomic site, while quantifying other sources of variance (Fig. 2c). Collectively, these data suggest distinct but highly stereotypic cell compositions across sites.
Cell types driving anatomic site differences included, expectedly, Spn KC II (scalp and sole enrichment), Retic Fib II (sole) and hair follicle-associated and sebaceous gland-associated subpopulations (face, scalp and postauricular; Fig. 2c and Extended Data Fig. 3c). Interestingly, innate immune cells such as monocytes, macrophages and DC subsets appeared strongly enriched in the extremities, with similar trends for vasculature-associated cell types such as VECs, HECs, pericytes and Perivasc Fib I/Perivasc Fib II subpopulations, in addition to LECs and Retic Fib I (Fig. 2c). However, T cell subsets were distinctly enriched in antecubital fossa and to a lesser extent the popliteal fossa, divergent from elbow and knee patterns (Fig. 2c). In contrast, epidermal and eccrine gland populations were remarkably stable across sites. Together, these analyses reveal how distinct stable and dynamic cell types form unique coalitions across the skin anatomy.
To assess intratissue heterogeneity, we manually assigned each cell to its classical histological compartment of the epidermis, dermis and subcutis by cross-referencing matched histology (hematoxylin and eosin; Extended Data Fig. 5e). The dermis was most diverse, largely matching overall tissue diversity patterns, followed by the subcutis and epidermis (Fig. 2d). Interestingly, despite high overall diversity in the sole, its dermis was among the least diverse (Fig. 2a). Instead, sole diversity was driven by the epidermis and subcutis, suggesting that site differences can be driven by distinct compartments. In terms of compartment density, the epidermis was highest overall, with the face exhibiting highest epidermal and dermal densities (Fig. 2d). Using principal component analysis (PCA) of population abundance for each compartment, we found that samples clustered primarily by compartment, with density and diversity explaining most PC1 and PC2 variance, respectively (Fig. 2e). Thus, the skin possesses several means to achieve functional specialization, including diversification of distinct compartments.
Pairwise correlations of cell-type proportions reproduced known compartment groupings such as the IFE, pilosebaceous unit and eccrine gland (Fig. 2f). To extend these patterns to tissue properties, we quantified the average epidermal and stratum corneum thicknesses in adjacent histology sections from the seven donors for whom we profiled 12 anatomic sites (n = 89 tissues; Extended Data Fig. 5f). Because the sole is thickest, sole-enriched Spn KC II and Retic Fib II were expectedly correlated with both thickness measurements (Fig. 2f,g). However, papillary fibroblasts were the only other cell type that significantly correlated with both (Fig. 2f,g) and were most abundant in the sole, elbow and knee (Fig. 2c)—sites typically exposed to increased mechanical stress. Given the known signaling between Papil Fib and epidermal KCs and recent evidence that sole fibroblasts can thicken nonsole skin6, our findings suggest that papillary fibroblasts from additional body sites may also potentially facilitate skin thickening.
Defining multicellular neighborhoods in human skin
Given stereotypic cell compositions across sites, we then examined cell-type proximity. Proximity enrichment analysis identified clusters of cell types that mirrored proportion-based correlations (Fig. 2f and Extended Data Fig. 6a). For example, Schwann cells tightly colocalized with perineural fibroblasts, and hair follicle bulge, outer root sheath basal/suprabasal and inner root sheath/HS cells formed cohesive groups, as expected. Orthogonally, spatial clustering with CellCharter37 identified a maximally stable solution of ten multicellular neighborhoods present across all samples (Fig. 3a,b and Extended Data Fig. 6b,c; Methods). These neighborhoods corresponded to the dermal-epidermal junction (N0—DEJ), superficial and follicle-adjacent perivascular regions (N1—PERIVASC I), differentiated IFE (N2—DIFF IFE), deep perivascular regions (N3—PERIVASC II), reticular dermis (N4—STROMA), upper and lower hair follicle (N5—UPPER HF and N9—LOWER HF), eccrine and sebaceous glands (N6—ECCRINE and N7—SEB GLAND) and subcutis (N8—SUBCUTIS; Fig. 3b and Supplementary Video 2). Although k = 10 was the most stable clustering solution, CellCharter results can depend on the length scale of nearest neighbors and gene panel defining cell subpopulations. Alternative solutions (for example, k = 3 or 9) produced biologically interpretable neighborhoods that were hierarchically related to one another (Extended Data Fig. 6c,d), but we selected k = 10 as the level that best captured biologically meaningful granularity in our data.
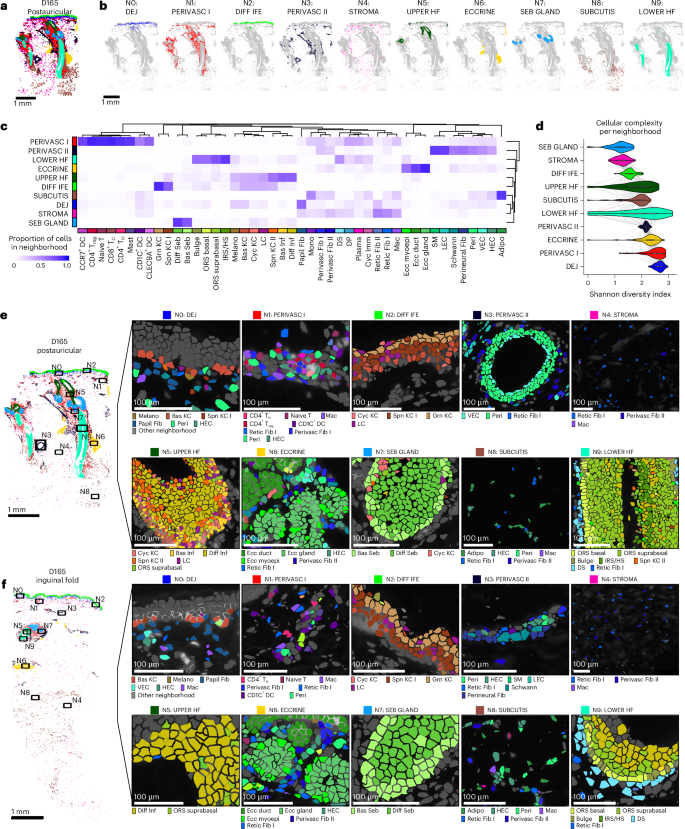
a, D165 postauricular sample labeled by ten multicellular neighborhoods. b, Spatial highlights of cells labeled by each neighborhood from a. c, Clustered heatmap of cell-type proportions across neighborhoods. Each column sums to 1. d, Violin plots of Shannon diversity indices in each neighborhood (n = 114 samples each). Box plots inside each violin are defined as in Fig. 2a. e, D165 postauricular neighborhood zoom-ins for cell-type constituents of each neighborhood. Cell types are colored by same colors as in c. f, Same as e, but for D165 inguinal fold sample.
Distinct cell types exhibited strong neighborhood preferences (Fig. 3c–e). As expected, epidermal, hair follicle and sebaceous/eccrine gland populations were enriched in their corresponding neighborhoods. Interestingly, most immune cells, including DC subsets, T cells and mast cells, were concentrated in the PERIVASC I neighborhood, alongside Perivasc Fib I/Perivasc Fib II and vasculature-associated cells, forming an organization reminiscent of SALT38,39,40, analogous to mucosa-associated lymphoid tissue in other barrier tissues such as the oral cavity (tonsils) or small intestine (Peyer’s patches). PERIVASC II, conversely, was relatively immune-poor and comprised primarily vasculature-related cells and lymphatic ECs. Neighborhoods varied in their cellular diversity, from low (SEB GLAND and STROMA) to high (PERIVASC I and DEJ; Fig. 3f). Collectively, these findings delineate recurrent multicellular neighborhoods that define the microanatomy of human skin across body sites.
Neighborhood abundances also varied across sites and reflected major body axes, with scalp/postauricular/face sites, extremities and trunk forming distinct clusters, while sole remained unique (Fig. 4a,b). The three pilosebaceous neighborhoods (UPPER HF, SEB GLAND and LOWER HF) were enriched in the scalp, while STROMA, DEJ, DIFF IFE and PERIVASC II were enriched in elbow and knee. In contrast, PERIVASC I and SUBCUTIS varied minimally across sites (Fig. 4b). Interestingly, the UPPER HF neighborhood was also enriched in sole, consistent with the transcriptional similarity of sole-enriched Spn KC II cells with differentiated infindibulum cells. Given shared expression of the hair follicle master regulator SOX9 across these populations in our data and prior studies22 (Extended Data Fig. 3a–c), SOX9 or other hair follicle regulators in sole KCs may contribute to the sole’s increased thickness and unique ability to withstand mechanical stress.
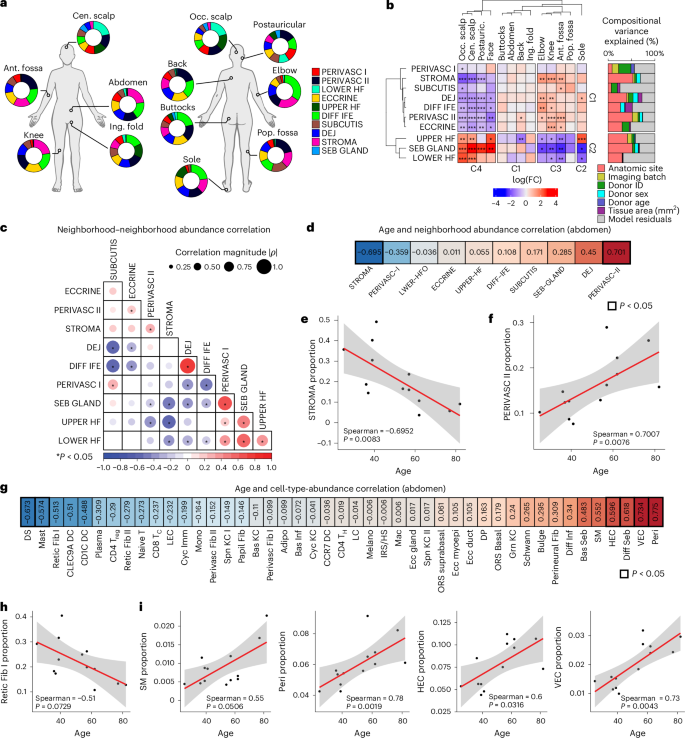
a, Donut plots of neighborhood proportions at each site across n = 7 donors with 12 anatomic sites each. b, Right: bar plots of variance portioning showing contributions of each metadata to the variance in data. Left: clustered heatmap of neighborhood abundances across anatomic sites. Padj < 0.1; *Padj < 0.05; **Padj < 0.01; ***Padj < 0.001; moderated t test, two-sided; Benjamini–Hochberg correction for multiple comparisons. c, Clustered pairwise neighborhood abundance Spearman correlations across 13 abdomen samples (n = 13 donors). Dot size corresponds with correlation magnitude |Spearman ρ|. d, Ranked Spearman correlation coefficients (r) of neighborhood abundance with age from abdomen samples (n = 13 samples from n = 13 donors). e, Scatterplot of STROMA neighborhood proportion and age from n = 13 donors. Red line indicates linear model fit; gray area indicates 95% confidence interval. P values are associated with the two-sided Spearman correlation. f, Same as e, but for PERIVASC II proportion and age. g, Ranked Spearman correlation coefficients (r) and associated two-sided P value of cell-type abundance with age from abdomen samples (n = 13 samples from n = 13 donors). h, Scatterplot of Retic Fib I proportion and age from n = 13 donors. Red line indicates linear model fit; gray area indicates 95% confidence interval. i, Same as h, but for additional cell-type proportion and age—SM, Peri, HEC and VEC. Red line indicates linear model fit; gray area indicates 95% confidence interval. All P values for Spearman correlations are calculated as two-sided.
As neighborhoods are contiguous and can interact across boundaries, we evaluated cross-neighborhood coherence and potential neighborhood–neighborhood interactions by calculating pairwise correlations of neighborhood abundances across all samples. DEJ and DIFF IFE were strongly correlated (ρ = 0.74), consistent with their coordinated role in driving epidermal thickness, and STROMA correlated with PERIVASC II (ρ = 0.26; Fig. 4c). Meanwhile, SEB GLAND correlated with UPPER HF, LOWER HF and PERIVASC I. In contrast, ECCRINE exhibited low correlation with other neighborhoods except PERIVASC II, suggesting more independent or skin-extrinsic regulation.
Finally, our dataset enabled assessment of age-associated changes in neighborhood and cell-type abundance. To avoid anatomic site confounding, we restricted this analysis to abdomen samples (n = 13 donors). Age was associated with decreased STROMA (Spearman = −0.70) and increased PERIVASC II (Spearman = 0.70) abundance (Fig. 4d), indicating a shift from STROMA toward PERIVASC II-dominant tissue composition. Correspondingly, Retic Fib I—the major STROMA constituent—declined with age, whereas HEC, VEC, pericytes and smooth muscle cells, which define PERIVASC II, increased (Fig. 4e). Our data suggest that Retic Fib I loss may underlie the known observation of collagen production decrease with age41. While prior studies have shown reduction in gene expression by fibroblast subsets with age in the inguinal fold12, here we observe a numerical reduction in Retic Fib I in abdominal skin. In sum, we identified ten multicellular neighborhoods that define the cellular spatial organization in skin, including an immune-enriched PERIVASC I, cross-neighborhood relationships and their dynamism across anatomic sites and during aging.
Neighborhoods define distinct spatial communication networks
We then mapped L–R interactions within each MERFISH neighborhood using CellChat (Supplementary Table 6), focusing on PERIVASC I, given its high diversity and immune enrichment (Fig. 3c,d and Supplementary Table 6). Within PERIVASC I, the most interactive cell types were VECs, CD4+ cytotoxic T cells, CD8+ cytotoxic T cells and Perivasc Fib I/Perivasc Fib II (Fig. 5a). To extend beyond MERFISH panel genes and mitigate data sparsity, we simulated neighborhoods using our integrated scRNA-seq reference and repeated CellChat L–R inference (Extended Data Fig. 7a and Supplementary Table 7; Methods). This approach revealed MIF, midkine (MK), CXCL/CCL chemokines and TNF as top PERIVASC I pathways (Fig. 5b) and PERIVASC I and ECCRINE as having the highest interaction volume (Extended Data Fig. 7a,b). PERIVASC I also exhibited the greatest number of unique pathways, reflecting extensive heterotypic immune–stromal signaling (Extended Data Fig. 7c). Top stromal-to-immune L–R pairs in PERIVASC I included CXCL12–CXCR4, MDK–CD74, MIF–CD74 and PTN–NCL (Fig. 5c). Conversely, immune-to-stromal interactions involved PPIA-BSG, NAMPT-ITGA5 + ITGB1 and TNF–TNFRSF1A (Fig. 5d). Scoring MERFISH panel PERIVASC I L–R pairs, such as CXCL12–CXCR4, between anchoring cell types and their nearest neighbors confirmed perivascular coexpression (Fig. 5e; Methods).
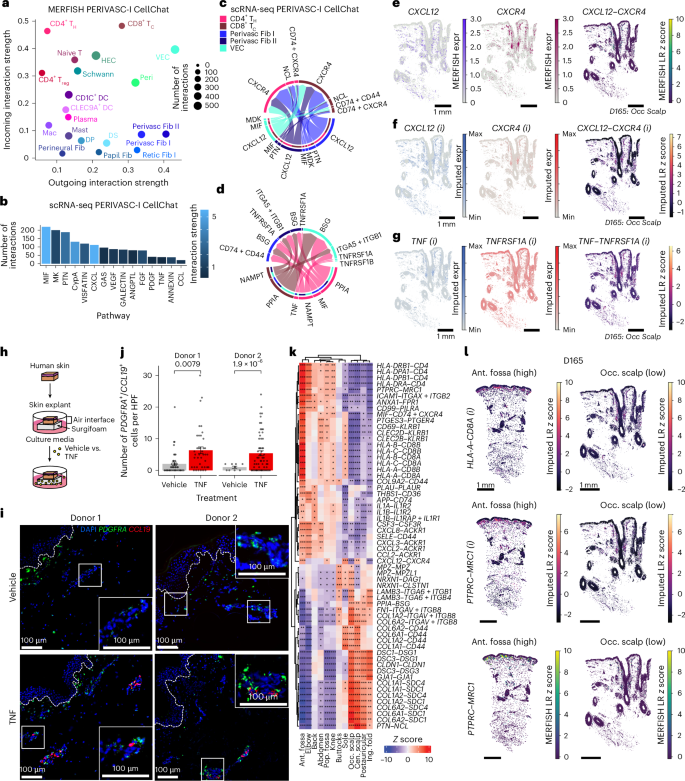
a, Scatterplot of incoming and outgoing interaction strengths per cell type in PERIVASC I neighborhood predicted by CellChat on MERFISH data. b, Highest predicted active pathways in PERIVASC I neighborhood from scRNA-seq data. c, Circos plot of top stromal-to-immune L–R communication pairs in scRNA-seq of cell types in PERIVASC I neighborhood. d, Circos plot of top immune-to-stromal L–R communication pairs in scRNA-seq of cell types in PERIVASC I neighborhood. e, CXCL12 and CXCR4 expression in MERFISH data, and L–R score from D165 occipital scalp (Methods). f, Imputed (i) CXCL12 and CXCR4 expression, and imputed L–R score from D165 occipital scalp (Methods). g, Imputed (i) TNF and TNFRSF1A expression, and imputed L–R score from D165 occipital scalp. h, Schematic of human skin explant workflow. i, Representative RNA FISH images of CCL19 (red), PDGFRA (green) and DAPI (blue) from human skin explant sections treated with vehicle control or recombinant TNF (10 ng ml−1) with zoom-in insets of perivascular areas. Dashed white line indicates basement membrane of epidermis. j, Quantification of the number of PDGFRA+/CCL19+ cells per HPF. Data are mean ± s.e.m. P values shown were calculated by two-tailed t test. k, Heatmap of top L–R scores at each site in the PERIVASC I neighborhood. *Padj < 0.05; **Padj < 0.01; ***Padj < 0.001; two-sided moderated t test; Benjamini–Hochberg correction for multiple comparisons. l, Imputed (i) L–R scores from D165. Nonimputed MERFISH L–R scores are also shown for PTPRC–MRC1 (a pair included in the MERFISH panel). HPF, high-powered field.
We then leveraged Tangram42 imputation to visualize spatial expression of L–R pairs predicted by scRNA-seq but absent from our MERFISH panel (Extended Data Fig. 8a; Methods). Imputed values correlated with ground truth MERFISH expression for major cell-type lineages and L–R pairs included in our MERFISH panel (Fig. 5e,f and Extended Data Fig. 8b). This enabled visualization of additional interactions, such as TNF–TNFRSF1A, which showed high PERIVASC I, DEJ and SUBCUTIS scores consistent with scRNA-seq (Fig. 5g and Extended Data Figs. 7c and 8c). TNF signaling was particularly intriguing given its pleotropic roles across homeostasis and disease and its ability to upregulate CCL19 in cultured synovial or skin fibroblasts28,43,44. To functionally validate homeostatic TNF signaling in perivascular fibroblasts, we cultured human skin explants from two independent donors in the presence of recombinant TNF or vehicle control (Fig. 5h; Methods). Explants maintained normal histology with minimal apoptosis (Extended Data Fig. 9a,b). RNA FISH of Perivasc Fib I markers PDGFRA and CCL19 on explant tissue sections demonstrated that TNF treatment increased PDGFRA+/CCL19+ cell numbers by approximately fourfold in superficial perivascular regions (P < 0.001; Fig. 5i,j), restoring or exceeding their numbers in fresh skin (Extended Data Fig. 9c,d). Consistent with this, qPCR confirmed a similar approximately fourfold increase in CCL19 expression in TNF-treated explants (P = 0.028; Extended Data Fig. 9e). Notably, PDGFRA+ papillary fibroblasts identified by RNA FISH did not express CCL19 even after TNF treatment (Extended Data Fig. 9c). Therefore, TNF signaling can maintain CCL19+ Perivasc Fib I identity in the PERIVASC I neighborhood.
Finally, imputation further enabled analysis of molecular variation across sites. Differential L–R scoring identified top PERIVASC I interactions at each location (Fig. 5k and Supplementary Table 8; Methods). In the antecubital fossa, elevated MHC class I (HLA-A/HLA-B/HLA-C/HLA-E) and II (HLA-DRA/HLA-DMA/HLA-DQA1) expression colocalized with CD8/CD4, alongside upregulated chemokine (CXCL2/CXCL3/CXCL8/CXCL12, CCL2) and MIF–CD74 + CD44 coexpression, potentially enhancing T cell retention and recruitment (Fig. 5k,l and Supplementary Tables 8 and 9). At the DEJ, colocalized extracellular matrix (ECM) components and cognate receptors (COL1A1/COL1A2, COL6A1/COL6A2, COMP) were consistently elevated in sole, knee and elbow in both MERFISH and imputed data, suggesting a molecular basis for increased epidermal thickness (Extended Data Fig. 8d–h and Supplementary Tables 8 and 9). Together, MERFISH directly resolved top cell–cell interactions within our panel, while imputation expanded transcriptome-wide analyses, revealing site-specific molecular programs that may underlie anatomical variation, including enhanced immune presence at flexural sites.
Skin neighborhood remodeling in disease
To determine how microanatomic neighborhood dynamics change in disease, we curated publicly available 10x Visium datasets from NS (n = 44) and five skin diseases—atopic dermatitis (AD; n = 7), psoriasis (PP; n = 4), hidradenitis suppurativa (HS; n = 10), basal cell carcinoma (BCC; n = 8) and squamous cell carcinoma (SCC; n = 8), comprising 81 samples across 63 donors (Fig. 6a,b and Supplementary Table 10; Methods)14,17,20,22,28,45,46. We identified 20 spot clusters spatially and transcriptionally corresponding to epithelial, immune and stromal compartments (Extended Data Fig. 10a,b). We then mapped these clusters to the ten MERFISH-defined NS neighborhoods and observed strong correspondence across epithelial, stromal, adnexal and perivascular domains (Extended Data Fig. 10a,b and Supplementary Table 11; Methods). Neighborhood signature scoring and cell2location47 deconvolution further supported these annotations (Fig. 6c–e and Extended Data Fig. 10c,d; Methods). Together, these analyses show that Visium data recapitulate MERFISH-defined homeostatic neighborhoods, enabling interrogation of disease-associated changes.
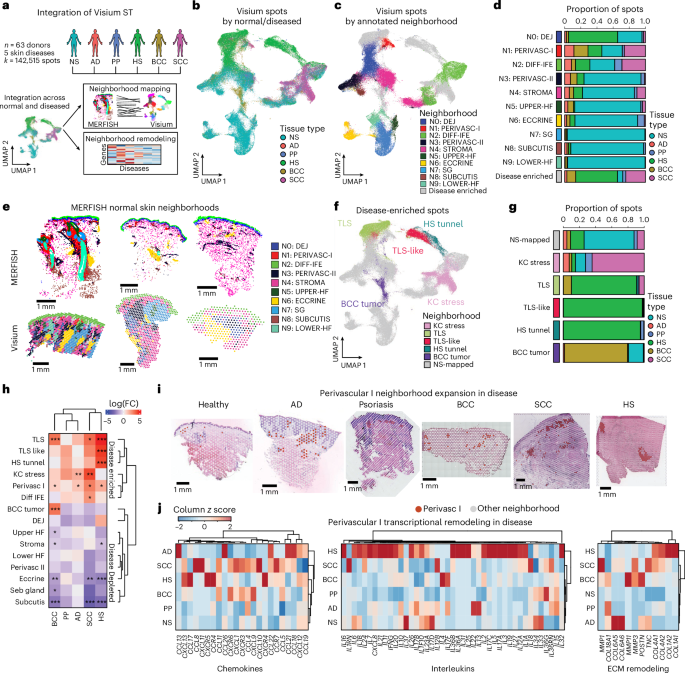
a, Workflow for Visium data integration and downstream analysis encompassing neighborhood mapping and neighborhood transcriptional remodeling. b, UMAP of integrated Visium spots across all samples labeled by normal and diseased tissue state (n = 142,515 spots). c, Same UMAP as b, labeled by the annotated MERFISH neighborhoods they resemble the most. d, Bar plots of tissue state proportions comprising each mapped MERFISH neighborhood. e, Spatial plots of neighborhoods in representative samples of each tissue state. f, Same UMAP as b and c, labeled by annotated disease-enriched neighborhoods. g, Bar plots of tissue state proportions comprising each disease-enriched neighborhood. h, Heatmap of Visium neighborhood abundances of diseased tissues relative to NS. *Padj < 0.05; **Padj < 0.01; ***Padj < 0.001; two-sided moderated t test; Benjamini–Hochberg correction for multiple comparisons. i, Perivascular I neighborhood cluster highlight across representative samples of each tissue state. j, Heatmap of chemokine (left), interleukin (middle) and ECM remodeling (right) gene expression in Perivascular I spots across tissue states.
We annotated four disease-enriched clusters (C1, C3, C4, C15; Extended Data Fig. 10a,e). C1 represented a ‘KC stress’ neighborhood, with KRT6A/KRT6B/KRT6C and S100A8/S100A9 upregulation (Extended Data Fig. 10f and Supplementary Table 11), and was expanded across SCC, AD epidermis, BCC nontumor areas, indicating a pervasive KC stress response. C4 (DIFF IFE) and C15 (PERIVASC I) both mapped strongly to NS neighborhoods but showed disease-associated expansion. C4 increased in SCC, HS and AD, and was enriched in keratinization genes, consistent with inflammation-driven differentiation (Supplementary Table 11). C15 was expanded in SCC, BCC, HS and AD, and had elevated T cell, perivascular fibroblast and chemokine expression (Extended Data Fig. 10g). C3, enriched in SCC, BCC, HS and AD, had strong plasma cell marker and chemokine expression and corresponded to histologic tertiary lymphoid structures (TLS; Extended Data Fig. 10h). Among disease-specific clusters, C13 and C19 were restricted to BCC tumor areas (Extended Data Fig. 10f,i and Supplementary Table 11). C8, C14 and C0 favored HS (Extended Data Fig. 10e); C14 corresponded with epithelial tunnels, a hallmark of advanced HS (Extended Data Fig. 10f,j). C8 expressed weaker TLS-like signatures and localized near tunnels (Extended Data Fig. 10j,k); and C0 (DEJ and STROMA) was expanded in HS, suggesting stromal contributions to tunnel formation. Together, these annotations define both shared and disease-specific programs (Fig. 6f,g) and spatially compartmentalized pathologic responses.
Among all Visium-annotated neighborhoods, PERIVASC I (C15) was the most broadly expanded neighborhood in disease (Fig. 6h,i), resembling inducible SALT (iSALT), first defined by perivascular aggregates of DCs and T cells in contact hypersensitivity mouse models48,49. Biologically relevant processes within this neighborhood revealed disease-associated increases in chemokines, cytokines and ECM factors, highlighting a key spatial domain for immune recruitment and activity (Fig. 6j). Collectively, these analyses suggest that skin disease is associated with both expansion and transcriptional remodeling of homeostatic neighborhoods, with the PERIVASC I neighborhood acting as an immunomodulatory spatial domain. Focused efforts to modulate perivascular cellular dynamics could therefore improve therapeutic targeting.
First Appeared on
Source link

