Structures of Marburgvirus glycoprotein and its complex with NPC1 receptor
Cell lines and plasmids
HEK293T and Huh7 cells (American Type Culture Collection (ATCC)) were maintained in Dulbecco’s modified eagle medium supplemented with 10% fetal bovine serum, 2 mM L-glutamine, 100 U ml−1 penicillin and 100 µg ml−1 streptomycin. HUVEC cells (ATCC) were cultured in vascular cell basal medium supplemented with the Endothelial Cell Growth Kit-BBE (ATCC), 100 U ml−1 penicillin and 100 µg ml−1 streptomycin. THP-1 cells (ATCC) were cultured in RPMI-1640 medium supplemented with 10% fetal bovine serum, 0.05 mM 2-mercaptoethanol (Gibco), 100 U ml−1 penicillin and 100 µg ml−1 streptomycin. To induce macrophage-like differentiation, THP-1 cells were treated with 30 nM phorbol 12-myristate 13-acetate (PMA; Sigma-Aldrich) for 24 h, followed by a 24-h incubation in PMA-free medium31. Expi293F cells (Thermo Fisher) were grown in Expi293 Expression Medium (Thermo Fisher). ss320 Escherichia coli (Lucigen) and TG1 E. coli (Lucigen) were cultured in 2YT medium. HEK293T, Huh7 and THP-1 cells were authenticated by the vendors using short tandem repeat (STR) profiling. Authentication documentation for Expi293F and HUVEC cells was not available on the vendors’ websites. HEK293T cells were tested for mycoplasma contamination in our laboratory and by the vendor and were negative in both cases. Huh7, HUVEC, THP-1 and Expi293F cells were tested and confirmed negative for mycoplasma by the vendors. No commonly misidentified cell lines were used.
Genes encoding RAVV GP (GenBank: ACD13005.1), Musoke MARV GP (NCBI Reference Sequence: YP_001531156.1), Angola MARV GP (GenBank: APQ46224.1), EBOV GP (NCBI RefSeq protein: NP_066246.1) and human NPC1 (UniProt: O15118) were synthesized (GenScript). For full-length GP pseudovirus production, GP genes were cloned into the pcDNA3.1(+) vector with or without a C-terminal C9 tag (the tag-free version was defined as wild type), as previously described32. For GP-ΔM pseudovirus production, the RAVV GP-ΔM gene (residues 1–636, lacking residues 257–425 corresponding to the MLD) was cloned into pcDNA3.1(+) with a C-terminal C9 tag. For protein expression, the RAVV GP-ΔM gene (residues 1–636, lacking residues 257–425 and containing a K589I mutation to stabilize GP2) and the EBOV GP-ΔM gene (residues 1–632, lacking residues 313–463 corresponding to the MLD) were each fused to a C-terminal foldon trimerization motif and His6 tag, and cloned into the Lenti-CMV vector, as previously described25,33. The human NPC1-C gene (residues 374–620, wild type or containing introduced mutations) was fused to a C-terminal His6 tag, and the gene encoding Nanosota-MB1 was fused to a C-terminal human IgG1 Fc tag (GenBank: AEV43323.1); both were cloned into the Lenti-CMV vector, as previously described25,32.
Preparation of GP and NPC1
RAVV GP-ΔM and human NPC1-C proteins were expressed and purified as previously described19,25,32. Plasmids (500 μg) encoding GP-ΔM or NPC1-C were transiently transfected into 500 ml Expi293F cells using 1.5 ml polyethylenimine (Polysciences). Three days post-transfection, supernatants were collected, and proteins were purified on a Ni-NTA column (Cytiva) with an imidazole gradient in PBS. Further purification was performed by size-exclusion chromatography: GP-ΔM on a Superose 6 column (Cytiva) and NPC1-C on a Superdex 200 column (Cytiva), both in buffer containing 20 mM Tris (pH 7.4) and 200 mM NaCl. Purified proteins were flash-frozen in liquid nitrogen and stored at –80 °C. To generate RAVV GPcl, 3 mg of RAVV GP-ΔM was treated with 60 μg of trypsin (Sigma-Aldrich) for 1 h, followed by purification on a Superose 200 column (Cytiva). To generate EBOV GPcl, 3 mg of EBOV GP-ΔM was treated overnight with 15 μg of thermolysin L (Sigma-Aldrich)25, followed by purification on a Superose 200 column (Cytiva).
Preparation of nanobodies
RAVV GP-targeting nanobodies were generated as previously described25,34,35. An alpaca was immunized subcutaneously with RAVV GP-ΔM at 2-week intervals for a total of seven immunizations (Turkey Creek Biotechnology; animal protocol 18-03, in accordance with institutional and national guidelines for the care and use of research animals). Following immunization, blood was collected, and peripheral blood mononuclear cells were isolated (Vanderbilt Antibody and Protein Resource Core). A cDNA library was constructed from peripheral blood mononuclear cell RNA using oligo(dT) primers and Superscript IV reverse transcriptase (Thermo Fisher). Nanobody genes were amplified by nested PCR and cloned into a modified pADL22 vector (Antibody Design Labs). Ligation products were electroporated into E. coli TG1 to generate the nanobody phage display library, following the manufacturer’s protocol (Antibody Design Labs).
Screening of the nanobody phage display library was performed as previously described25,34,35. Three rounds of bio-panning were carried out to enrich for nanobodies binding to RAVV GP-ΔM. For each round, 20 μg of purified GP-ΔM was coated onto an immune tube overnight. The tube was blocked with 5% milk, incubated with 500 μl of phages for 1 h, and washed; the retained phages were eluted and used to infect E. coli TG1. Amplified phages were used for subsequent rounds. After the third round, eluted phages were used to infect E. coli ss320, which were plated on 2YT agar. Single colonies were picked, and nanobody expression was induced with 1 mM IPTG. Supernatants were screened by ELISA to identify GP-ΔM-binding nanobodies.
ELISA was performed as previously described25,34,35. In brief, plates were coated with 100 ng of RAVV GP-ΔM overnight and blocked with 2% BSA. Plates were then sequentially incubated with supernatants from E. coli ss320 expressing haemagglutinin (HA)-tagged nanobodies and with horseradish peroxidase-conjugated anti-HA antibody (Sigma-Aldrich). ELISA substrate (Invitrogen) was added, and reactions were stopped with 1 N H2SO4. Absorbance at 450 nm (A450) was measured using a Synergy LX Multi-Mode Reader (BioTek).
His-tagged nanobodies were expressed and purified from the periplasm of E. coli ss320 as previously described25,34,35. Expression was induced with 1 mM IPTG. Cell pellets were collected, resuspended in 15 ml TES buffer (0.2 M Tris, pH 8.0, 0.5 mM EDTA and 0.5 M sucrose) and shaken on ice for 1 h. The suspension was then diluted with 40 ml of one-quarter of TES buffer (each component at one-quarter concentration) and shaken on ice for another hour. Nanobodies in the supernatant were purified sequentially on a Ni-NTA column (Cytiva) followed by a Superdex 200 column (Cytiva).
Fc-tagged nanobodies were expressed and purified from the supernatant of Expi293F cells as previously described25,34,35. Plasmids were transiently transfected into Expi293F cells using polyethylenimine (Polysciences). Three days post-transfection, supernatants were harvested, and nanobodies were purified on a protein A column (Cytiva), followed by further purification on a Superdex 200 column (Cytiva).
SPR
SPR was performed to measure binding affinities between RAVV GP (GP-ΔM or GPcl) and its ligands (NPC1-C or Nanosota-MB1), as well as between EBOV GPcl and NPC1-C, using a Biacore S200 system (Cytiva) as previously described36,37. Recombinant GP was immobilized on a CM5 sensor chip (Cytiva) via chemical crosslinking. NPC1-C (0.156–2.5 μM for RAVV GPcl; 0.625–10 μM for EBOV GPcl), NPC1-C mutants (at various concentrations) or Nanosota-MB1 (0.02–0.32 μM for RAVV GPcl and GP-ΔM) were injected in running buffer containing 50 mM MES (pH 6.0), 150 mM NaCl and 0.05% Tween-20. Binding responses were recorded as response units. Binding data were analysed using Biacore Evaluation Software (Cytiva).
SPR was also used to assess competition between NPC1-C and Nanosota-MB1 for RAVV GPcl binding, as previously described35. RAVV GPcl was immobilized on a CM5 sensor chip, and 1 μM Nanosota-MB1 was first injected to saturate the chip. This was followed by injection of a mixture containing 1 μM Nanosota-MB1 and 10 μM NPC1-C. For the control, running buffer was injected first, followed by 10 μM NPC1-C. Competitive binding was evaluated by comparing the SPR signals from the Nanosota-MB1–NPC1-C mixture with those from NPC1-C alone.
Pseudovirus entry assay
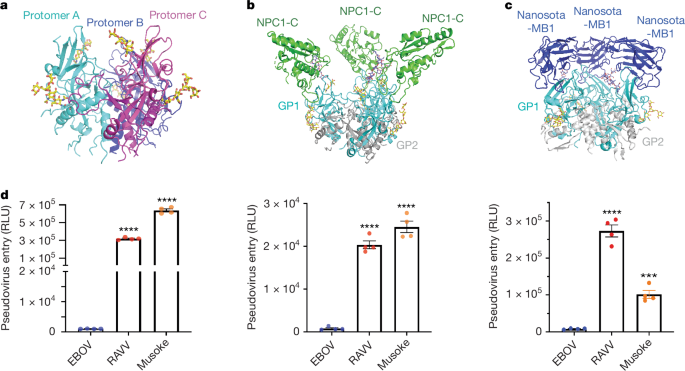
Pseudovirus entry assays were performed to evaluate entry efficiencies of MBV and EBOV pseudoviruses, as previously described25. Pseudoviruses bearing either wild-type or C9-tagged full-length GP were generated by co-transfecting HEK293T cells with a pcDNA3.1(+) plasmid encoding GP, the helper plasmid psPAX2 encoding the HIV backbone and the reporter plasmid plenti-CMV-luc. After 72 h, pseudoviruses were harvested and used to infect Huh7 cells, HUVECs and THP-1-derived macrophages.
For neutralization assays, Fc-tagged Nanosota-MB1 at varying concentrations was mixed with MBV pseudoviruses before infection of Huh7 cells. After 48 h, cells were lysed, transferred to new plates and incubated with luciferase substrate. Relative light units were measured using an EnSpire plate reader (PerkinElmer). The Fc-tag was included to enhance nanobody multivalency for GP interactions and to increase in vivo half-life, while preserving the single-domain structure for antigen binding. The resulting construct remains approximately half the size of IgGs, making it compatible with intranasal administration.
GP expression in pseudoviruses was evaluated by western blot using anti-C9 antibody (Santa Cruz Biotechnology) for C9-tagged GPs, alpaca serum against EBOV GP (wild type or C9 tagged) from our previous study25, and alpaca serum against RAVV and Musoke GPs (wild type or C9 tagged) from the current study.
To investigate entry efficiencies of GP-ΔM and GPcl pseudoviruses, C9-tagged RAVV GP-ΔM was used to generate GP-ΔM pseudoviruses. GP-ΔM pseudoviruses were then treated with trypsin as described for recombinant GP-ΔM protein to generate GPcl pseudoviruses. Both GP-ΔM and GPcl pseudoviruses were subsequently used to infect Huh7 cells.
Cryo-EM
RAVV GPcl (approximately 3.0 mg ml−1), the RAVV GPcl–NPC1-C complex (approximately 2.0 mg ml−1) and the RAVV GP-ΔM–Nanosota-MB1 complex (approximately 3.0 mg ml−1) were used for cryo-EM analysis as previously described38. The cryo-EM buffer consisted of 50 mM MES (pH 6.0) and 150 mM NaCl, matching the buffer conditions used in the SPR experiments. Before grid preparation, 8 mM CHAPSO was added to the samples. A 4 µl aliquot of each sample was applied to freshly glow-discharged Quantifoil R1.2/1.3 300-mesh copper grids (Electron Microscopy Sciences), blotted for 4 s at 22 °C under 100% humidity, and plunge-frozen in liquid ethane using a Vitrobot Mark IV (FEI). Images were acquired at the Hormel Institute, University of Minnesota39, using a K3 Summit detector (Gatan) in super-resolution mode with binning 2 and correlated double sampling, along with a Gatan BioContinuum GIF energy filter (slit width of 20 eV). Data collection was performed with EPU software (Thermo Fisher) at a pixel size of 0.664 Å (nominal magnification of ×130,000) and a nominal defocus range of −1.0 to −2.0 μm. Each image consisted of 40 dose-fractionated frames, recorded with a total electron dose of 50 e− Å−2. Cryo-EM data collection statistics are summarized in Extended Data Table 1.
Cryo-EM data were processed using cryoSPARC (v4.5.1)40, following the workflow outlined in Extended Data Figs. 1–3. All movies were motion corrected using MotionCor2 (ref. 41), and contrast transfer function parameters were estimated with CTFFIND (v4.1.13)42, with data downsampled to three-quarters resolution (0.885333 Å per pixel after downsampling). Images with defocus values outside the range of −0.6 to −3.2 μm or with contrast function transfer fits worse than 7 Å were excluded. Particles were initially selected using the Blob and Template pickers in cryoSPARC (v4.5.1), followed by three rounds of 2D classification to remove junk particles. Good 2D classes were used for ab initio reconstruction of four maps, followed by heterogeneous refinement. After two rounds of 3D classification, particles from high-quality classes were subjected to non-uniform and contrast function transfer refinement, yielding the final maps. Post-processing with CryoFEM43 was performed for the RAVV GPcl–NPC1-C complex to further enhance map density. Map resolutions were determined using gold-standard Fourier shell correlation at 0.143 between the two half-maps. Local resolution estimates were calculated using cryoSPARC (v4.5.1).
Initial model building for the RAVV GPcl, RAVV GPcl–NPC1-C complex and RAVV GP-ΔM–Nanosota-MB1 complex was performed in Coot (v0.8.9)44 using the structure with PDB ID 6BP2 as the starting model. The initial model of Nanosota-MB1 was generated using the Swiss Model online tool (https://swissmodel.expasy.org/). Refinement was performed using Phenix (v1.16)45, with additional manual adjustments in Coot (v0.8.9). Model and map statistics are summarized in Extended Data Table 1. Figures were generated using UCSF ChimeraX (v0.93)46 and the PyMOL Molecular Graphics System (v3.0; Schrödinger)47. The buried interfaces between GP protomers were analysed using PDBePISA (https://www.ebi.ac.uk/pdbe/pisa/). Contact residues at protein–protein interfaces were identified using LigPlot48.
Reporting summary
Further information on research design is available in the Nature Portfolio Reporting Summary linked to this article.
First Appeared on
Source link

