Targeting immunosuppressive myeloid cells via implant-mediated slow release of small molecules to prevent glioblastoma recurrence
The research conducted for this Article complied with all relevant ethical regulations. The experiments were approved by the MGH Institutional Animal Care and Use Committee (IACUC) under protocol no. 2021N000135 and performed according to MGH IACUC regulations and the Human Research Ethics Committee from Geneva University in Switzerland (CCER 2022-02109 and 2023-01928).
Materials
All reagents and solvents were purchased from Thermo Fisher or Sigma-Aldrich and used as received. Small molecules (R848, LCL-161 and ruxolitinib) were purchased from MedChem Express and used as is. Milli-Q water was obtained from a water filtration system.
Synthesis and characterization of the CANDI wafer
Synthesis of CANDI wafer material
The synthesis of the CANDI wafer material was developed from a previously reported method for the synthesis of CANDI nanoparticles28. bsCD (275 mg, 1.0 equiv. to carboxylate) was dissolved in 2-(N-morpholino)ethanesulfonic acid (MES) buffer (3 ml, 50 mM, pH 5) and activated with N-(3-(dimethylamino)propyl)-N′-ethyl carbodiimide hydrochloride (EDC; Thermo Fisher, 1.2 g, 10.0 equiv. to carboxylate) and N-hydroxysuccinimide (NHS; Sigma-Aldrich, 228.5 mg, 5.0 equiv. to carboxylate) for 10 min at 25 °C. A solution containing l-lysine (Sigma-Aldrich, 200 mg, 0.5 equiv. to carboxylate) in MES buffer (0.35 ml) was added rapidly under vigorous stirring, and the reaction was allowed to stir for 24 h at 25 °C. The resulting viscous gel was added dropwise to ice-cold absolute ethanol solution (50 ml), then centrifuged for 5 min at 800 r.c.f. to yield a white precipitate, which was decanted and dissolved in water (6 ml). The opaque and viscous gel was then dialysed for 48 h in water and consecutively lyophilized for 48 h to yield the unloaded wafer material in powder form, which was characterized by dynamic light scattering (2 mg ml−1, 1× PBS) and zeta potential (2 mg ml−1, 0.1× PBS) and stored at −20 °C. An overview of the wafer materials used in the study is provided in Supplementary Table 3.
Small-molecule loading and wafer preparation
R848A (0.04 mg), LCL-161 (0.1 mg) and ruxolitinib (0.08 mg) were dissolved in dimethylsulfoxide (DMSO, 5 µl), and a solution of CANDI wafer material (10 mg) in water (95 µl) was used for payload loading to a final DMSO concentration of 5%. After vigorous vortexing, the resulting small-molecule-loaded CANDI wafer material was lyophilized for 48 h to yield a white powder, which was subsequently pressed into a wafer shape.
Fluorescent labelling of the CANDI wafer
Lyophilized CANDI wafer material (20 mg) was dissolved in water (1 ml), then AF647 succinimidyl ester (Thermo Fisher; 2 mg ml−1 in DMSO) was added. The reaction was incubated for 2 h at 37 °C in a thermocycler (Eppendorf, 550 r.p.m.). The resulting fluorescent wafer material particles were purified by dialysing for 48 h in water, then lyophilized for 48 h before being pressed into the wafer shape.
Drug-release kinetics
The kinetics of drug release were investigated using a closed dialysis system with a 3-kDa-molecular-mass-cutoff membrane (Pur-A-Lyzer Midi Dialysis Kit). CANDI wafers (60 mg) loaded with R848 (0.24 mg), LCL-161 (0.6 mg) and ruxolitinib (0.48 mg) were placed in PBS (1×, 1 ml) and dialysed against PBS (1×, 5 ml) at 23 °C under continuous shaking. The percentage of eluted molecules was quantified by analysing liquid chromatographs at specified time points (t = 0, 0.33, 0.5, 1, 2, 5, 8, 24, 55, 76, 98, 122 and 144 h). For analysis, 90-μl aliquots were injected into a liquid chromatography mass spectrometer, and the system was replenished with an additional 90 μl of PBS after each injection. Each payload (R848, ruxolitinib and LCL-161) was identified by its distinctive retention time (R848 = 0.78 min, ruxolitinib = 0.95 min and LCL-161 = 1.01 min) and mass-to-charge ratio (ES−: R848 = 313, ruxolitinib = 305 and LCL-161 = 499). The cumulative drug release was determined by calculating the ratio of the integrated area under the curve for each eluted peak to the total area under the curve of chromatographs obtained from non-membrane controls. All experiments were conducted in distinct triplicates (N = 3) to ensure the reproducibility and reliability of the results.
CANDI wafer–Gd conjugate
CANDI wafer (100 mg) was dissolved in dichloromethane (DCM, 5 ml) and activated using EDC (60 mg, 386.5 μmol) and NHS (79 mg, 686.3 μmol) overnight. The resulting solution was precipitated using diethyl ether. The activated CANDI was then dissolved in a mixture of DCM (5 ml) and DMSO (3 ml), followed by the addition of Gd-DO3A-butylamine (24 mg, 36 μmol) for 24 h. Subsequently, the conjugated CANDI-Gd was re-precipitated using diethyl ether and subjected to lyophilization. The resulting product was dissolved in acetonitrile (CAN), and unreacted Gd-DO3A-butylamine was removed by filtration using a 3.5-k Amicon filter, followed by lyophilization. MRI with implanted Gd wafers was conducted in triplicates (N = 3 mice).
SEM
The surface morphology of the CANDI wafer was examined by field-emission SEM (FE-SEM; Zeiss Gemini 360). The secondary electron (SE2) detector obtained images with a 10-keV electron beam. Elemental analysis was performed using energy-dispersive X-ray spectroscopy.
Cell models
The primary glioma cell line model for this study was CT-2A, a syngeneic GBM model histologically similar to human glioblastoma52. Cells were obtained from S. Rabkin (CT-2A), X. Breakefield (CT-2A-mCherry-luc) and K. Yang (CT-2A-H2B-mApple). We used CT-2A mCherry-luc cells for pharmacokinetics experiments, MRI experiments, bioluminescence imaging and survival studies. For in vitro maturation (IVM) and histology experiments, we used CT-2A H2B-mApple. In separate control experiments, we determined that all CT-2A subclones had similar growth rates in vitro and in vivo. The second GBM cell line was SB-28, obtained from H. Okada67. In this model, there is invasive GBM into normal brain parenchyma, and immunofluorescence shows a heterogeneous but never abundant T cell infiltration67. Murine CT-2A and SB-28 cells were cultured in DMEM (Corning) containing 4.5 g l−1 glucose and 10% FCS. Cells were detached from plastic with accutase (Sigma-Aldrich).
Immortalized mouse BMDMs (iMACs)68 were acquired from C. L. Evavold and used to assess toxicity (Fig. 3). iMAC cells were plated and grown in DMEM, supplemented with 10% fetal bovine serum (Corning) and 1% penicillin–streptomycin (Corning) at 37 °C. On reaching confluency, cells were split using 0.05% trypsin/0.53 mM ethylene diamine tetraacetic acid (EDTA; Corning), and all in vitro assays were performed after the cells reached 90% confluency. The cell lines were tested mycoplasma-negative.
Human THP-1 cells (TIB-202, ATCC), a cell line isolated from the peripheral blood of an individual with acute monocytic leukaemia, were used for efficacy testing. THP-1 cells were differentiated into macrophages and incubated with different amounts of wafer material.
An overview of the cell lines used in the study is provided in Supplementary Table 4.
Toxicity
Cells were seeded in 96-well plates at a density of 8,000 cells per well and incubated for 24 h at 37 °C and 5% CO2 before use. Cells were incubated with CANDI wafer (50% DMSO in medium was used for the negative control, as well as medium only, without CANDI wafer, for the positive control) for 24 h in a total volume of 100 µl before 10 µl of alamarBlue cell viability reagent (Invitrogen, DAL1025) was added per well. Cells were incubated further for 2 h at 37 °C and 5% CO2, and fluorescence emission was read at a wavelength of 590 nm using an excitation wavelength of 550 nm (both with a bandwidth of 20 nm). The experiment was conducted in triplicates. To assess systemic toxicity, blood was collected from mice 12 days following CANDI treatment. Complete blood counts and clinical chemistry analyses were then performed.
Mouse models
We used various mouse models to study the different aspects of drug delivery, IL-12 induction and therapeutic efficacy. All experiments were approved by the MGH Institutional Animal Care and Use Committee (IACUC) under protocol no. 2021N000135 and performed according to MGH IACUC regulations. The maximal tumour burden/size of 8 mm in diameter was not exceeded. A total of N = 145 mice were used (Supplementary Table 5). This included immunocompetent female C57BL/6J wild-type mice for GBM implantations (N = 141, C57BL/6J, strain no. 000664, JAX), female MerTK–GFP69 mice for co-localization IVM studies (N = 1; strain no. 036071, JAX) and female IL-12–eYFP mice for GBM implantations, IVM mechanistic studies and bone marrow harvesting (N = 3; B6.129-IL-12btm1.1Lky/J, strain no. 006412, JAX). Mice were assigned randomly to the different experimental groups.
Tumour implantation
We used 10–12-week-old C57BL/6J mice, anaesthetized them with isoflurane, shaved their heads and immobilized the cranium in a stereotactic frame (Kopf). The surgical site was sterilized with two cycles of betadine–isopropanol. Using a Dremel tool with a burr (Fine Science Tools, 19007-07) trepanning was performed and 5 × 10⁴ CT-2A (2.5 × 10⁴ SB-28) cells diluted in 2-µl sterile PBS (Sigma-Aldrich) were stereotactically implanted into the right cerebral cortex (coordinates: 2 mm right lateral of the bregma and 2 mm posterior to the coronal suture with an injection depth of 0.7 mm below the dural surface) using a 10-µl Hamilton microsyringe driven by a fine-step stereotactic device (Kopf). CT-2A mCherry-luc cells were used for therapeutic efficacy studies, and CT-2A H2B-mApple cells were utilized for IVM studies and multiplexed FAST-profiling of GBM.
Tumour resection and wafer implantation
On day 12 after tumour implantations, animals were immobilized in a stereotactic frame (Kopf), then the surgical site was sterilized with two cycles of betadine–isopropanol. A right paramedian rostral–caudal curvilinear incision was made, and subcutaneous layers of the scalp, including the periosteum, were removed. Under ×10–20 magnification, with a radius of 2 mm around the initial tumour injection site, burr holes were made using a Dremel tool with a burr (Fine Science Tools, 19007-07). The burr holes were connected using fine microscissors, and the bone flap was consecutively lifted off with fine forceps, resulting in a craniectomy. After peeling away the dura mater, the tumours were resected, leaving behind a residual tumour volume and creating a cavity for consecutive wafer implantation. The resection cavity was then left empty, or drug-loaded wafers were placed using fine forceps. The skin was closed with interrupted sutures.
Histology
Frozen tissue sections were cut to 5-µm thickness and then processed for immunofluorescence. Frozen tissue sections were thawed, rehydrated and blocked with Intercept blocking buffer (LI-COR) for 30 min before antibody staining. The tissue sections were incubated with antibodies (Supplementary Table 6) for 1–2 h and washed with PBS for 10 min three times. An Olympus BX-63 microscope was used for image acquisition (Metamorph software version 7.10.4). CellProfiler version 4.1.8 was used for analysis of the tissue section images. A custom Python script was used to generate synthetic image maps.
Intravital microscopy
Brain window tumour model
All experiments were approved by the MGH Institutional Animal Care and Use Committee (IACUC) and performed according to MGH IACUC regulations. Cranial windows were implanted according to established methods, with modifications70. The heads of 10–14-week-old mice were shaved, animals were immobilized in a stereotactic frame (Kopf), and the skull was sterilized with two cycles of betadine–isopropanol. A large oval skin area was removed from behind the ears to between the eyes, surrounding the lambda and bregma sutures. The periosteum was pushed to the side, and all tissue on top of the skull was scraped off. The rim of the 5-mm circular section of the head, excluding the lambda and bregma, was sanded down using a Dremel tool with a burr (Fine Science Tools) and removed to provide an opening to the brain. Using stereotaxic positioning, 2 µl of OptiMEM (Thermo Fisher Scientific) with 105 CT-2A-H2B-mApple cells were injected at ~1-mm depth near the middle of the opening, avoiding vasculature. Gelfoam and saline were used to remove blood during surgery and after injection. A drop of saline and an 8-mm round cover glass were placed onto the opening. Super glue was used to attach only the rim of the cover glass to the skull, avoiding any contact between the adhesive and the brain. Dental cement was used to cement the cover glass onto the skull, cover skull areas without skin, and form an elevated rim for water immersion imaging.
Confocal imaging
All confocal images were collected using a customized Olympus FV1000 confocal microscope (Olympus America). A ×2 (XLFluor, NA 0.14), a ×4 (UPlanSApo, NA 0.16) and an XLUMPlanFL N ×20 (NA 1.0) water immersion objective were used for imaging (Olympus America). CT-2A H2B-apple tumour cells, CANDIAF647 and vascular probes were excited sequentially using 405-nm, 473-nm, 559-nm and 633-nm diode lasers, respectively, in combination with a DM-405/488/559/635-nm dichroic beamsplitter. Emitted light was further separated by beamsplitters (SDM-473, SDM-560 and SDM-640) and emission filters (BA430-455, BA490-540, BA575-620 and BA655-755) (Olympus America). Confocal laser power settings were carefully optimized to avoid photobleaching, phototoxicity or damage to the brain. All images were processed using Fiji (ImageJ2, version 2.3/1.53f).
Flow cytometry
Tissues were isolated, mechanically dissociated using surgical scissors, and digested using collagenase IV at 0.2 mg ml−1 in RPMI 1640 at 37 °C for 45 min with vigorous shaking. After digestion, tissues were filtered through a 40-µm cell strainer and resuspended in protein-free PBS. The cells were stained using AquaAmine Live Dead Fixable viability stain (Thermo Fisher) and then washed with PBS. They were then resuspended in FACS buffer (PBS with 2 mM EDTA and 2% FCS) and stained with Fc block (Biolegend) and fluorochrome-conjugated antibodies. Sample data were acquired using an Attune NxT flow cytometer (Thermo Fisher) with the Attune Cytometric software (version 5.3.0), and data were analysed using FlowJo 10.9.0 software (TreeStar).
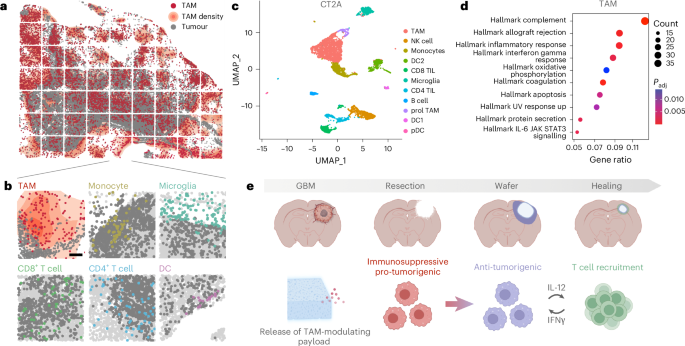
Bioinformatic analysis of published scRNA-seq datasets
Mouse data30 were downloaded from Zenodo71. Human GBM Full aggregate data from newly diagnosed patients31 were downloaded from the Brain Immune Atlas (www.brainimmuneatlas.org/download.php). Seurat (v4)72,73 was used for scRNA-seq data analysis. We constructed a Seurat object using the feature–barcode matrix for each sample. A series of quality filters were applied to the data to remove low-quality cell barcodes: possible debris with too few genes expressed (<300); possibly more than one cell with too many genes expressed (>6,000–10,000 according to the sample); possible dead cell or a sign of cellular stress and apoptosis with too high proportion of mitochondrial gene expression over the total transcript counts (>20%). Each sample was scaled and normalized using Seurat’s ‘NormalizeData’ and ‘ScaleData’ functions. We then merged all samples and repeated the same scaling and normalization method. For human data, all cells in the merged Seurat object were integrated using ‘IntegrateData’ and the top 30 principal component analysis dimensions. Data were clustered using Seurat’s ‘FindNeighbors’ and ‘FindClusters’ (with the parameter resolution = 0.5) functions. The resulting merged and normalized matrix was used for the subsequent analysis. Differentially expressed genes (DEGs) were identified by the ‘FindMarkers’ function, comparing cells belonging to one subtype to the rest. The Wilcoxon statistical test was used. log2FC > 0.25 and false discovery rate (FDR) < 0.05 were used to filter DEGs. Clusters were annotated as described in the original papers. Macrophage and microglia-specific markers were used for further characterization. Geneset enrichment analysis was performed with the ‘enricher’ function. The hallmark collection of the MSigDB repository was tested for this analysis with the following parameters: pAdjustMethod = ‘BH’, pvalueCutoff = 0.05, qvalueCutoff = 0.05.
Bulk RNA-seq
To determine the effects of the wafer on phagocytic cells, bulk RNA-seq was performed. BMDMs were isolated and differentiated as previously described27. Cells were then stimulated for 24 h with drug-loaded wafer material to induce activation. RNA was isolated using the RNeasy Plus Mini Kit (Qiagen). Final RNA concentration was determined by absorbance (Nanodrop), and samples were stored at −80 °C until shipment for sequencing (NovoGene).
Cytokine measurements
In vitro cytokine expression
To determine the relative expression levels of several cytokines and chemokines in response to the (drug-loaded) wafer, an immunoassay (R&D Proteome Profiler Mouse XL Cytokine Array) was performed with cell culture supernatants from BMDMs that had been stimulated for 24 h with empty or drug-loaded wafer material.
Peripheral IL-12 p70 levels
Drug-loaded wafers were implanted as described in the section Tumour resection and wafer implantation. Blood draws were performed on days 1, 2, 4, 8 and 14 after implantation. Whole blood (100–200 µl) was collected in K2EDTA-coated blood collection tubes (BD Microtainer 365967) and spun down at 2,000 r.c.f. for 10 min. Serum was stored at −20 °C for downstream analysis. IL-12 p70 levels were measured using a mouse IL-12 p70 quantikine ELISA kit (R&D Systems M1270). The experiment was conducted with three animals per group (N = 6; one animal in the CANDI wafer-treated cohort had to be euthanized on day 10 due to poor body condition from the repeated blood draws).
MRI
MRI of GBM-bearing mice was performed for different reasons: (1) to monitor the growth of GBM following implantation; (2) to monitor the evolution following GBM resection and wafer implantation (at baseline (day 13) and after treatment (day 22)); (3) to image the dissolution of wafer material. All imaging was performed on an animal 4.7-T MR imaging unit (Bruker Pharmascan) under respiration-monitored isoflurane anaesthesia. Coronal imaging parameters for pre- and post-contrast enhanced T1-weighted imaging were as follows: repetition time (TR) = 700 ms, echo time (TE) = 14 ms, matrix size 256 × 256 and slice thickness 0.5 mm. Twelve sections were acquired. Imaging parameters for pre-enhanced T2-weighted imaging were as follows: TR = 4,000 ms, TE = 53.3 ms, matrix size 256 × 256, slice thickness 0.5 mm. Twelve sections were acquired. Tumour or wafer volumes were calculated by using the Horos image-processing software for tumour volumetric data via region of interest-based three-dimensional (3D) analysis of Gd-DTPA enhanced T1-weighted MR images (Horos, horosproject.org).
Bioluminescence imaging
Bioluminescence imaging was performed using an Ami HTX Spectral Instruments Imaging instrument at baseline (day 12) and after treatment (days 19 and 26). Mice received an intraperitoneal injection of luciferin (5 mg per mouse) and were maintained under respiration-monitored isoflurane anaesthesia during imaging. Imaging parameters were as follows: 10-s and 0.5-s exposure; binning levels 1, 2, 4 and 8. Total flux (photons s−1) was used for signal quantification.
Testing in human organotypic tissue slices
To determine the effects of wafer material on human GBM tissue, we studied freshly resected GBM sections. This study was approved by the Human Research Ethics Committee from the Geneva University in Switzerland (CCER 2022-02109 and 2023-01928). Patients included a 37-year-old male and a 52-year-old male. Informed consent was obtained from all patients who had been enroled (n = 2). Patients did not receive compensation. Freshly resected GBM specimens were transferred from the operating room to the laboratory in a 50-ml conical tube containing ice-cold medium (high-glucose DMEM supplemented with HEPES 1× and 1× penicillin–streptomycin solution). Pieces were punched from fresh tumour, embedded into 2% agarose, then sliced on a vibratome to a thickness of 400 µm. GBM slices were cultured on a polytetrafluoroethylene insert (pore size 0.4 µm) in 24-well plates with culture medium (neurobasal medium supplemented with B27 1×, d-glucose 1.5 mg ml−1, Glutamax 600 µM, l-glutamine 400 µM and 1× penicillin–streptomycin solution). Tumour slices (n = 5 per condition) were cultured for 34 days, and the CANDI wafer process was performed on the second day. CANDI wafers (0.01 mg ml−1, 0.1 mg ml−1 or 0.5 mg ml−1) or not were added to the GBM slices for 72 h in an incubation system (37 °C, 5% CO2). Supernatant was collected after 4, 24, 48 and 72 h for IL-12 p70 assay. GBM slices (n = 3 per condition) were then fixed in paraformaldehyde 4% for immunohistofluorescence. The experiments yielded comparable results between the two patients, supporting the robustness and reproducibility of the findings.
Statistics and reproducibility
All statistical data analyses were performed using GraphPad Prism 10.0.2 software or R (version 4.3.0, version 4.4.0) and the results were expressed as mean ± s.d. or with 95% confidence intervals (CIs). For normally distributed datasets, we used a two-tailed Student’s t-test and one-way ANOVA followed by Bonferroni’s multiple comparison test. When variables were not normally distributed, we performed non-parametric Mann–Whitney or Kuskal–Wallis tests. Survival data were analysed using the Kaplan–Meier method and two-sided log-rank (Mantel–Cox) test to analyse the statistical significance of the difference between survival groups. (Restricted) mean survival times and hazard ratios with 95% CIs were calculated. Survival studies were repeated in independent experiments, yielding consistent results, and data were pooled for statistical analysis. P values > 0.05 were considered not significant (NS), P values < 0.05 were considered significant. Experimental numbers are listed in the figure legends, and in Supplementary Table 5. No statistical methods were used to predetermine sample sizes. Animals and samples were randomly assigned to the various experimental groups. Data collection and analysis were not performed blind to the conditions of the experiments. If not stated otherwise, no animals or samples were excluded. The number and type of replicates (biological or technical) are indicated in each figure legend.
Reporting summary
Further information on research design is available in the Nature Portfolio Reporting Summary linked to this Article.
First Appeared on
Source link

