The Gradual Print is Here
February 8, 2026
This newsletter issue discusses the implications of the Fed’s shift from long-term balance sheet reduction to its new trend of (expected) long-term balance sheet expansion. It also touches on Japan’s atypical bond situation and the volatile boom in precious metals.
This issue is supported by YCharts, which I use for both stock-specific and macroeconomic research and visualization. You can access a free trial here.
The Gradual Print
In my prior newsletter, I discussed how the overnight financing markets were running into liquidity shortages, and that the Fed would likely begin balance sheet expansion in the not-too-distant future. In contrast to some that are calling for a large upcoming period of money-printing (e.g. a “big print” or a “nuclear print”), I’ve referred to this as the “gradual print.”
Shortly after that, the Fed did announce that they would begin expanding their balance sheet on an ongoing basis, in order to maintain what they consider to be ample reserves in the banking system and to maintain control of interest rates. They’ll be continuing to let mortgage-backed securities mature off of their balance sheet, while adding to treasury securities of durations up to 3 years.
Specifically, they called for $40 billion per month in purchases to start with, along with an expectation for that rate of purchases to remain elevated through tax season in April 2026. This, in their view, would alleviate the recent liquidity shortage and provide somewhat of a liquidity buffer to prepare for the annual liquidity drawdown that happens every tax season. Thereafter, Fed Chairman Jerome Powell estimates that $20-$25 billion per month is a baseline structural rate of balance sheet growth:
As detailed in a statement released today by the Federal Reserve Bank of New York, reserve management purchases will amount to $40 billion in the first month and may remain elevated for a few months to alleviate expected near-term pressures in money markets. Thereafter, we expect the size of reserve management purchases to decline, though the actual pace will depend on market conditions.
[…]
So, you know, we announced that we’re resuming reserve management purchases. That is completely separate from monetary policy. It’s just we need to keep an ample supply of reserves out there. Why so big? The answer to that is, you know, if you look ahead, you will see that April 15th is coming up, and our framework is such that we want to have ample reserves even at times when reserves are at a low level temporarily. So that’s what happens on Tax Day. People pay a lot of money to the government, reserves drop sharply and temporarily. So this seasonal buildup that we’ll see in the next few months was going to happen anyway. It was going to happen because April 15th is April 15th. There’s also a secular ongoing growth of the balance sheet. We have to keep reserves, call it, constant as a—as it relates to the banking system or to the whole economy. And that alone calls for us to increase about $20 or $25 billion per month.
-Jerome Powell, December 10, 2025 Press Conference
In the meeting minutes for that same December 10th meeting, the consensus by FOMC members was for $220 billion over the following 12 months, which equates to slightly under $20 billion per month. Powell’s estimate is thus on the higher end of the range.
The mechanism for this is that the Fed creates new bank reserves out of thin air, and then trades them to banks for treasury securities. The Fed’s assets increase (in the form of treasuries) and their liabilities increase by an equal amount (in the form of bank reserves, which are assets for the banks). The US Treasury Department gets to have a fraction of its debt issuance monetized.
There are two primary types of balance sheet increases by the Federal Reserve, and it results in some debate about what constitutes “quantitative easing” and what does not.
The description I’ve used before is that balance sheet increases that don’t meet the definition of quantitative easing (due to the shorter treasury security durations purchased) are similar to sparkling wines that technically don’t meet the definition of champagne (due to the grapes’ location of growing). At that end of the day, champagne is a subset of sparkling wine, and quantitative easing is a subset of base money printing.
-When the Fed does what they call “quantitative easing” in particular, they create new bank reserves to buy long-duration bonds (and sometimes short-duration bonds at the same time), and they primarily do so for the purpose of stimulating the economy (whether it works or not is another story, but that’s their stated intention). This is typically a tactic that’s used after interest rates have already been dropped to zero and they still feel they need more stimulus, which was common during the post-GFC environment through much of the 2010s decade. This reduces the overall amount of bond duration in the commercial financial sector and provides more base liquidity.
-When the Fed expands their balance sheet to maintain “ample reserves” but without doing “quantitative easing”, it means that they create new bank reserves to buy short-duration securities, and it’s for the purpose of maintaining control of short-term interest rates at their target level, and/or to alleviate liquidity shortages (since unaddressed liquidity shortages lead to losing control of interest rates). This type of balance sheet expansion can occur regularly even when interest rates are positive and even when the economy is running at an acceptable pace. The stated purpose is not to stimulate the economy; it’s to let banks keep making loans and buying securities without running into regulatory or self-imposed liquidity limits. It’s what keeps the fractional reserve lending system ever-growing nominally.
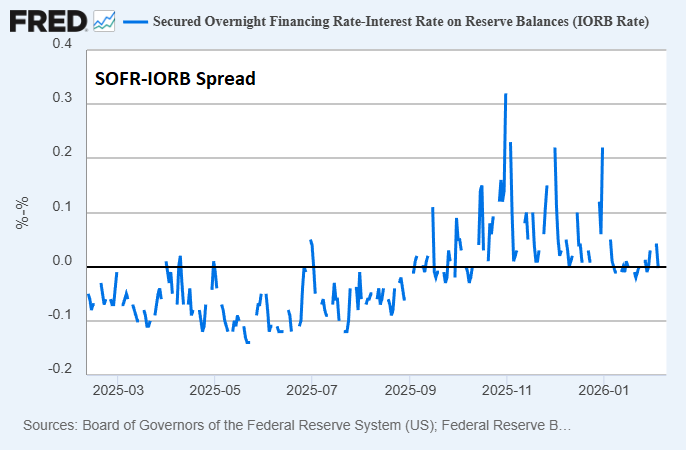
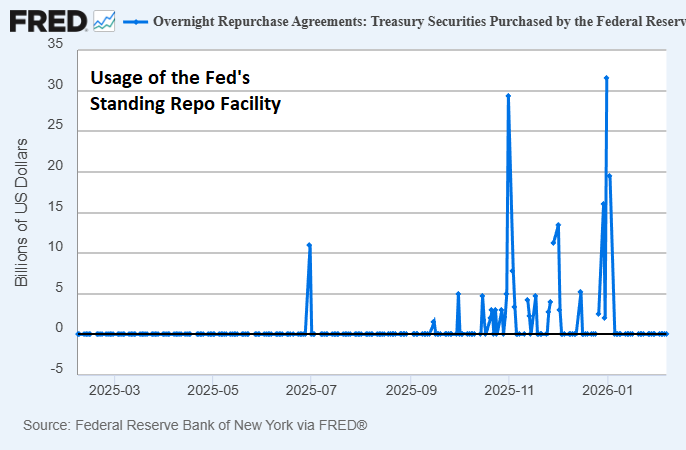
In particular, during this September-through-December liquidity shortage period, overnight financing rates remained elevated relative to the interest rate that banks receive on their reserves (indicative of a liquidity shortage), and financial institutions were coming to the Fed’s standing repo facility to get overnight financing (indicative that financial institutions had trouble finding sufficient financing from other institutions). Both of these issues have been alleviated since the start of January, with the Fed adding new base liquidity to the system.
We can create a range of possible balance sheet expansion scenarios for 2026. The FOMC estimated $220 billion by December 2026. If the Fed increases their balance sheet at $30 billion per month through April and $20 billion per month after that, then it would be $290 billion instead. If they average $40 billion per month through April and $25 billion per month after that, the figure would jump to $375 billion.
Here’s what that would look like, for context:
-QE 1 was about a $1.3 trillion increase (an approximately 140% gain relative to the starting size) in a few months.
-QE 2 was about a $600 billion increase (an approximately 25% gain relative to the starting size) in less than a year.
-QE3 was about a $1.5 trillion increase (an approximately 50% gain relative to the starting size) in a little under two years.
-QE4 was a massive $4.8 trillion increase (an approximately 115% gain relative to the starting size) in about two years.
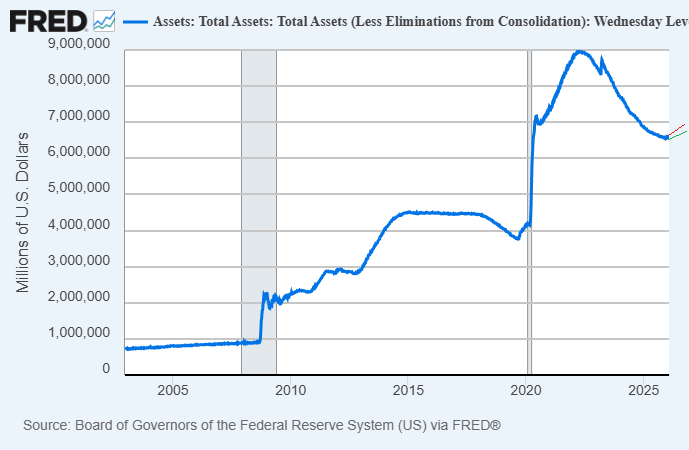
Compared to those figures, $220 billion to $375 billion is not a ton. That’s about a 3% to 6% gain relative to the $6.5 trillion starting size as of mid-December. Even if we double the high end estimate to $750 billion due to unforeseen circumstances (an 11% gain relative to the starting size), then that’s still pretty modest.
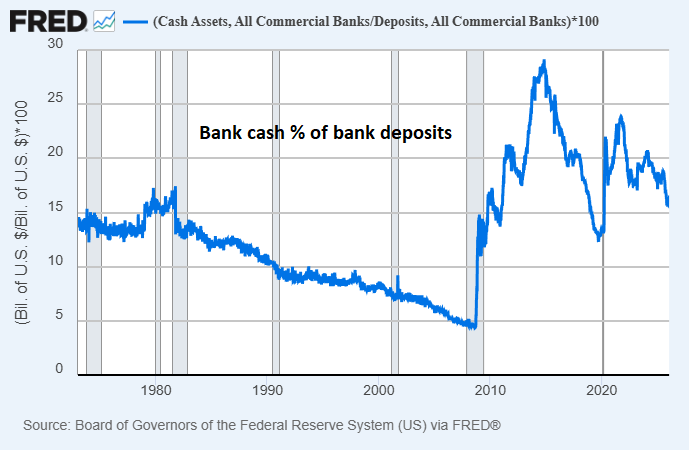
Prior to the global financial crisis in 2008, banks in aggregate had a very low percentage of their customers’ deposits backed by cash (a combination of physical cash and reserves), with the rest consisting of less liquid assets (various securities and loans). At that low point it reached under 5%, and that was basically “peak fractional reserve” for the US banking industry. After 2008, due to various new banking regulations and a major expansion of reserves, banks hold a larger share of deposits in cash. The current figure is around 16%.
Those who want more detail on how banks work in step-by-step can check out Part 3 of my book, Broken Money.
Above-Baseline Scenarios
Total bank deposits in the US grew from about $17.4 trillion to $18.6 trillion over the past two years, which translates into $600 billion per year on average.
If that pace continues for a while, and the Fed wishes to maintain the current 16% backing of deposits with reserves to minimize liquidity shortages, it means they need about $100 billion in new reserves per year. I would bet that deposit growth would be higher than that, largely fueled by structurally high fiscal deficits.
There are other ways to run that sort of calculation, resulting in different outcomes. The Fed, in their own annual materials, typically refers to the size of their balance sheet relative to the country’s GDP (targeting around 20% going forward) or bank cash levels as a percentage of bank assets (viewing “ample” to be around 12%, give-or-take).
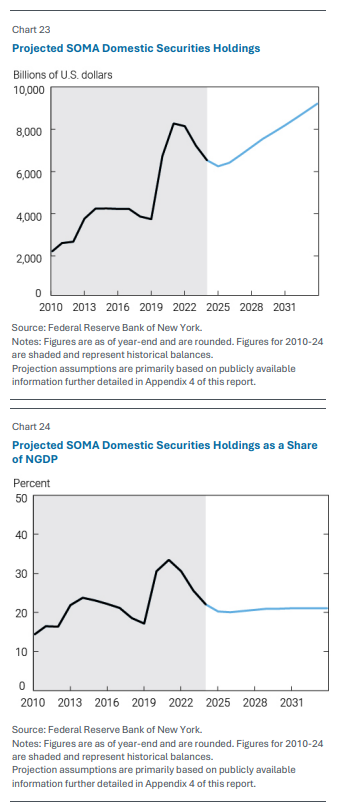
The United States added about $3.5 trillion in GDP over the past two years, or just under $1.8 trillion per year. If that pace continues for the next two years, and the Fed maintains their current ~20% ratio of their balance sheet to GDP growth, that’s $360 billion per year in balance sheet growth.
As previously discussed, the Fed projects sub-$220 billion to $375+ billion in balance sheet increases this year, which is in line with those estimates. Even if we double that top end to $750 billion, it’s not all that big in the grand scheme of the size of the system today.
So the question is, what scenarios could destabilize that baseline outcome and result in much higher figures?
Recession
Because the United States is much more financialized than most of its peers, its tax receipts are rather correlated with asset price performance. In particular, when the stock market goes sideways-to-down for a year or more, tax receipts start to stagnate as well, with a lag.
Similarly, if unemployment rises, it chips away at tax receipts.
Decades ago, the dog used to wag the tail, meaning the health of the economy had a big affect on the stock market. Now that the stock market is so large (200% of GDP), the tail wags the dog, meaning a weak stock market can materially impact the health of the economy. This is because nearly 90% of stocks are held by the top 10% of society, and that same 10% of society performs nearly 50% of all consumer spending. When their portfolios aren’t doing well, they tend to tighten their spending a bit. That affects business profits, which then restrain hiring, completing the circle.
Most federal spending is locked in, and so a weak stock market or a recession would likely materially increase the fiscal deficit. This can result in more Fed purchases of treasury securities, and/or could push the Fed to perform quantitative easing for the purposes of economic stimulation. Thus, we could see the balance sheet scale faster than the baseline case.
This is not my base expectation for 2026, but it’s certainly possible.
Financial War
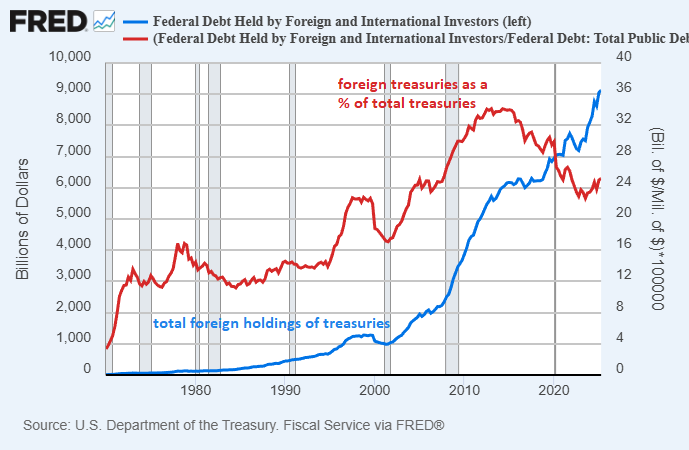
Foreigners currently hold approximately $9.3 trillion in US treasuries according to the most recent data. The real figure is likely a bit lower than that, because some “foreign” holders are actually American hedge funds headquartered in the Caymans and so forth, but the overall figure is in that ballpark.
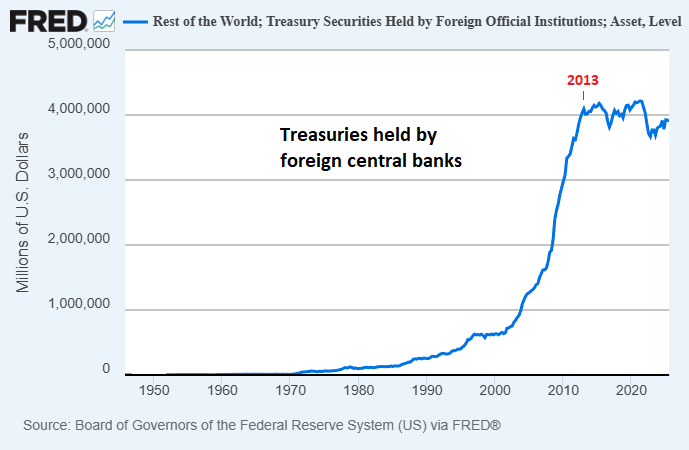
The US Treasury Department separates foreign treasury ownership into two main types: official and non-official. Official holdings primarily refers to foreign central banks who who hold treasuries as collateral for their own domestic currencies. Unofficial holdings refers to public sector wealth funds and pension plans, as well as private sector funds and other entities.
Notably, although total foreign ownership of treasuries has inched up in recent years, literally all of the buying has been in the unofficial sector. The official sector hasn’t added treasuries in a decade. And, even including the unofficial sector, foreigners are buying a smaller share of total US debt issuance, meaning that foreign ownership as a percentage of the total has been on the decline and domestic entities have had to own more of it.
Additionally, the foreign sector holds a ton of US equities, corporate bonds, and real estate. In total, they own about $69 trillion worth of US financial assets.
If policies from the United States anger other countries to a sufficient degree, or spook them such that they no longer trust US rule of law, they could fire-sell some of their assets. The biggest entities are reticent to do that because their rapid selling could affect the liquidity of their own assets (i.e. their own selling pressure is strong enough to materially reduce the prices of the assets they’re selling, which goes against their financial interests), but they can sell in waves.
The Fed has no mandate, nor any particular reason, to backstop the US equity market. However, they will always backstop the US treasury security market. It’s not impossible to imagine scenarios roughly at the magnitude of Covid-19 where the Fed has to buy $1 trillion or more in treasuries within a matter of weeks as a result of some extreme international dispute and acute liquidity problem.
Likewise, any sort of unexpected major disruption of global economics, such as another pandemic and lockdown, would fall within this category.
These types of events that would result in more than a trillion dollars of rapid buying are not within my base case for 2026 or 2027, but they’re certainly possible and thus worthy of consideration. As long as Treasury Secretary Scott Bessent is still at the helm of the Treasury Department, I’d categorize this scenario as unlikely.
However, the system is already at numbers so large that even $1 trillion of rapid Fed QE is not what it used to be, when the starting balance sheet is over $6.5 trillion. That would only be a 15% increase, which is material but not earth-shaking. It would take $2+ trillion for me to consider a round of money-printing to be “big” at this point.
Kinetic War
Any sort of kinetic war between major powers could result in asset seizures, rapid divestment, and potentially the Fed having to print money to buy illiquid treasury securities. This is basically a more extreme version of the prior financial war scenario, since financial war accompanies kinetic war.
Summing it Together
The US banking system is already well capitalized and reasonably liquid.
However, the longer we look out, the higher the probability there is of one of these scenarios occurring.
Thus, my base case is roughly in line with what the Fed expects: to grow its balance sheet approximately at the same proportional pace as total bank assets or nominal GDP. Occasional mini-crises could result in a mild spike higher than that baseline, but nothing short of a couple trillion is really considered “big” at this point.
What does this mean for assets? If this is indeed how it plays out, then it’s mildly stimulating for asset prices broadly, and mildly dollar-negative. Since it’s only a mild upward force, it means other forces do matter quite a bit- valuations, corporate profit margins, and so forth.
Overall, it means I continue to want to own high-quality scarce assets, with a tendency to rebalance away from extremely euphoric areas and toward under-owned areas.
Below-Baseline Scenarios
President Trump has announced that his nominee for the next Fed chairman (a term that starts in May 2026) will be Kevin Warsh. The U.S. Senate would have to confirm it at that time to make it official.
Warsh is on record saying he is in favor of a smaller Fed balance sheet, which is in contrast to the Fed’s existing forecasts. Therefore, it needs to be asked: could a shake-up in leadership at the Fed change their balance sheet composition?
The answer is likely “not much” but with some caveats.
-The chairman is powerful, but he’s only one of 12 votes on the Federal Open Market Committee, so he doesn’t unilaterally set policy.
-The Fed and other federal agencies could further ease bank regulations, allowing them to hold more treasuries without negatively impacting their regulatory leverage ratios. That means the Fed can own fewer treasuries.
-The Fed could take some steps to discourage excess reserve accumulation at banks, thereby distributing the reserves that are in the system a bit more evenly. This could let them shrink their balance sheet by perhaps a few hundred billion dollars.
-The Treasury Department could increase its average debt duration and shrink its average cash account size (known as the Treasury General Account). A smaller cash account size would give more liquidity back to the banking system, enabling a smaller Fed balance sheet by perhaps a few hundred billion dollars. However, the government generally doesn’t want higher long-term interest rates, so they’re sensitive about how much supply of long-duration debt they issue.
In theory, if all of those things were done, the Fed’s balance sheet could go down by somewhere around a trillion dollars. However, the chances of that happening are low.
And importantly, all of those measures just move liquidity around. Banks buying more treasuries on fractional reserve is functionally similar to the Fed buying them with new reserves. And moving reserves around and reducing the Treasury General Account basically result in efficiency gains: doing more with less.
At the end of the day, the Fed is going to optimize for 1) maintaining bank lending and broad money creation at a moderate pace, 2) ensuring the treasury security market remains liquid, and 3) ensuring that the repo market remains liquid and that any liquidity stresses that do pop up don’t remain acute for very long.
Japan’s Perilous Bond Situation
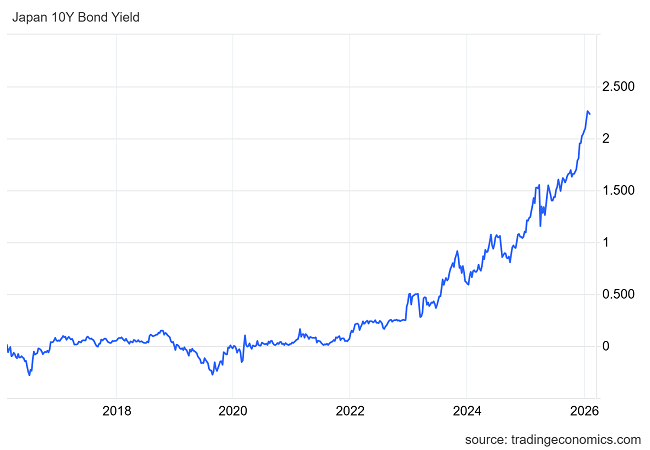
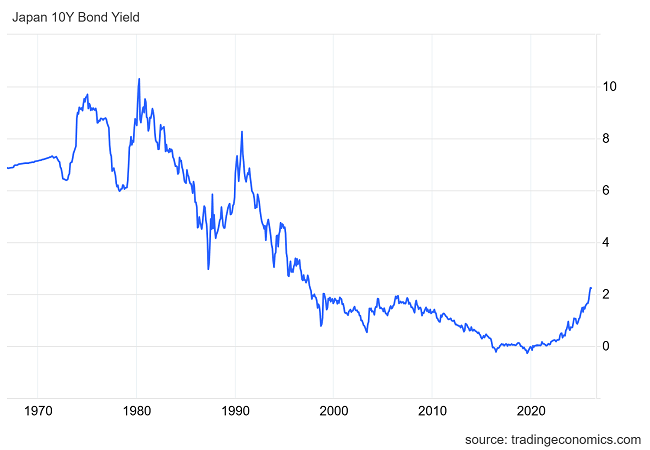
Japan has made headlines recently for its rapidly rising bond yields.
They’re still among the lowest yields in the world, but since Japan’s government has well over 200% debt-to-GDP, even a modest rise in bond yields can mean massive interest expense relative to the size of the economy.
Across the financial corners of social media, I see many people talking about how Japan is “blowing up” or how this rise in bond yields will spell disaster for global financial markets. There are a few main reasons commonly cited:
-Japan is a large creditor nation and a funding currency; various entities borrow in yen and then go out and buy other higher-yielding assets throughout the world. As such, sharply rising yen borrowing costs can lead to deleveraging, and thus a selling of various assets globally.
-A persistent rise in bond yields when debt levels are so high can lead to a “fiscal spiral” where greater and greater interest expense is paid out, leading to runaway growth in the money supply.
-Leveraged holders of Japanese bonds may become insolvent. The sharply rising US yields in 2022 led to some banks in the United States blowing up in the spring of 2023. This is because as bond yields rise, it means bond prices fall, and if a bank is levered 10-to-1 on an asset that is down considerably, it can lead to them being insolvent, with liabilities exceeding their assets as depositors pull money out, forcing them to sell their underwater bonds at a loss. People rightly ask- with the massive amount of Japanese bonds outstanding, and their prices falling so fast (as their yields rise so fast), then who might blow up?
While those are all material issues, I’m not nearly as concerned about them on a macro scale as others seem to be. For a similar reason that I wasn’t as concerned about the 2023 regional bank blow-up as many others were: it only took a tiny amount of capital to put out that fire because it wasn’t as big as sensationalists claimed.
For starters, it’s important to ask who owns most of the Japanese bonds. The answer is that about 50% are owned by Japan’s central bank, which nobody can do a bank run on. They can sit with negative equity for years if need be. Another 15% or so are owned by insurance companies, and their liability side isn’t really prone to rapid pull-outs either. Another 15% or so is owned by banks, and that’s where trouble might occur because depositors can pull money out and trigger an insolvency event for underwater positions. However, Japanese bank stocks have been soaring lately; they love a steeper yield curve. And then the other 20% or so are owned by a broad combo of foreigners, households, pensions, and so forth that aren’t very levered or that aren’t systemic if they are (like hedge funds).
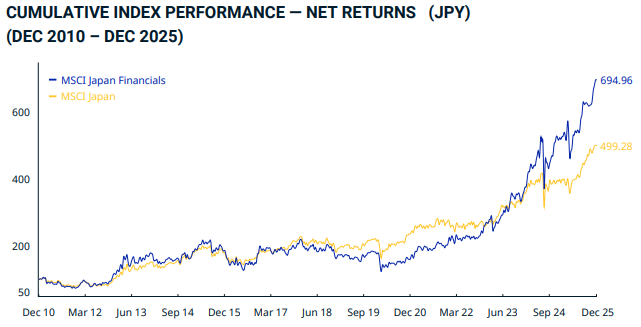
Charge Source: MSCI
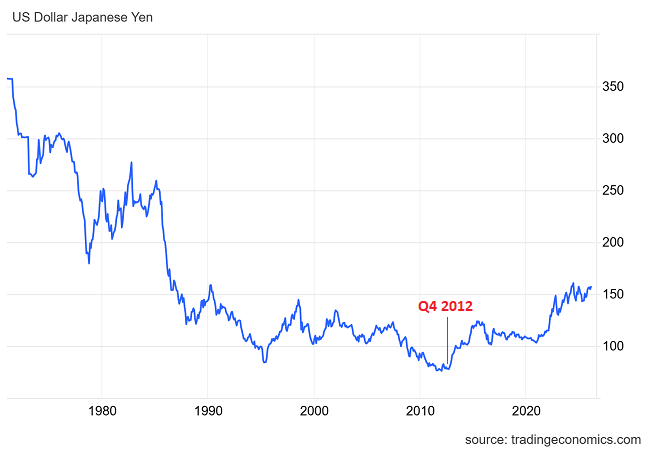
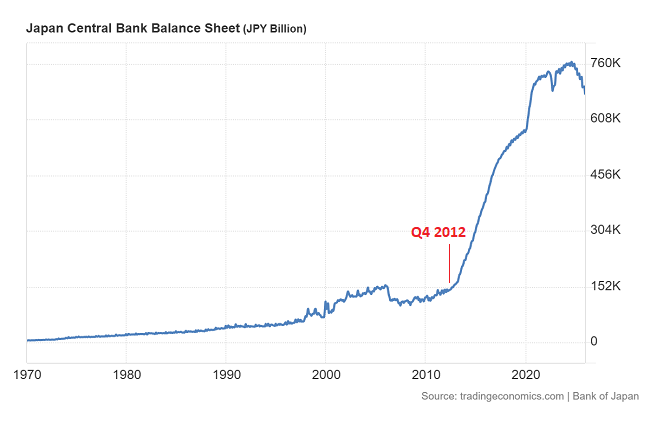
Next, it’s helpful to explore Japan’s options if their sovereign bond yields do get out of control. An option that’s available to them (and that they’ve used in the past) is yield curve control. The way that works is that they can print yen and buy any bond that goes over their yield target, thereby suppressing yields. However, this usually rapidly devalues a currency, because the quantity of the currency is increasing and holders are not getting paid market-clearing interest rates to hold it, and so the central bank ends up owning more and more of the bonds as various entities exit their positions. The currency falls relative to other currencies, which can mean higher import costs and higher price inflation.
Indeed, the yen has already lost a lot of value relative to the dollar in recent years. Decades ago, it took 300+ yen to equal one dollar, but the yen kept strengthening. It peaked around 2011, where it only took 80 yen to equal a dollar. But that’s when the Bank of Japan started massively ramping up its balance sheet, and occasionally performing yield curve control, and now it takes over 150 yen to equal a dollar.
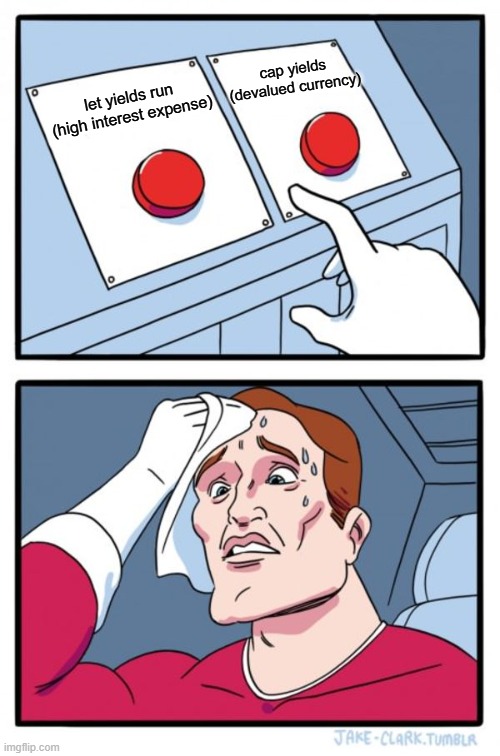
Since they’re so heavily indebted, rapidly rising bond yields leave Japanese policymakers with a tough choice. Let yields keep rising, and thus spiral out their interest expense to untenable levels? Or cap yields and severely reduce the value of the currency, triggering inflation?
Japan, however, has a third option that not all countries have. Since they ran trade surpluses for decades, they have a huge stockpile of foreign exchange reserves and other global assets. In total, Japan has over $1.3 trillion worth of foreign exchange reserves, and much of those are in US treasuries. They can sell these and buy back yen to bolster the yen’s exchange rate. There are also large pension funds that the government can set mandates for, such as maximum limits on how much they can invest abroad.
Thus, Japan could cap yields to suppress their interest expense, and then offset the declining yen with sales of their foreign assets. Instead of the yen rapidly falling, it would be their reserves rapidly falling, and they’ve got a lot of reserves. More realistically, it can be a combo of both, where they let the yen weaken, and rapidly sell some assets and intervene to strengthen the yen whenever yen-shorters get too leveraged. Thus they can split the difference between a gradually declining yen and a gradual drawdown of their reserves, and kick the can down the road a lot further than many people think.
The optimal answer may very well depend on energy prices. If oil prices are low, as they are now, then Japan can withstand quite a bit of yen devaluation before it would really hurt politically. However, if energy markets get tight again, with higher oil prices, then even moderate yen devaluation can hurt the average Japanese household quite a bit, and thus affect how they vote.
Overall, it’s absolutely true that Japan has problems, mainly tied to high debt and unfavorable demographics. But they’re a creditor nation (they own far more foreign assets than foreigners own of their assets), they have a structural current account surplus, they have a rather harmonious culture that is resistant to polarization/extremes compared to the US or most western European nations as of late, and they have rather sane energy policies (in contrast to, say, Germany).
Much like how the US fiscal train won’t be stopping any time soon, I don’t think the Japanese fiscal train will be stopping any time soon either. They will face bumps along the way, but we’re still in the early innings of this global sovereign debt problem playing out, including Japan even though they’re out in front of the pack.
Portfolio Updates
I have several investment accounts, and I provide updates on my asset allocation and investment selections for some of the portfolios in each newsletter issue every six weeks.
These portfolios include the model portfolio account specifically for this newsletter and my relatively passive indexed retirement account. Members of my premium research service also have access to three additional model portfolios and my other holdings, with more frequent updates.
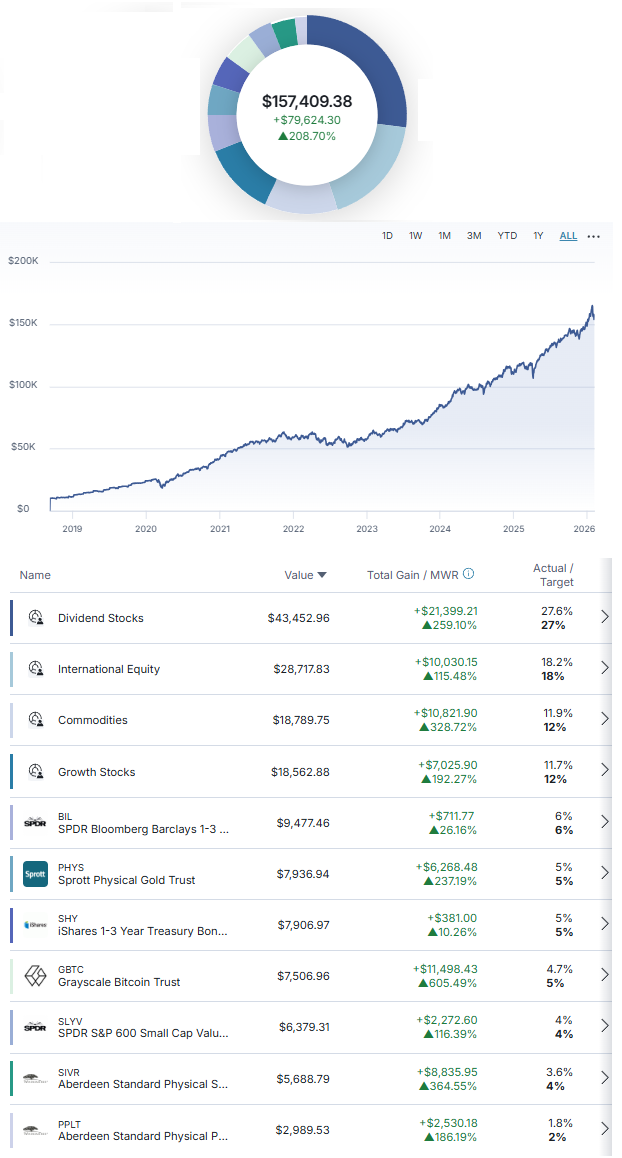
M1 Finance Newsletter Portfolio
I started this account in September 2018 with $10k of new capital, and I dollar-cost average in over time.
It’s one of my smallest accounts, but the goal is for the portfolio to be accessible and to show newsletter readers my best representation of where I think value is in the market. It’s a low-turnover multi-asset globally diversified portfolio that focuses on liquid investments and is scalable to virtually any size.
And here’s the breakdown of the holdings in those slices:
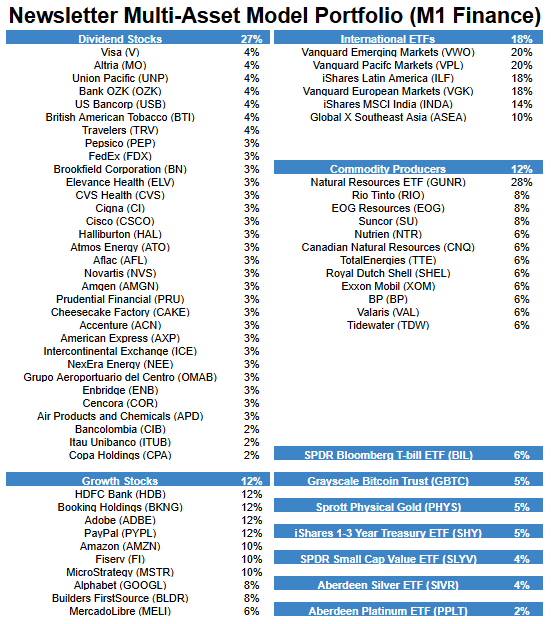
Changes since the previous issue:
- Added Copa Holdings to the dividend stock pie.
Other Model Portfolios and Accounts
I have three other real-money model portfolios that I share within my premium research service, including:
- Fortress Income Portfolio
- ETF-Only Portfolio
- No Limits Portfolio
Plus, I have personal accounts at Fidelity and Schwab, and I share those within the service as well. Premium reports come out every two weeks.
Final Thoughts: Precious Metals Volatility
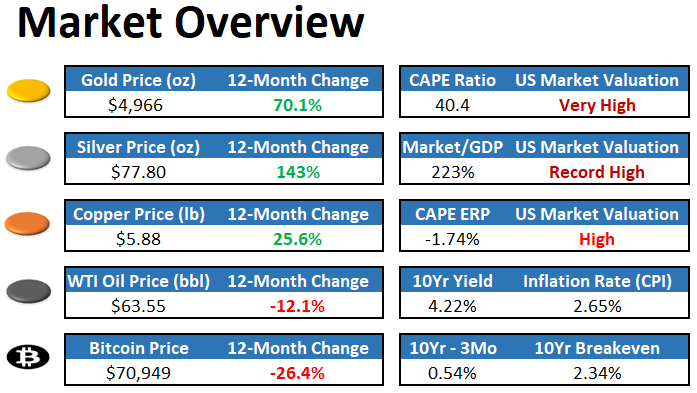
Precious metals have absolutely soared lately, with gold briefly reaching over $5,000 per ounce, platinum reaching over $2,500 per ounce, and silver reaching over $120 per ounce.
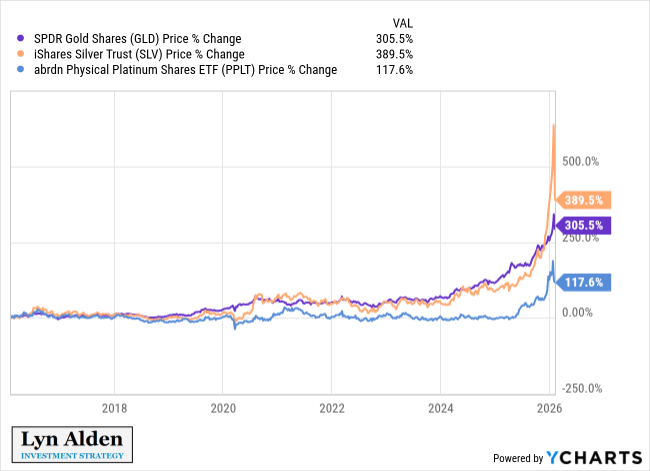
They had sharp corrections (especially silver) in late January, with a number of factors including the nomination of Kevin Warsh being pointed to as catalysts (due to his perceived hawkishness on policy). But ultimately, when price charts go vertical, it doesn’t take much to trigger a rapid drawdown.
The newsletter portfolio has been long precious metals since 2019, with strong performance from them. Within my research service, my stance on precious metals over the past year has been to let them keep running, and not trying to call a top too early, which has worked out well. However, I’ve also warned about not chasing it too much, and potentially trimming out some if a portfolio becomes too imbalanced. The problem is that the trade just isn’t as asymmetrical as it once was when they were all cheap.
With sovereign debt bubbles existing throughout the developed world, and with increasing animosity between the United States (the reserve currency issuer) and other countries, none of this should be surprising. What is perhaps a bit surprising is the “all at once” aspect to it, since the sheer speed and magnitude of these moves have been immense, but financial moves do tend to take longer than people think and then counterintuitively start to happen faster than people think.
When zooming out, we are in what is basically the fourth major bear market in US stocks relative to gold within the modern era. In this case, it’s because gold is going up a lot more than stocks, rather than because stocks are going down. That makes sense during a period of sustained fiscal dominance. And dividends don’t make up for it as much as they used to, because dividend yields are at record lows.
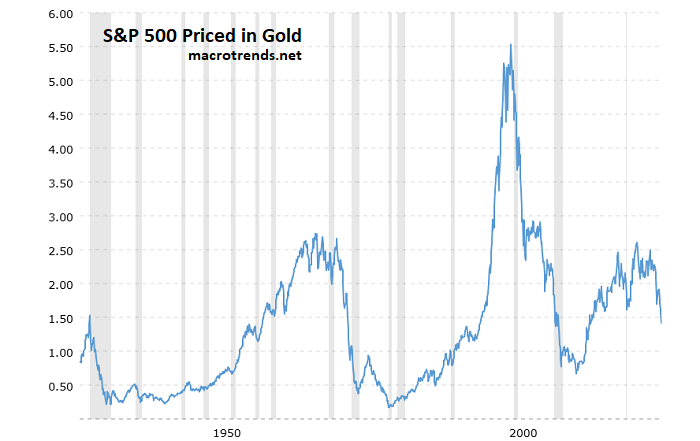
The first bear market was the 1930s Great Depression. The second bear market was the 1970s dollar default and runaway inflation. The third bear market was the aftermath of the Dotcom Bubble in the 2000s. And here, the fourth one, is occurring in the post-Covid stimulus environment and at a time when sovereign debts are the highest they’ve been since World War II, and when the post-WWII global order is being upended to some extent.
While I’m no longer as bullish on precious metals as I was years ago, I don’t view them as being in a bubble per se. I think they became overbought, but I primarily view them as having rapidly repriced out of undervalued status closer to fairly-valued status. They no longer offer the clear asymmetric upside they once did, and thus I would advise caution with them just like any other asset.
Best regards,
First Appeared on
Source link

