The molecular basis of force selectivity by PIEZO2
Study design
No statistical methods were used to predetermine sample size and the sample size was based on a previous study16. All attempts at replication were successful, and all experiments were repeated more than once, as indicated in the figure legends. The experiments were not randomized, and investigators were not blinded to allocation during experiments and outcome assessment. For MINFLUX, all experiments were repeated at least three times with separate biological and technical replicates, imaged over at least two separate days. Label-free controls were included to ensure signal specificity. For electrophysiology, experiments were conducted as previously described without blinding1,6,16. Untransfected control groups were measured on each day of experimentation, and each separate manipulation was paired with wild-type PIEZO1 and PIEZO2 control measurements.
Expression constructs
The coding sequence of mouse PIEZO2 (UniProtKB: Q8CD54) was codon optimized, synthesized and cloned into the pcDNA3.1 plasmid. For imaging and MS experiments, an amber stop codon was inserted after amino acid 104 (TCO*K 105) through site-directed mutagenesis using the Q5 Site-Directed Mutagenesis Kit (New England Biolabs), and a C-terminal HaloTag and Strep-Tag II. Labelled PIEZO1 plasmids with a tag after position 102 (TCO*K-103) were prepared the same way from mouse PIEZO1 (UniProtKB: E2JF22), as described previously16. For genetic code expansion, the tRNA and tRNA synthetase expression plasmid of pNEU-hMbPylRS-4xU6M15 (Addgene, 105830) was modified to have a mNeonGreen sequence upstream of the tRNA synthetase sequence separated by a T2A self-cleaving peptide to mark transfected cells. For electrophysiology experiments, codon-optimized mouse Piezo2 was cloned into the pcDNA3.1 vector upstream of an IRES mNeonGreen sequence, and mouse Piezo1 was cloned into the pcDNA3.1 vector upstream of an IRES eGFP sequence. PIEZO2(ΔIDR5) was created by deleting the coding sequence of amino acids 621–673 as described previously4. The PIEZO1 + IDR5 chimera was created by replacing the fifth IDR of PIEZO1 (amino acids 551–575) with the corresponding IDR5 region from PIEZO2 (amino acids 620–672). The sequences of each plasmid were verified using whole-plasmid sequencing (Plasmidsaurus). All DNA sequences were viewed and designed in SnapGene software (Dotmatics).
Coverslips with embedded gold fiducials
#1.5 D263 borosilicate coverglass (Warner Instruments) were cleaned by boiling in 1% Hellmanex III detergent (Hellma) in MilliQ water and sonicating for 15 min in a water bath sonicator. The coverslips were washed five times with MilliQ water, exchanged into 100% ethanol and then dried and placed onto a sheet of 4 in × 4 in × 1/8 in 304 stainless steel. Then, 150 nm gold nanoparticles with Nanopartz Surface Polymer (Nanopartz) were prepared by diluting to 5 µg ml−1 in 100% ethanol and sonicated in a bath sonicator to break up aggregates. This solution was applied to the coverslips at 0.079 µl mm−2 of surface area and allowed to dry. The coverslips were then covered with a borosilicate glass Petri dish and placed into a muffle furnace. The furnace was heated to 600 °C at a rate of 30 °C min−1, held at this temperature for 5 h and then allowed to cool overnight. The coverslips were stored at room temperature until use. Immediately before plating cells, the coverslips were coated with a 1:100 dilution of LDEV-free Matrigel (Corning) in DMEM (Thermo Fisher Scientific).
Cell preparation for structural MINFLUX imaging
PtK2 cells (ATCC, CCL-56) were maintained at 37 °C with 5% CO2 in minimum essential medium (MEM) supplemented with 2 mM GlutaMAX, 25 mM HEPES (Thermo Fisher Scientific), 10% FBS, 1 mM sodium pyruvate (Gibco), 1× MEM non-essential amino acids solution (Gibco) and 100 µg ml−1 penicillin and streptomycin. Cells were authenticated by the supplier by morphological analysis, species verification by isoenzymology, short-tandem-repeat profiling and mycoplasma testing. Cells were further verified to be free of mycoplasma using the using the MycoAlert Mycoplasma Detection Kit (Lonza). The cells were plated onto Matrigel-coated coverslips with embedded gold fiducials, exchanged into a medium containing 250 µM of the click amino acid trans-cyclooct-2-en-l-lysine (axial isomer) (SiChem), and transfected with 1 µg of an equimolar ratio of PIEZO expression plasmid and of the tRNA/tRNA synthetase expression plasmids using TransfeX transfection reagent (ATCC). After 48 h, the cells were washed four times with prewarmed medium in 15 min intervals to remove excess click amino acid. The cells were washed in prewarmed 1× PBS and then fixed in prewarmed 1× PBS containing 0.8% PFA and 0.1% glutaraldehyde for 15 min.
For osmotic stimulation experiments, the cells were washed in 1× PBS and then exposed to a modified Ringer’s solution at 120 mOsm (48.8 mM NaCl, 5 mM KCl, 10 mM HEPES (pH 7.40) and 10 mM D-glucose) or at 480 mOsm (140 mM NaCl, 5 mM KCl, 10 mM HEPES (pH 7.40), 10 mM D-glucose and 190.3 mM mannitol) for 2.5 min at room temperature. The cells were then fixed in the same osmotic solution containing 0.8% PFA and 0.1% glutaraldehyde for 15 min and quenched in 1× PBS containing 25 mM Tris, pH 8.0. The osmolality of all solutions was determined to be ±5 mOsm using a vapour pressure osmometer.
For experiments with cytochalasin D or latrunculin A, a stock solution of 10 mM in DMSO was diluted to 10 µM in prewarmed medium and added to the cells. After incubation at 37 °C for 30 min, the cells were washed and fixed as described above, except each solution, including fixatives, contained 10 µM cytochalasin D or latrunculin A.
After fixation, all of the coverslips were washed in 1× PBS and quenched with 1× PBS + 25 mM Tris pH 8.0 for 10 min. The coverslips were then blocked in 1× PBS + 1% BSA for 10 min, PIEZOs were labelled with a custom DNA PAINT docking strand modified with a 3′ tetrazine (Supplementary Table 1) at 1 µM in blocking solution for 15 min and washed with blocking solution and 1× PBS. After labelling, cells were washed with and mounted in DNA PAINT imaging buffer (1× PBS + 500 mM NaCl + 0.5 mM EDTA) containing an enzymatic oxygen-scavenging system of 3,4-dihydroxybenzoic acid and protocatechuate 3,4-dioxygenase (from Pseudomonas) in addition to the triplet-state quencher Trolox ((+/−)−6-hydroxy-2,5,7,8-tetra-methylchromane-2-carboxylic acid) as described previously56. This imaging solution containing 1–10 nM of a custom, complementary fluorogenic DNA PAINT imaging strand modified with a 5′ ATTO 643 dye and a 3′ IowaBlack fluorescence quencher (Supplementary Table 1). The coverslip was placed onto a glass slide containing a cavity well (Globe Scientific) filled with imaging buffer and was then sealed onto the slide using Elite Double 22 dental epoxy (Zhermack).
Cell preparation for MINFLUX tracking
For tracking single PIEZO ion channels, the cells were transfected and prepared as for structural MINFLUX imaging. After washing away excess click amino acid, the cells were labelled with 0.5–2 nM Janelia Fluor 635-HaloTag ligand (Janelia Materials) in culture medium for 15 min at 37 °C, and then washed several times with fresh medium before incubating the cells for 30 min at 37 °C. This labelling concentration was chosen to obtain sparsely labelled channels conjugated to single dyes with non-overlapping fluorescent puncta. After another wash step, the cells were maintained at 37 °C for up to 4 h before imaging. Immediately before imaging, the cells were exchanged into supplemented culture medium without Phenol Red and mounted and sealed onto a glass slide with a cavity well as described above. The coverslip was imaged for a maximum of 1 h before discarding.
3D MINFLUX imaging
MINFLUX data were acquired on the commercial MINFLUX 3D microscope an Olympus IX83 microscope body (Abberior Instruments) using Imspector software (v.16.3.15645-m2205) with MINFLUX drivers. A ×100 oil-immersion objective lens (UPL SAPO100XO/1.4, Olympus) and a 642-nm excitation laser was used for imaging. Transfected cells were identified by expression of the mNeonGreen fluorescent marker driven by the tRNA/tRNA synthetase plasmid. A field of view around the cell was chosen containing at least three separate embedded gold nanoparticles for active sample stabilization through back-scattering from a 980 nm laser source through a closed control loop, typically resulting in less than 1 nm mean s.d. in the x,y,z axes. A 5–25 µm2 region of interest (ROI) was chosen at the top face of the flat extension of a PtK2 cell. For structural MINFLUX imaging, at least three isolated gold fiducial nanoparticles were chosen for use by the active beamline stabilization system, and the localization error was verified to be less than 5 nm for each fiducial. The sample was imaged using a 5–12% 642-nm laser power, measured to be around 4.30 µW per percent set power at the sample plane. The pinhole diameter was set to be 0.47–0.6 a.u. The total measurement time varied between 5 and 24 h. For MINFLUX tracking, the sample was imaged using 2% 642-nm excitation laser power with a pinhole diameter of 0.8 a.u.
MINFLUX data analysis for 3D structural imaging in fixed cells
For structural MINFLUX imaging, raw final valid localizations from the last targeting iteration of the 3D imaging sequence (Supplementary Table 2) were exported from Imspector as a .mat file. Custom MATLAB analysis software was used to identify and segregate clusters of three localizations essentially as previously described16, with some modifications. All clustering and distance calculations were performed in 3D on xyz coordinates and the reported interblade distances are 3D Euclidean distances. In brief, xyz coordinates were imported, and a 0.7 correction factor was applied to z coordinates to correct for refractive index mismatch. To remove poorly localized molecules, data were filtered so that each trace contained over 10–20 localizations, and we required a raw s.d. per dimension of less than 10–20 nm, much larger than the median localization precision. A z threshold was applied manually based on the apparent plane of the plasma membrane isolate those molecules at or near the membrane. An effective photon frequency at offset (EFO) threshold was applied between 120,000 and 150,000 depending on the first peak of photon emission frequency to remove localizations that might come from multiple fluorescent emitters. The data were then processed using a density-based clustering algorithm that uses two-step DBSCAN clustering followed by an expectation maximization Gaussian mixture model (GMM) fit to assign the 3D position of fluorophores, as previously described16,57. All data were analysed using the same parameters so that fair comparisons can be drawn between conditions. The first DBSCAN step was used to preassign localizations, and to identify and remove noise. The DBSCAN parameters in this first step were set to an epsilon of 10 nm and required five neighbours for a core point. The second DBSCAN step was set to epsilon = 7 nm and a minimum of 5 points. The initial GMM fit sigma was set to 5 nm, approximately equal to the localization error. The fluorophore centre positions were estimated as the mean values of the GMM fit, and the error was determined as the s.d. of the localizations within a cluster. After this clustering, an error threshold of 10 nm removed any poorly localized positions. We identified PIEZO trimers as clusters of three fluorophore positions that were isolated from all other detected fluorophore positions by more than 60 nm by subjecting identified molecular positions to DBSCAN clustering with epsilon = 60 nm and 3 minimum points. Next, a nearest-neighbour analysis required each point to have 2 neighbours between 6 and 60 nm, a window that spans the maximum expected range of interblade separations from available PIEZO cryo-EM structures. Clusters of three localizations passing each step was segmented and the average 3D interblade distance was calculated directly from the assigned molecular positions. As interblade distances are computed in 3D, the random orientation of individual channels relative to the imaging axes only rotates the trimer in space and does not bias the distribution of interblade distances. To verify the accuracy of our clustering algorithm in assigning molecular positions, we calculated the mean position of each trace after EFO thresholding and reanalysed the data using the same density-based clustering algorithm, with minpts set to 1 in both steps. Example data are shown in Extended Data Fig. 2c. Variability between replicates was assessed using a Kruskal–Wallis test with Dunn’s post hoc test (Supplementary Table 1).
MINFLUX data analysis for 3D tracking in live cells
For MINFLUX tracking experiments, raw valid localizations from the final targeting iteration of the 3D tracking sequence (Supplementary Table 3) were exported from Imspector as .mat files, imported into MATLAB and analysed using custom MATLAB analysis code to analyse tracks and obtain diffusion coefficients. For each localization, we used the x, y and z coordinates, the trace identifier, the time stamps and the EFO. A 0.7 refractive index correction factor was applied to z values. Localizations were grouped by trace ID to isolate individual trajectories. To ensure robust MSD estimation from well-localized single emitters, tracks were prefiltered using empirical thresholds that were kept fixed across all conditions. A maximum EFO cut-off of 130,000 was applied. The EFO cut-off ensured that only single dyes were imaged, as the photon emission frequency peak of a single dye was determined to be around 75 kHz, and we observed a second emission peak at approximately twice the single-dye emission frequency (~150 kHz) corresponding to two dyes, as described in a previous report that similarly used 3D MINFLUX tracking and an under-labelling strategy58 (Extended Data Fig. 5a,b). A maximum allowed time gap of 18 ms between successive localizations was imposed, and any trajectory was truncated at the first gap exceeding this threshold, preventing artificial linking of positions across long dark periods. Trajectories were required to have greater than 200 localizations per trajectory so that the MSD could be computed over a sufficiently long timescale.
For each filtered trajectory, we calculated the MSD of the PIEZO molecules undergoing diffusion in three dimensions as a function of lag time τ with a weighted linear model MSD(τ) = 6Dτ. All MSDs and diffusion coefficients were calculated from 3D displacements. Although the confinement of PIEZO channels to the plasma membrane means that z excursions are small, all motion is explicitly included. Microscopic diffusion coefficients were obtained for each trajectory by fitting MSD(τ) over 5–50 ms. This window was chosen because, at this timescale, the channel will tend not to interact with diffusional barriers created by membrane–cytoskeletal interactions36. Macroscopic diffusion coefficients were obtained using the same model from 50–350 ms. To obtain ensemble diffusion coefficients, all accepted trajectories were pooled, binned into 50 linearly spaced lag-time bins between 0 and 350 ms, and a weighted mean and s.e.m. were computed for each bin using the number of displacement pairs as weights. The ensemble MSD curve was then fit with a weighted linear MSD model. For visualization only (Fig. 2h and Extended Data Fig. 7), accepted 3D trajectories were centred on their centre of mass and the first 1 s of motion was overlaid.
Electrophysiology analysis of heterologous cells
Cells were transfected with 1 µg DNA 48 h before measurements and plated onto 12-mm poly-D-lysine-coated glass coverslips (Corning, 354086) before recordings. Transfected cells were identified by fluorescence. Whole-cell currents were recorded using a Multiclamp 700A amplifier, Digidata 1550B digitizer and pClamp10.7 software (all from Molecular Devices). To record indentation-evoked currents, data were sampled at 20 kHz and low-pass filtered at 10 kHz. Patch pipette electrodes were pulled using borosilicate glass (34BF150-86-10, Sutter Instruments) and had a resistance of 3–5 MΩ when filled with the pipette solution (see below). The standard extracellular recording solution contained 135 mM NaCl, 3 mM KCl, 1 mM MgCl2, 2.5 mM CaCl2, 10 mM D-glucose, 10 mM HEPES (pH 7.3 with NaOH; 300 ± 5 mOsm was adjusted with D-mannitol). The pipette solution contained 133 mM CsCl, 5 mM EGTA, 1 mM MgCl2, 1 mM CaCl2, 10 mM HEPES, 4 mM Mg-ATP, 0.4 mM Na2-GTP (pH 7.3 with CsOH; 294 ± 2 mOsm). Cells were mechanically stimulated for 145 ms at a holding potential of −80 mV, using a glass probe heat-polished to a 3–4-μm diameter (34B150-86-10, Sutter Instruments) and driven by a piezoelectric controller and actuator (E625 LVPZT Controller/Amplifier; Physik Instrumente) attached to the micromanipulator with a custom dye-anodized aluminium adapter. The probe was positioned at an 80° angle. The probe was initially positioned at about 2–4 mm from the cell and advanced at 0.5 µm ms−1 in 0.5 µm increments. The interstimulus intervals were 20 s. The maximum current (Imax) was identified from the family of peak current responses to increased membrane indentation. Cells with high access resistance (>20 MΩ) or low seal resistance (<1 GΩ) were excluded from data analysis. Cells that changed their morphology during repetitive poke stimulation were also excluded from data analysis. No series resistance compensation was applied.
To record cell swelling- and shrinking-induced currents, cells were perfused at a rate of 3–4 ml min−1 with an iso-osmotic solution containing 45 mM NaCl, 2.4 mM KCl, 1 mM MgCl2, 2 mM CaCl2, 10 mM D-glucose, 10 mM HEPES (pH 7.3 with NaOH; 300 ± 5 mOsm was adjusted with D-mannitol) using the VC-6 valve control system (Warner Instruments). The hypo-osmotic and hyper-osmotic solutions had the same composition, but mannitol was omitted in the hypo-osmotic solution (125 ± 5 mOsm), and the osmolarity of the hyper-osmotic solution was adjusted to 400 mOsm with mannitol. The pipette solution was identical to that described in the previous paragraph. The whole-cell currents were elicited by voltage ramps from −80 mV to 80 mV from the holding potential of −40 mV; the voltage ramps were applied at 0.1 Hz and with a 1 s duration. The interstimulus interval was 20 s. The cell membrane capacitance was estimated using the membrane test of pClamp 10.7, and the amplitude values of recorded current were normalized to the membrane capacitance to obtain the current density. The current–voltage relationship was reconstructed by plotting the current density versus the test voltage. Whole-cell currents were sampled at 10 kHz and low-pass filtered at 2 kHz. All patch-clamp experiments were conducted at the room temperature (20–23 °C). Swelling- or shrinking-induced currents were obtained by subtracting the currents recorded before application of either hypo- or hyper-osmotic solution, respectively, from the maximum current recorded during perfusion with the corresponding solution. Cells that developed membrane blebs during hypo-osmotic challenge were excluded from data analysis.
Cross-linking MS
Expi293 cells (Thermo Fisher Scientific) were maintained at 37 °C with 8% CO2 in Expi293 medium, shaking at 125 rpm on a rotator with a 19-mm orbit diameter, and were verified to be free of mycoplasma using the using the MycoAlert Mycoplasma Detection Kit (Lonza). Cells were authenticated by the supplier for post-thaw viability, mycoplasma testing and sterility. The cells were cultured to a density of 4 × 10⁶ cells per ml, exchanged into fresh medium containing 250–500 µM of the click amino acid trans-cyclooct-2-en-l-lysine (axial isomer) (SiChem), and three separate flasks were transfected with a 1:1 ratio of (1) PIEZO2 plasmid and tRNA/synthetase expression vector; (2) PIEZO2(ΔIDR5) and tRNA/synthetase expression vector, each using EndoFectin Expi293 transfection reagent (GeneCopeia); or (3) were not transfected. After 48 h of expression, the cells were washed three times at 15-min intervals with medium to wash out excess click amino acid. On the final wash, the cells were resuspended in 10 ml of medium supplemented with 1% BSA and blocked for 5 min. Tetrazine-PEG4-Biotin (Thermo Fisher Scientific) was added to a final concentration of 4 µM and allowed to react for 15 min with occasional mixing. After washing twice in BSA-supplemented medium, the cells were washed with HBSS with 20 mM HEPES pH 8.0. On the final wash, the cells were resuspended in HBSS + 20 mM HEPES pH 8.0 + 1 mM DSP dithiobis(succinimidylpropionate) cross-linker and incubated for 30 min at room temperature with occasional mixing. The reaction was quenched by adding 200 µl of 1 M Tris pH 8.0 and incubating for 15 min with occasional mixing. The cells were next pelleted by centrifugation, solubilized in ice-cold 25 mM HEPES (pH 7.4), 0.15 M NaCl, 1% C12E9, 0.1% GDN, 1× HALT protease inhibitor and rotated at 4 °C for 1 h. Insoluble cell debris was pelleted at 40,000g for 10 min, and the supernatant was kept on ice. The solubilized proteins were next processed for tandem affinity purification. First, biotinylated proteins were isolated using Pierce Monomeric Avidin Agarose on a polyprep column according to the manufacturer’s instructions using a wash buffer (25 mM HEPES (pH 7.4), 0.15 M NaCl, 0.1% C12E9) and eluted with wash buffer containing 2 mM D-biotin. Next, Halo-Tagged proteins were isolated using Magne HaloTag Beads (Promega). After immobilizing for 90 min at room temperature, the beads were washed with RIPA buffer to remove non-specifically bound protein. Cross-linked proteins were released from covalently immobilized Halo-tagged PIEZO molecules using RIPA buffer + 30 mM dithiothreitol at 50 °C for 15 min. The eluate was collected and stored on ice. Eluted proteins were run on a 4–20% polyacrylamide gels with Tris-Glycine buffer for 1 h and silver stained for visualization. For proteomics MS, the proteins were run on the same gel for 20 min and stained with SimplyBlue Safe Stain (Coomassie G-250) (Thermo Fisher Scientific). The lane was cut out from just below the well to ~10 kDa and submitted for nano-flow liquid chromatography coupled with tandem MS (nano-LC–MS/MS) analysis at the Scripps Research Center for Metabolomics and Mass Spectrometry. In brief, the gel was destained, and the proteins were denatured, reduced and alkylated before digestion with trypsin overnight. The peptides were analysed by nano-LC–MS/MS, and the data were searched against the predicted fragment ions from the trypsin digestion of human proteins using the proteomics search engine Mascot (Matrix Science Limited). The analysed results contained proteins identified at the 95% confidence interval. Protein identifiers were cross-referenced against the UniProt database, and each protein ID was appended with an exponentially modified protein abundance index (emPAI). Proteins that were detected in untransfected cells were determined to be background and removed from the PIEZO2 and PIEZO2(ΔIDR5) datasets.
siRNA-mediated knockdown of candidate scaffolding proteins
SWELL1-KO HEK293 cells16,59 were maintained in Freestyle 293 medium (Thermo Fisher Scientific) at 37 °C with 8% CO2, shaking at 125 RPM on a rotator with a 19-mm orbit diameter, and were verified to be free of mycoplasma using the using the MycoAlert Mycoplasma Detection Kit (Lonza). Before transfection, 3 ml of cells were grown in a 30 mm diameter uncoated Petri dish to a density of 1 × 10⁶ cells per ml. Then, 1.5 µg of mPiezo2-IRES-mNG was co-transfected with 2 µl of a 40 µM stock (80 pmol total) of ON-TARGETplus SMARTpool siRNAs (Dharmacon) targeted against the mRNAs of candidate scaffolding proteins using EndoFectin Expi293 transfection reagent (GeneCopeia). After 48 h, cells were plated onto 10 mm poly-D-lysine-coated coverslips, allowed to settle for 1 h, and assessed using patch-clamp electrophysiology.
Clonal FLNB-KO cells
Clonal FLNB-KO cells were created using SWELL1-KO HEK293 cells16,59 using the EditCo Bio Gene Knockout Kit. SWELL1-KO cells were authenticated as previously described: successful KO of SWELL1 genes was determined by PCR genotyping and Sanger sequencing targeted regions for frameshift mutations, and verified by MS analysis16,59. Three sgRNAs were designed against exon 8 of the human FLNB gene (NCBI: NM_001164317.2). The sgRNAs were precomplexed with spCas9-2NLS (Synthego) and 1.5 × 10⁶ cells were nucleofected using a Lonza 4D Nucleofector System, the P3 Primary Cell Kit S and a nucleocuvette strip (Lonza) using the default HEK293 electroporation program. Cells were recovered for 10 min in Freestyle 293 medium (Thermo Fisher Scientific) and then grown for 3 days with shaking at 125 rpm. Single cells were isolated using a Propel Bigfoot flow cytometer (Thermo Fisher Scientific) at the Scripps Research Flow Cytometry Core in the wells of three 96-well plates containing DMEM + 10% FBS + 1× penicillin–streptomycin and grown for 3 weeks at 37 °C, 5% CO2 to form clonal colonies. After visible colonies were formed, cells were dissociated using Tryple Express (Thermo Fisher Scientific), quenched with DMEM + 10% FBS, and 50% of the dissociated mixture was plated into a single well of a 12-well plate to expand further. Meanwhile, the remaining mixture (containing around 300,000 cells) was centrifuged and genomic DNA was isolated using the QuickExtract DNA Extraction Solution (BioSearch Technologies). A 1.245 kb fragment of genomic DNA from each colony was amplified using two PCR primers using Q5 DNA Polymerase (NEB), isolated with a PCR purification column (Zymo Research) and Sanger sequenced using a nested sequencing primer (Genewiz). Sequencing traces were analysed using the EditCo ICE analysis tool. A single SWELL1-KO/FLNB-KO clone was chosen that contained a homozygous deletion of 52 bp in exon 8 of FLNB (chromosome 3: 58098750–58098801 of the GRCh38/hg38 reference assembly), resulting in a frameshift. The clone was expanded and maintained in adherent culture in DMEM + 10% FBS + 1× penicillin–streptomycin in an incubator at 37 °C, 5% CO2.
Flnb knockdown in PtK2 cells
Four arrayed Dicer-substrate interfering RNAs (DsiRNAs) (IDT) were designed against the P. tridactylus Flnb sequence (Supplementary Table 1) using the published PtK2 cell transcriptome as a guide42. A commercial non-targeting dsiRNA was included as a control (IDT 51-01-19-08). PtK2 cells were plated into a six-well plate containing 3 ml of medium 1–3 h before transfection. Each well was transfected with 20 pmol of each of the 4 dsiRNAs in 300 µl Optimem with 7.5 µl TransfeX transfection reagent (ATCC). After 48 h, the cells were split and plated onto Matrigel-coated coverslips with embedded gold fiducials, exchanged into a medium containing 250 µM of the click amino acid trans-cyclooct-2-en-l-lysine (axial isomer) (SiChem) and transfected a second time with identical amounts of dsiRNA, with the addition of 1.5 µg of an equimolar ratio of the mPiezo2 and the tRNA/tRNA synthetase expression plasmids. The cells were allowed to express for an additional 48 h and then prepared for MINFLUX imaging as described above. Knockdown efficiency was verified using qPCR.
Mice
All experiments were performed under the policies and recommendations of the International Association for the Study of Pain and approved by the Scripps Research Animal Care and Use Committee. Mice were kept in standard housing under a 12 h–12 h light–dark cycle at 22 °C with humidity between 30% and 80% (not controlled). Mice were kept on pelleted paper bedding and provided with paper square nestlets and polyvinyl chloride pipe enrichment with ad libitum access to food and water. PCR genotyping was performed from tail snip DNA samples using Transnetyx. All mice received metal identification tags on their ears at 18–30 days old. After weaning (21–30 days old), mice were co-housed in groups of 2–5 littermates of the same sex. Animal sample sizes were based on similar studies in the literature6,60.
Immunohistochemical co-localization of PIEZO2–smFlag and FLNB in mouse skin
Two male Piezo2smFP-Flag/smFP-Flag mice60 (Piezo2em1.1Ddg/J, CD-1 genetic background, Jackson Laboratories, 039935, a gift from D. Ginty, one at 2.5 weeks of age and one at 4 weeks of age) and two male CD-1 mice (one at 6 weeks of age and one at 4 weeks of age) were used for hairy skin immunohistochemistry60. One 4-week-old male Piezo2smFP-Flag/smFP-Flag mouse and one 4-week-old CD-1 control mouse were used for glabrous skin immunohistochemistry. In brief, mice were euthanized with isoflurane and killed by cervical dislocation. The dorsal surface of the mouse was dehaired with depilatory cream (Nair Cocoa Butter) for 3 min, the skin was thoroughly rinsed with industrial water and gentle manual massaging for 30 s and patted dry with paper towels. The dorsal back skin was rapidly collected, the epidermis was pinned down onto Styrofoam and scraped with a surgical scalpel to remove subcutaneous fat, taking care to note the rostrocaudal axis. The plantar (glabrous) surface of the hind paw, not including the digit tips, was collected using spring scissors, with the underlying tissues removed. White cardstock was pressed onto the dermis to flatten the samples, and the dorsal back skin was trimmed to approximately 1 × 1 cm. Skin samples were drop-fixed in freshly prepared and prechilled 1% paraformaldehyde in PBS pH 7.4 for 2 h on ice. Skin samples were rinsed twice in cold PBS, then transferred into ice-cold 30% sucrose in PBS and incubated for 18 h at 4 °C until the tissues sank. The samples were briefly washed in ice-cold OCT medium (Sakura Finetech, 4583) and embedded in OCT medium in cryomolds (with the cardstock) on crushed dry ice. All tissues were sectioned dermis-first at 25 µm at −20 °C onto gelatin-coated slides (FD NeuroTechnololgies, PO101). Hairy skin was sectioned normal to the rostrocaudal axis, and glabrous skin was sectioned normal to the proximodistal axis, beginning with the distal portion. Slides were air-dried at room temperature for 1 h and a hydrophobic barrier was drawn (ImmEdge Vector Laboratories H-4000) around the tissue sections. The slides were rehydrated in 200 ml PBS to remove OCT and cardstock and, from then on, all washes were performed with a volume of 40 ml. All washes were performed for 10 min. The samples were washed in PBS and then blocked for 2 h at room temperature in 5% normal goat serum (Life Technologies, PCN5000) in 0.1% PBST. Block was aspirated and primary antibody was applied as follows in blocking buffer for 48 h at 4 °C: 1:500 polyclonal guinea pig anti-Flag60 (a gift from D. Ginty), 1:500 polyclonal rabbit anti-FLNB (Thermo Fisher Scientific, PA5-52098) and 1:1,000 polyclonal chicken anti-NFH (Abcam, ab4680). The slides were washed three times in PBST followed by PBS and incubated in the following highly cross-adsorbed secondary antibodies for 24 h at 4 °C: for confocal imaging: 1:2,000 goat anti-guinea pig Alexa Fluor 594 (Life Technologies, A11076), 1:2,000 goat anti-rabbit Alexa Fluor 647 (Life Technologies, A21245), 1:2,000 goat anti-chicken Alexa Fluor 488 (Life Technologies, A32931); for STED imaging: 1:2,000 goat anti-guinea pig STAR RED (Abberior, STRED-1006), 1:750 goat anti-rabbit STAR ORANGE (Abberior, STORANGE-1002). A no-primary control was always performed. The slides were washed three times in 0.1% PBST, then PBS, and then mounted in SlowFade Diamond (Life Technologies, S36967). The slides were sealed with nail polish, dried for 2 h, stored at 4 °C, and imaged on the Nikon AX confocal microscope or Abberior Instruments Facility Line 3D STED microscope.
smFISH
Mouse dorsal root ganglia were dissected fresh from two adult C57BL6/J male mice, embedded in optimal cutting temperature compound (OCT, Sakura), and flash-frozen in liquid nitrogen. The protocols for the RNAscope Multiplex Fluorescent Reagent Kit V2 (ACDBio, 323100) and tyramide signal amplification dyes (Perkin Elmer) were followed exactly according to the manufacturers’ instructions. Protease IV was applied for 22 min. Probes (all from ACDBio) for mouse Flnb (572481), Ntrk2 (423611-C2), Ntrk3 (423621-C2) and Piezo2 (400191-C3) were applied to detect transcript. Slides were imaged on a Nikon AX confocal microscope using a ×16 water-immersion objective with Nyquist zoom. Cell borders were drawn around highly expressed marker transcript (Ntrk2 and Ntrk3) signals to define individual cells.
Confocal imaging and data analysis
Images were acquired on the Nikon AX confocal microscope with NIS Elements software and the image settings (laser power, gain, resolution, pixel dwell time, objective and pixel dimension settings) were kept the same for all conditions. Meissner corpuscles were imaged with a Nikon ×60/1.4 NA oil-immersion objective and hair follicle lanceolates were imaged with a Nikon ×100/1.42 NA oil-immersion objective. Images were analysed in Fiji. For all images, the brightness and contrast adjustments were applied uniformly to the entire image.
STED imaging and data analysis
STED imaging was performed on an Abberior Instruments Facility Line 3D STED microscope on an Olympus IX83 microscope body. The excitation lasers and STED depletion lasers were autoaligned with a fluorescent bead fiducial sample. The samples were imaged in 2D mode with a ×60/1.42 NA oil-immersion Olympus objective with 561 and 640 nm excitation lasers with a 775 nm depletion laser with fluorescent lifetime imaging (TIMEBOW) enabled for all of the experiments. All of the images were acquired with identical excitation power, STED depletion power, pinhole diameter and line accumulations so that the fluorescence intensities were comparable across samples. STED images were acquired at 20 nm per pixel. Co-registered confocal and STED images were acquired in two channels (STAR RED for PIEZO2-smFlag, STAR ORANGE for FLNB) for each field of view. Single-label controls were used to confirm detection bandwidths and verify negligible bleed-through between channels. STED data were analysed and deconvolved in Lightbox 2025 software (v.2024.48.21878-gc86bbd647c) using lifetime-based PHASOR deconvolution. Deconvolution was used to improve lateral resolution and signal-to-noise. The deconvolution model incorporated the refractive index of the mounting medium (1.420), the measured axial distance from the coverslip to correct for depth-dependent point spread function changes and the lifetime information from the dyes, which helps to distinguish fluorophore signal from the background compared with intensity-only deconvolution. All images were processed with the same deconvolution and background subtraction parameters. In the Lightbox program, deconvolution parameters were set to 50 iterations and a sharpness value of 10, and PHASOR background weights of 1.50 were applied to the STAR RED and STAR ORANGE channels. The background was removed using a rolling-ball subtraction (kernel size = 20, weight = 1.0). These values were empirically chosen to yield stable FWHM values of approximately 60–80 nm without oversharpening or ringing artifacts.
The deconvolved images were exported to Fiji (v.2.16.0/1.54p) for segmentation and co-localization analysis. To restrict measurements to individual lanceolate endings, we generated a binary mask from the confocal STAR RED channel, which provides a continuous representation of PIEZO2-positive lanceolate endings (Extended Data Fig. 9e). The confocal STAR RED (PIEZO2-smFlag) image was Gaussian blurred with a radius of 10 pixels to smooth local intensity fluctuations and then thresholded using a fixed intensity threshold applied identically to all images. This value was chosen from the intensity histograms to include lanceolate signal and exclude background. The FLNB channel was hidden during ROI generation to avoid bias. These ROIs were applied to the deconvolved STED images of both channels. Within each lanceolate ROI, co-localization between PIEZO2-smFlag and FLNB was quantified on the deconvolved STED images by pixel intensity correlation using the Coloc2 plugin in Fiji with a point-spread-function diameter of 4.0 pixels, chosen based on the measured STED FWHM. No additional intensity thresholds were applied within the ROIs. We report Pearson’s correlation coefficient r and Spearman’s rank correlation coefficient ρ per lanceolate ending. FWHM was measured from the deconvolved STED images in Fiji using the ‘fwhm_on_spots’ jython-fiji macro (https://github.com/sommerc/spots_fwhm).
DRG neurons
Isolation and culture of mouse DRG neurons from wild type C57BL/6J mice aged 3–5 months were performed as previously described1,6. In brief, DRGs were dissected and incubated for 1 h at 37 °C in serum-free medium containing 1.25% collagenase IV (Life Technologies), followed by incubation with 1 U ml−1 papain (Thermo Fisher Scientific) for 30 min at 37 °C. Cells were then triturated and transferred into complete growth medium (Ham’s F12/DMEM + 10% FBS supplemented with the following growth factors (from Gibco): 50 ng ml−1 GDNF, 100 ng ml−1 NGF, 50 ng ml−1 NT-4, 50 ng ml−1 NT-3, 50 ng ml−1 BDNF and 10 µM cytosine arabinoside (AraC)) and plated onto laminin-coated poly-D-lysine coverslips (Corning). Cells were allowed to adhere for 1–2 h before the addition of extra complete medium. For DsiRNA knockdown experiments, cells were nucleofected using the Amaxa P3 Primary Cell 4D-Nucleofector X Kit S (Lonza) as previously described1,8. Four arrayed DsiRNAs (IDT) designed against mouse Flnb mRNA were used to knockdown Flnb and a non-targeting dsiRNA was included as a control (IDT 51-01-19-08). In total, 120 pmol of DsiRNA and 400 ng of pmaxGFP vector (Lonza) were nucleofected per reaction. After nucleofection, cells were allowed to recover in serum-free medium for 10 min at 37 °C and then plated with complete medium containing growth factors, except without the addition of AraC. Cells were allowed to adhere for 1–2 h before the addition of extra complete medium. Measurement of swelling-induced current was performed as described for heterologous cells, except the extracellular solution contained 30 µM DCPIB to block SWELL1-mediated chloride currents. Patch-clamp recordings were performed on the fourth and fifth day after nucleofection. Only large-diameter cells (>70 µm) with neuronal morphology were patched. The extracellular iso-osmotic and hypo-osmotic solutions, intracellular recording solution and other conditions were identical to those used for heterologous expression experiments (see above), with the exception that cells were patched in the standard extracellular recording solution followed by perfusion with DCPIB (30 µM)-containing iso-osmotic solution for at least 5 min before 2 min perfusion with the hypo-osmotic solution (also containing 30 µM DCPIB). The holding potential between voltage ramps was −40 mV. Cells that exhibited a sudden increase in current of several hundred pA or several nA after the application of hypotonic solution, without recovering after reintroduction to the iso-osmotic solution, were excluded from data analysis due to the potential compromise of the gigaseal stability or plasma membrane integrity during cell swelling.
Structural models
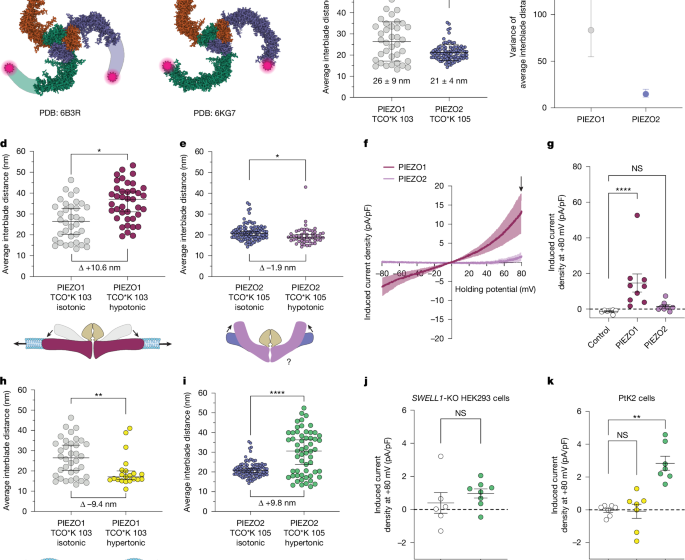
Structural models from single-particle cryo-EM for PIEZO1 (6B3R) and PIEZO2 (6KG7) were obtained from the Protein Data Bank (PDB). The PIEZO2 cryo-EM structure lacks the extracellular loop containing the tagging location at amino acid 105, so an AlphaFold III model was generated for a monomer of mouse PIEZO2, and the last PIEZO repeat domain was superposed onto the equivalent domain of the 6KG7 cryo-EM structure in UCSF Chimera software. Interblade distances were measured using amino acid Gln105 of this model.
Data visualization and statistical tests
Data were visualized and statistical tests performed in MATLAB (MathWorks) and Prism (GraphPad) software. Molecular structures were visualized in MolStar Viewer (https://molstar.org/viewer/) and Chimera (UCSF) software. DNA and mRNA sequences were designed and analysed in SnapGene analysis software (Dotmatics).
Reporting summary
Further information on research design is available in the Nature Portfolio Reporting Summary linked to this article.
First Appeared on
Source link

