Unraveling the genetic landscape and admixture dynamics of urban populations across Peru
Ethical approval and informed consent
All study procedures were reviewed and approved by the Peruvian Research and Ethics Committee of the Instituto Nacional de Salud (authorization no. OI-003-11 and OI-087-13). The ethical framework for the collection, stewardship, and analysis of samples was implemented in accordance with international and national standards, including the Declaration of Helsinki. All participants provided written informed consent in the presence of a translator (when needed) and two local witnesses. Participants were explicitly informed of their right to withdraw at any time without explanation. All ethical regulations relevant to human research participants were followed.
Ethics & Inclusion statement
This research was conceived by researchers from the Peruvian National Institute of Health (INS, by its Spanish acronym) and conducted in collaboration with researchers from the University of Maryland and the Universidade Federal de Minas Gerais. INS researchers led the study design and implementation, collected the samples, performed the genotyping, and participated in all stages of data analysis. As noted above, the study was approved by a local ethics review committee. This research does not result in stigmatization, incrimination, discrimination, or any other personal risk to participants. No benefit-sharing measures were discussed, as no biological materials, cultural artefacts, or associated traditional knowledge were transferred outside the country. Finally, local and regional research was integral to the analysis and interpretation of the study findings.
Sampling, genotyping, and quality control
Thirteen populations were sampled in 2010. All details related to sampling were described elsewhere30.
Samples were genotyped using the Illumina Omni2.5 M array in several batches at the Instituto Nacional de Salud (Peruvian National Institute of Health) facilities. We exported raw data to PLINK format using GenomeStudio. We used PLINK1.969 to perform all quality control steps for autosomes and chromosome X. The quality control process at the single-nucleotide variant (SNV) level included: Exclusion of variants with no chromosome information, exclusion of AT/CG genotypes, exclusion of variants with 100% heterozygous, and SNVs out of the Hardy-Weinberg equilibrium (HWE) (threshold 10e-6).
Some batches were genotyped using GRch37. For these batches, liftover to GRch38 was performed using the UCSC liftover tool (https://genome.ucsc.edu/cgi-bin/hgLiftOver) before merging with other GRch38 batches. After merging, we filtered for SNPs and individuals accumulating more than 5% of missing data using PLINK (–geno 0.05 and mind 0.05).
We controlled for relatedness using the KING algorithm70 to identify duplicates and individuals with first- and second-degree relationships. We ran the KING algorithm in the SNPRelate package71 using the snpgdsIBDKING function. To decide which individuals should be removed after relatedness analyses, we used NATORA72. This admixed genotyped data was merged with Peruvian Indigenous American data previously reported9,10 to build the PGP dataset that included 749 individuals (Admixed and Indigenous American Peruvians) and 1,933,621 SNVs.
Phasing
We set the reference allele to the GRCh38 reference allele using the GRCh38_full_analysis_set_plus_decoy_hla.fa file and PLINK. Following this, we phased PGP data using shapeit473 (https://github.com/odelaneau/shapeit4/tree/master) with a reference panel that includes the full 1KGP High coverage31 (n = 3199 individuals) and HGDP data32(n = 827 individuals). To improve phasing quality, we set the mcmc iterations parameters to 10b,1p,1b,1p,1b,1p,1b,1p,10 m. After phasing, we merged Phased PGP with 1KGP and HGDP. Also, we removed multiallelic variants and AT/CG genotypes. Finally, our combined dataset included 4775 individuals, 1,461,568 autosomal SNVs, and 25,418 chromosome X SNVs.
Population structure analyses
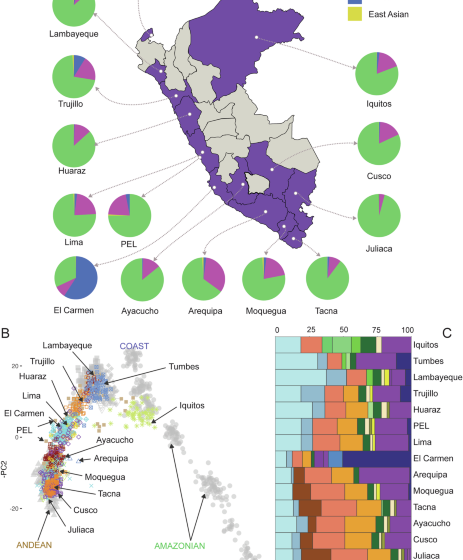
We used allele frequency–based methods i.e., principal component analysis [PCA] and genetic clustering to explore population structure in our combined dataset. We chose PCA because it provides a model-free, widely used approach for visualizing major axes of genetic variation and identifying patterns of similarity among our samples and reference populations. Genetic clustering analysis (e.g., ADMIXTURE analyses33) complements PCA by estimating individual ancestry proportions related to the reference population, allowing finer-scale assessment of population structure. In this sense, genetic ancestry was defined based on the proportional similarity between our samples and continental-level reference populations (i.e., African, European, East Asian, and Indigenous American groups). This approach provides a broad-scale framework suitable for characterizing urban populations with complex admixture histories.
Both methods require for unlinked variants. We generated a list of unlinked variants using the SNPRelate snpgdsLDpruning function with a maximum base pair of 1 Mb for the sliding window, a correlation method to calculate LD values, and a threshold of 0.1. With KING relatedness inference and the unlinked SNP list, we ran PCAir74 with a minor allele frequency (MAF) threshold of 5%, kinship threshold of 0.044194, and divergence threshold of -0.044194.
To explore genome-wide ancestry proportions, we ran ADMIXTURE33 from K = 3 to K = 10 in a subset of individuals that includes Full PGP data (admixed and Native Americans), a subset of 1KGP high coverage populations with unrelated individuals (TSI, IBS, CEU, PEL, CLM, MXL, PUR, LWK, MSL, YRI, GWD, JPT, CHB, and CHS), and Native Americans from HGDP (Colombian, Pima, and Maya populations). This subset included unlinked SNVs, and an MAF filter of 5%. We performed ten runs per K value and plotted the run with the highest log-likelihood. To explore differentiation among urban populations, we ran Fst analysis on PLINK using the Weir and Cockerham estimator75.
Identity-by-descent and local ancestry inferences
We removed SNVs with MAF < 0.001 of the full phased data and inferred identity-by-descent (IBD) segments using hap-ibd76 with default parameters. After IBD inference, we ran the merge-ibd-segments software (https://faculty.washington.edu/browning/refined-ibd/merge-ibd-segments.17Jan20.102.jar) to remove gaps between IBD segments. We kept IBD segments greater than 3 cM for subsequent analyses and removed ROH segments.
We performed local ancestry to infer the continental ancestry at the chromosomal level. For this purpose, we ran GNOMIX77 with four continental references based on ADMIXTURE results (Population Structure analyses section). We selected European (n = 404 individuals; Populations: CEU, GBR, IBS, and TSI), African (n = 405 individuals; Populations: YRI, MSL, GWD, and LWK), and East Asian (n = 411 individuals; Populations: CHB, CHS, JPT, and KHV) individuals from 1KGP populations (Supplementary Data 3). Native American reference included 187 individuals from PGP with more than 99% NAT ancestry based on ADMIXTURE K4 results. We ran GNOMIX using the option “best” for model inference parameters. This option uses a random string kernel base + xgboost smoother and is recommended for array data. We also include the rephasing option to correct the phase inference based on local ancestry information.
We ran ancestry-specific PCA (asPCA) to explore the similarity between chromosomal ancestry segments of PGP individuals to specific continental ancestral references using the Browning et al. pipeline35 (http://faculty.washington.edu/sguy/local_ancestry_pipeline/). Before running the asPCA, we convert msp GNOMIX output to viterbi output since the pipeline was designed for rfmix ver1 outputs. The msp output includes ancestry information for loci in each pair of haplotypes. Considering a 4-way admixture, we created an ancestry-specific msp file setting as missing the other three ancestries. To perform asPCA, we kept individuals with a minimum of 30% for European or African ancestry. For East Asian ancestry, we kept individuals with a minimum of 5%.
Admixture dynamics analyses
We explored admixture dynamics in Peruvians by analyzing different evolutionary aspects: (1) admixture timing and mode, (2) recent migration explored by IBD sharing, (3) demographic changes identified by the evolution of effective population size (Ne), and (4) Sex-bias admixture analyses.
First, to analyze the admixture timing and mode, we ran GLOBETROTTER and HierarchyMix to explore admixture timing and mode.
To run GLOBETROTTER, we first ran ChromoPainter-based methods4,36,40 to identify the timing and mode for admixture events. This analysis requires several steps: (i) inference of scaling parameters [recombination and mutation rates], (ii) inference of haplotype sharing (copyvectors and painting samples), (iii) inference of ancestry proportions using haplotype information, and (iv) inference of admixture date and mode. We excluded two Native American populations, Quechuas and Aimaras (Supplementary Data 2), as both carry a substantial proportion of European ancestry. Their inclusion led to a marked reduction in inferred European ancestry compared to ADMIXTURE results. Similarly, we excluded Xibo and Uygur, as they contributed unreliable estimates of Asian ancestry.
Inference of scaling parameters
We ran ChromoPainter version 2 to determine scaling parameters for haplotype sharing inference. For this purpose, we performed a first ChromoPainter run in a subset of chromosomes (1,8,15,22) and a subset of individuals to calculate the scaling parameters.
Inference of haplotype sharing
After calculating the scaling parameters, we set these values in two ChromoPainter runs including all individuals and chromosomes to generate two types of files: copyvectors and painting samples. Our second Chromopainter was to infer copyvectors, we set the parameter -f to select the donors and recipients. We selected all populations as recipients but just Indigenous Americans, European, African, and Asian populations as donors (Supplementary Data 2). Our third Chromopainter run was to infer painting samples, we set the -f mode setting admixed Peruvians as recipients and all other populations as donors.
Ancestry proportions at the subcontinental level
After ChromoPainter runs, we merged copyvectors into one coancestry matrix using the neaverage perl script (https://people.maths.bris.ac.uk/~madjl/finestructure/neaverage.pl.zip) and ran SOURCEFIND4 ver2 (https://github.com/hellenthal-group-UCL/sourcefindV2) to identify ancestry proportions corresponding to donor populations. SOURCEFIND is a Bayesian approach that explores haplotype sharing between donor individuals and recipients to determine ancestry proportions beyond the continental level.
Admixture inference
To determine the date and mode of admixture events, we ran GLOBETROTTER40 (https://github.com/hellenthal-group-UCL/GLOBETROTTER), a software that explores ancestry proportions and linkage disequilibrium decay. We ran GLOBETROTTER in each population and performed 100 bootstrap replications. Crucially, in assessing whether the inferred admixture event in a population signifies a “one-date” or “multiple-dates”, we checked the ancestry curves and the goodness-of-fit (R2) for a single date of admixture (maxR2fit.1date). If the maxR2fit.1date exceeded 99.9%, we interpreted the result as indicative of a one-date admixture, adopting the date and proportions proposed by this mode (criterion confirmed by G. Hellenthal, pers. comm., 2025). However, it’s important to note that this inference pertains to the most recent event and does not preclude the possibility of earlier events.
For HierarchyMix Inference, we use GNOMIX outputs in bed format to run HierarchyMix (https://github.com/Shuhua-Group/HierarchyMix) with default parameters except the number of bootstrap replicates and threshold for ancestry segments. We ran 1000 bootstrap replicates and kept segments greater than 2 cM. No suitable model was identified for four populations (Lima, Lambayeque, Moquegua, and Tacna).
Second, we analyzed IBD sharing among PGP populations to explore recent migration. We kept IBD segments greater than 18.75 cM to explore sharing among populations during the last eight generations that resemble Colonial and post-colonial events. Considering populations X, Y, and Z, we assumed that any IBD segment shared among X and Y populations corresponds to people’s movement among them. However, we cannot rule out that sharing segments between populations could also explain migration from a third source (population Z) to both populations (X and Y) during the same period. To estimate the interpopulation sharing after keeping IBD segments greater than 18.75 cM, we sum the number and the length of IBD segments shared between individuals from different populations. To control for sample sizes, both the total number and the total length were divided by the product of the sample sizes of both populations.
For plotting IBD and GLOBETROTTER results, we modified R codes available at: https://github.com/georgebusby/admixture_in_africa ; and https://github.com/chiarabarbieri/SNPs_HumanOrigins_Recipes
Third, we inferred the distribution of the effective population size during the last 50 generations for PGP data using HapNe44 following the pipeline described here: https://github.com/PalamaraLab/HapNe. Briefly, for each population, each phased chromosome was split into two parts, each divided by the centromere using PLINK. Then, each chromosomal segment was used to infer IBD segments using hap-ibd and then merged with the merge-ibd-segments.jar software. Finally, these outputs were used as inputs for HapNe with default parameters.
Fourth, to interrogate whether a population resulted from sex-bias admixture, we compared admixture proportions from autosomes and chromosome X. For autosomes, we used results from the ADMIXTURE analyses described above. To infer continental ancestry proportions for chromosome X, we ran ADMIXTURE using the –haploid flag. We compared autosomal and chromosome X proportions using the Wilcoxon test.
Statistics and reproducibility
Our full dataset includes 432 individuals from urban populations (Supplementary Data 1); however, most analyses were restricted to unrelated individuals (n = 385) to avoid biases due to familial relatedness. Comparisons between urban populations were conducted on samples ranging from 22 to 40 unrelated individuals per site, reflecting variable sample availability. Most analyses, including PCA, ADMIXTURE, and GLOBETROTTER, were performed across sites to characterize population structure and admixture patterns, while the sex-bias analysis compared autosomal and X chromosome variation within each site. Additionally, heatmaps of pairwise population sharing were used to assess relative relatedness between sites. Continuous variables were compared using a two-sided Wilcoxon rank-sum test with a significance threshold of 0.05. All analyses and visualizations were performed in R (version 4.3) using publicly available software, ensuring transparency and reproducibility.
Reporting summary
Further information on research design is available in the Nature Portfolio Reporting Summary linked to this article.
First Appeared on
Source link

