Vegetarian diets and cancer risk: pooled analysis of 1.8 million women and men in nine prospective studies on three continents
Study population
The study design and data harmonisation process have been described in detail elsewhere [17]. Briefly, prospective cohort studies were identified through literature searches and the principal investigators were invited to participate if the cohorts met the following criteria: (1) the cohort had targeted recruitment to include a high proportion of vegetarians (typically >25%), or the cohort was very large (≥500,000 participants) and was therefore likely to include up to ~5000 vegetarians (assuming that ~1% of many populations may be vegetarian); (2) the cohort had reliable follow-up data on cancer occurrence. Eleven studies met these initial inclusion criteria and agreed to participate, and individual participant data were transferred to the University of Oxford for harmonisation and analysis, except for the Tzu Chi Health Study where collaborators conducted separate cohort-specific analyses at the Health and Welfare Data Science Center (HWDC) in Taiwan, using methods aligned with the analyses conducted in Oxford, and shared the results (due to data protection regulations in Taiwan). For the Adventist Health Study-2 (AHS-2), the data transferred were for a subset of the whole cohort, representing participants living in US states where the cancer registry gave permission to share data externally. Of the eleven potentially eligible studies identified, data are reported here for nine: AHS-2 [18], the Center for cArdiometabolic Risk Reduction in South Asia-1 (CARRS-1) [19], EPIC-Oxford [20], the Oxford Vegetarian Study [21], the Tzu Chi Health Study [22], the UK Women’s Cohort Study [23], the Million Women Study [24], the National Institutes of Health-AARP Diet and Health Study (NIH-AARP) [25], and the UK Biobank [26]. Results from the Center for cArdiometabolic Risk Reduction in South Asia-2 (CARRS-2) [19, 27], are not reported here because of the small numbers of incident cancers (<10 cases of any of the cancer sites of interest), and the China Kadoorie Biobank [28] results were not included due to the low stability of vegetarian diet groups during the follow-up (<20% of those classified as vegetarian at baseline reported consuming a vegetarian diet at follow-up) [17].
Prior to data harmonisation, participants were excluded from individual studies based on cohort-specific criteria largely related to data which were missing or outside the expected range. After data harmonisation, we further excluded participants aged 90 or over at recruitment, those with a previous malignant neoplasm (other than non-melanoma skin cancer), no follow-up data, unreliable dietary data (more than 80% missing), and those with implausible energy intakes (women <2092 or >14,644 kJ/day, men <3347 or >16,736 kJ/day; data on energy intakes were available for AHS-2, EPIC-Oxford, the UK Women’s Cohort Study, the Million Women Study and NIH-AARP); full details of exclusions have been published [17]. Each study had approval from their local ethics committee, and all participants provided informed consent at the time of recruitment (in the Oxford Vegetarian Study, UK Women’s Cohort Study and NIH-AARP consent was assumed on the basis of returning a completed questionnaire).
Diet group classification
Food intake, generally over the previous 12 months or “typical diet”, was assessed at baseline using cohort-specific food frequency questionnaires (FFQs); the number of foods on the FFQs ranged from 16 in the UK Biobank to 217 in the UK Women’s Cohort Study (full details have been published [17]). Using information on the consumption of red meat, processed meat (including processed red meat and processed poultry, but not processed fish), poultry, fish, dairy products and eggs, participants were classified into five diet groups: meat eaters (those who consume any red meat and/or processed meat), poultry eaters (do not consume any red or processed meat but do consume poultry), pescatarians (do not consume red meat, processed meat or poultry, but do consume fish), vegetarians (do not consume red meat, processed meat, poultry or fish, but do consume dairy products and/or eggs), and vegans (do not consume any animal products). Poultry intake was not assessed in the Oxford Vegetarian Study, therefore poultry eaters could not be differentiated from meat eaters in this study. Further details on the classification of diet groups in each cohort have been described previously [17].
Information on dietary intake at resurvey, conducted a median of four to 14 years after baseline, was available for a subsample of participants in all the UK cohorts and CARRS-1; 68-89% of people categorised as vegetarian at baseline were still classified as vegetarian at resurvey, and 12% or fewer vegetarians were re-classified as meat eaters [17].
Cancer ascertainment
Details of cancer ascertainment in each study are shown in Supplementary Table 1. Incident cancer cases were identified through linkage to cancer registries, except for CARRS-1 where a combination of methods was used (linkage through a cancer registry, and/or self-report, and/or verbal autopsy by trained interviewers at follow-up conducted every 2 years as well as for participants who died [29]). Cancer cases were defined using the World Health Organization’s International Classification of Diseases (ICD)-10 codes [30] (or allocated to these where ICD-9 or ICD-O-3 codes were provided): mouth and pharynx cancer (C00–14), oesophageal cancer (C15) and further divided for cohorts with histological codes (EPIC-Oxford, Million Women Study, NIH-AARP, and UK Biobank) into oesophageal squamous cell carcinoma (ICD-O-3 histological codes 8050–8076) and oesophageal adenocarcinoma (ICD-O-3 histological codes 8140, 8141, 8190–8231, 8260–8263, 8310, 8430, 8480–8490, 8560, 8570–8572), gastric cancer (C16), colorectal cancer (C18–20) [further divided into colon (C18), proximal colon (C18.0–18.5), distal colon (C18.6–18.7), and rectum (C19–20)], liver cancer (C22), pancreatic cancer (C25), lung cancer (C34), female breast cancer (C50), endometrial cancer (C54), ovarian cancer (C56), prostate cancer (C61), kidney cancer (C64), bladder cancer (C67), and lymphatic or haematological cancers (C81–96) further divided into non-Hodgkin lymphoma (C82–85), multiple myeloma (C90), and leukaemia (C91–95). In AHS-2 and NIH-AARP, ICD-O-3 codes (rather than ICD-10 codes) were used to identify malignant cancers and histological codes were used to define lymphatic and haematological cancers (9590–9989), non-Hodgkin lymphoma (9591, 9670–9720), multiple myeloma (9731–9734), and leukaemia (9800–9949) [31]. If a participant was not identified with an incident cancer before death but had cancer as an underlying cause of death, then they were considered to have cancer diagnosed on the date of death.
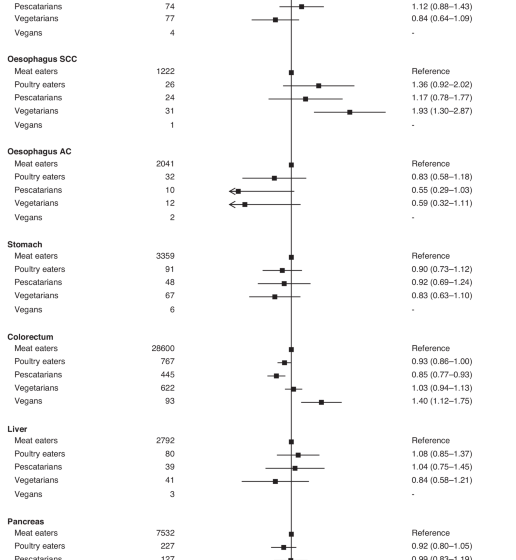
We describe the results for 17 cancer sites: mouth and pharynx, squamous cell carcinoma of the oesophagus, adenocarcinoma of the oesophagus, stomach, colorectum, liver, pancreas, lung, breast, endometrium, ovary, prostate, kidney, bladder, non-Hodgkin lymphoma, multiple myeloma and leukaemia. The main analyses for lung cancer were restricted to never smokers to avoid residual confounding due to smoking [32]. The results for four subsites of colorectal cancer (colon, proximal colon, distal colon, rectum) are shown in the supplementary materials.
Covariates
Cohort-specific questionnaires were used to collect baseline data on socio-demographics, smoking, alcohol intake, physical activity, medical history and female reproductive factors; full details of data harmonisation are published [17]. Height and weight were self-reported in the AHS-2, EPIC-Oxford, Oxford Vegetarian Study, UK Women’s Cohort Study, Million Women Study and NIH-AARP, and measured in CARRS-1, Tzu Chi Health Study, and UK Biobank [17]. Body mass index (BMI) was calculated as weight in kilograms divided by height in metres squared.
Statistical analyses
Characteristics including country, years of recruitment, age at recruitment, average years of follow-up, number of incident cancer cases observed, and number of participants following each dietary pattern were described for each cohort, as were baseline characteristics by sex. For each study and cancer site, multivariable Cox proportional hazards regression models with age as the underlying time variable were used to estimate the hazard ratios (HRs) and 95% confidence intervals (CIs) for poultry eaters, pescatarians, vegetarians, and vegans, with meat eaters (eat red and/or processed meat) as the reference group (all diet groups as defined at baseline). Participants contributed follow-up time from the date of recruitment (or date of the first dietary survey in the Million Women Study) until the date of the first cancer diagnosis, date of death, or date of last follow-up, whichever was the earliest. The models were stratified by sex and by region or method of recruitment, as appropriate. Covariates in the multivariable-adjusted models, all coded as categorical variables, were: cigarette smoking (and tobacco chewing in CARRS-1), alcohol intake, regional and sex-specific height categories, BMI, physical activity, history of diabetes, educational status, living with a partner, ethnic group, and for women parity and ever use of hormone replacement therapy. For female-specific cancers, the models were further adjusted for age at menarche, parity and age at first birth combined, menopausal status, and ever use of oral contraceptives. For prostate cancer, we further adjusted for history of prostate-specific antigen (PSA) screening where available. Details of the categories for covariates are in the supplementary methods; for all the covariates, missing or unknown data were categorised separately as unknown, and the percentages of missing or unknown for each covariate in each cohort are shown in Supplementary Table 2.
To obtain pooled risk estimates across all the cohorts, the logs of cohort-specific HRs were each weighted by the inverse of their variance and combined using a weighted average meta-analysis; this approach, sometimes referred to as ‘fixed effects’, uses weighting for each study approximately proportional to the number of events in that study and does not assume that the true relative risk is the same in all the studies [33]. Heterogeneity across cohorts was assessed using the I2 statistic (where I2 values of ~25%, 50% and 75% are considered to indicate low, moderate and high heterogeneity, respectively) and P for heterogeneity. Cohorts were included in each cancer site meta-analysis (see details below) if there were at least 10 cases observed of that cancer over the follow-up period, across all the diet groups, and we present results for individual diet groups when there were at least 10 cases of cancer in that diet group, across all the cohorts. For lung cancer, the primary analysis was restricted to never smokers. For breast, endometrial, and ovarian cancers, analyses were restricted to women, while for prostate cancer analyses were restricted to men. For breast cancer, we assessed whether the association between diet group and risk varied by menopausal status at the time of diagnosis; for postmenopausal women, follow-up time was considered from the date of recruitment if they were classified as postmenopausal at baseline, or from when they reached the age of 55 (when ~90% of women are postmenopausal) [34].
To examine the possible influence of reverse causality, where undiagnosed cancer might influence diet, we conducted further analyses excluding the first 4 years of follow-up. To examine potential residual confounding by smoking, we repeated all the main analyses in never smokers. Given that BMI can be considered as both a potential confounder, which was accounted for in the main analyses, and a potential mediator in the causal pathway between diet and the risk of cancer, we also performed analyses without adjusting for BMI.
We describe all the HRs which were nominally statistically significant at two-sided P < 0.05, and also indicate HRs which were statistically significant after allowing for multiple testing using the false discovery rate (FDR, among the 16 HRs shown in the main Figs. 1 to 3) as defined by Benjamini and Hochberg with a threshold of 0.05 [35]. All statistical analyses were conducted using Stata release 18.1 (StataCorp, College Station, TX, USA). Forest plots were generated using R version 4.1.2 and the package “Jasper makes plots” version 2-266 [36].
Results were only reported for diet groups with ≥10 incident cases across all cohorts. Pooled multivariable-adjusted hazard ratios and 95% confidence intervals. The models were stratified by sex and by region or method of recruitment. Covariates in the multivariable-adjusted models were: living with a partner (yes, no), educational status (less than secondary/high school, secondary/high school or equivalent, university degree or equivalent), ethnic group (Asian, Black, Hispanic, White, other), study and sex-specific height categories (women in UK and USA cohorts: <160, 160–164.9, ≥165 cm; women in Asian cohorts: <150, 150–154.9, ≥155 cm; men in UK and USA cohorts: <175, 175–179.9, ≥180 cm; men in Asian cohorts: <163, 163–167.9, ≥168 cm), cigarette smoking history (never, previous, current <10 cigarettes/day, current 10–19 cigarettes/day, current ≥20 cigarettes/day, current unknown number of cigarettes), tobacco chewing (in CARRS-1 only; never, previous, current), physical activity (highly active, moderately active, inactive), alcohol intake (0.0, 0.1–9.9, 10.0–19.9, ≥20.0 g/day), history of diabetes (yes, no), parity (nulliparous, parous), ever used hormone replacement therapy (yes, no), and BMI (<20.0, 20.0–22.4, 22.5-24.9, 25.0–29.9, ≥30.0 kg/m2). For all variables, a further category of unknown was included for participants with missing data. ACC adenocarcinoma, SCC squamous cell carcinoma.
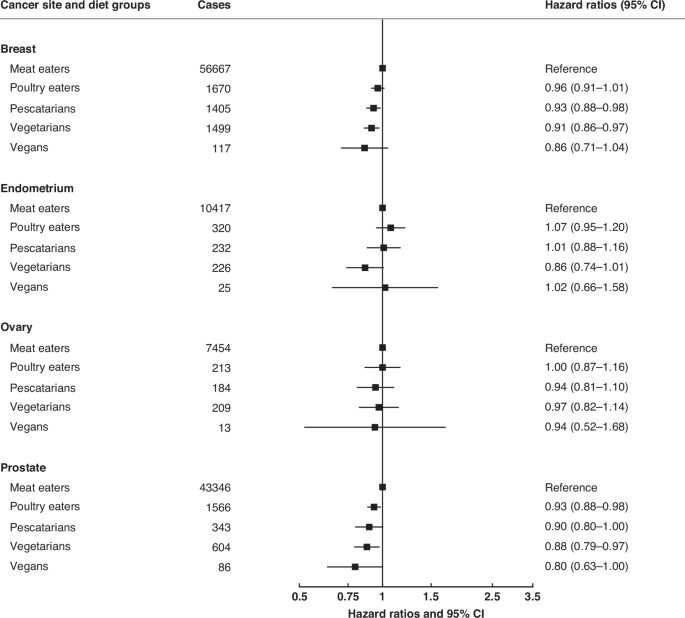
Results were only reported for diet groups with ≥10 incident cases across all cohorts. Pooled multivariable-adjusted hazard ratios and 95% confidence intervals. The models were stratified by region or method of recruitment. Covariates in the multivariable-adjusted models were: living with a partner (yes, no), educational status (less than secondary/high school, secondary/high school or equivalent, university degree or equivalent), ethnic group (Asian, Black, Hispanic, White, other), study and sex-specific height categories (women in UK and USA cohorts: <160, 160–164.9, ≥165 cm; women in Asian cohorts: <150, 150–154.9, ≥155 cm; men in UK and USA cohorts: <175, 175–179.9, ≥180 cm; men in Asian cohorts: <163, 163–167.9, ≥168 cm), cigarette smoking history (never, previous, current <10 cigarettes/day, current 10–19 cigarettes/day, current ≥20 cigarettes/day, current unknown number of cigarettes), tobacco chewing (in CARRS-1 only; never, previous, current), physical activity (highly active, moderately active, inactive), alcohol intake (0.0, 0.1–9.9, 10.0–19.9, ≥20.0 g/day), history of diabetes (yes, no), parity (nulliparous, parous), ever used hormone replacement therapy (yes, no), and BMI (<20.0, 20.0–22.4, 22.5-24.9, 25.0–29.9, ≥30.0 kg/m2). For breast, endometrial, and ovarian cancers, the models were further adjusted for age at menarche (≤10 years, 11–12 years, 13–14 years, ≥15 years), parity and age at first birth combined (nulliparous, and parity and age at first birth grouped as: 1–2 and <25 years, 1–2 and 25–29 years, 1–2 and ≥30 years, 1–2 and unknown, ≥3 and <25 years, ≥3 and 25–29 years, ≥3 and ≥30 years, ≥3 and unknown), menopausal status (pre-menopausal, post-menopausal), and ever used oral contraceptives (yes, no). For prostate cancer, the models were further adjusted for history of prostate antigen screening (yes, no). For all variables, a further category of unknown was included.
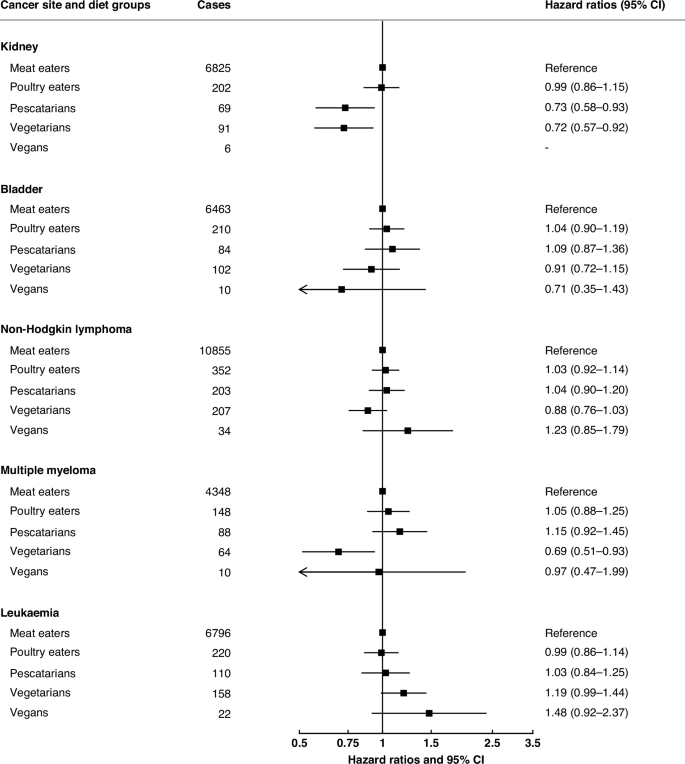
Results were only reported for diet groups with ≥10 incident cases across all cohorts. Pooled multivariable-adjusted hazard ratios and 95% confidence intervals. The models were stratified by sex and by region or method of recruitment. Covariates in the multivariable-adjusted models were: living with a partner (yes, no), educational status (less than secondary/high school, secondary/high school or equivalent, university degree or equivalent), ethnic group (Asian, Black, Hispanic, White, other), study and sex-specific height categories (women in UK and USA cohorts: <160, 160–164.9, ≥165 cm; women in Asian cohorts: <150, 150–154.9, ≥155 cm; men in UK and USA cohorts: <175, 175–179.9, ≥180 cm; men in Asian cohorts: <163, 163–167.9, ≥168 cm), cigarette smoking history (never, previous, current <10 cigarettes/day, current 10–19 cigarettes/day, current ≥20 cigarettes/day, current unknown number of cigarettes), tobacco chewing (in CARRS-1 only; never, previous, current), physical activity (highly active, moderately active, inactive), alcohol intake (0.0, 0.1–9.9, 10.0–19.9, ≥20.0 g/day), history of diabetes (yes, no), parity (nulliparous, parous), ever used hormone replacement therapy (yes, no), and BMI (<20.0, 20.0–22.4, 22.5-24.9, 25.0–29.9, ≥30.0 kg/m2). For all variables, a further category of unknown was included.
First Appeared on
Source link

