Massive Outlier in Owner’s Equivalent of Rent Pushed Down CPI, Core CPI, Core Services CPI: Something Went Awry at the BLS
OER weighs 26% of CPI, 33% of core CPI, 44% of core services CPI. It moves the needle. CPI inflation would have been a lot hotter without this outlier situation.
By Wolf Richter for WOLF STREET.
The delayed release of the Consumer Price Index today, cobbled together with perhaps not all the staff and means that the Bureau of Labor Statistics has normally available due to the government shutdown, was perhaps the best that could be done under the circumstances.
But there were a few things that were off, the most important of which was Owner’s Equivalent of Rent (OER), a huge component in CPI, accounting for 26% of overall CPI, for 33% of core CPI, and for 44% of core services CPI: It was a massive historic outlier.
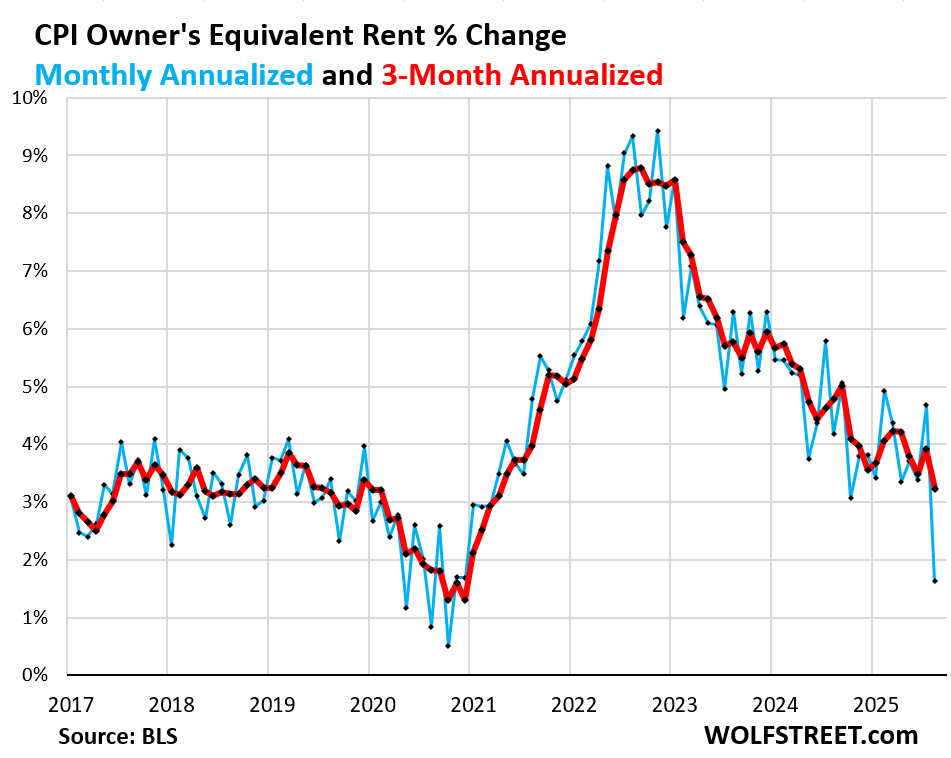
OER rose by only 0.13% in September from August (blue line in the chart), according to the BLS today, compared to 0.38% in the prior month, and compared to the 12-month range between +0.27% (May) and +0.41% (July). Something went wrong there, and given its huge weight, OER significantly pushed down the month-to-month readings of overall CPI, core CPI, and core services CPI.
If this situation with OER hadn’t happened, the inflation readings today would have been a lot hotter than they were, particularly core services CPI where OER weighs 44% and core CPI where OER weighs 33%.
OER is not a measure of rent. The measure of rent is the Rent CPI. OER is a stand-in for the costs of homeownership. OER indirectly reflects the expenses of homeownership such as homeowners’ insurance, HOA fees, property taxes, and maintenance. It’s the only measure for those expenses in the CPI. It is based on what a large group of homeowners estimates their home would rent for, with the assumption that homeowners would try to recoup their cost increases by raising the rent.
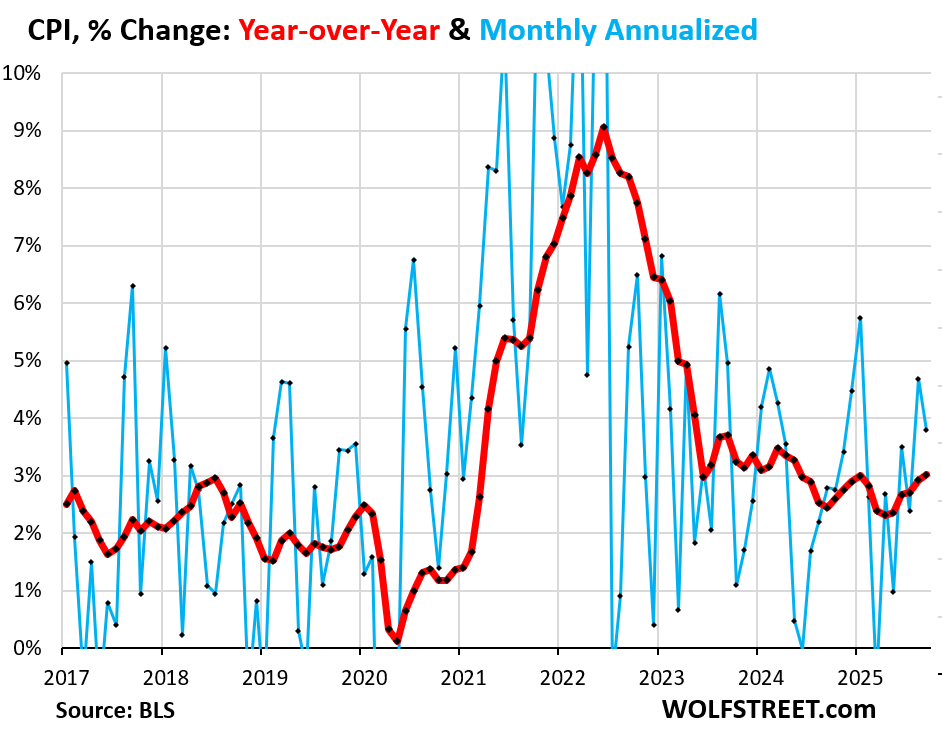
Overall CPI rose by 0.31% (+3.8% annualized) in September from August. So not a benign inflation reading, but the second worst since January. And yet it was pushed down by the OER outlier situation (blue in the chart below).
Year-over-year, overall CPI rose by 3.01%, the worst increase since May 2024, and the sixth acceleration in a row.
It would have risen more without the OER outlier (red).
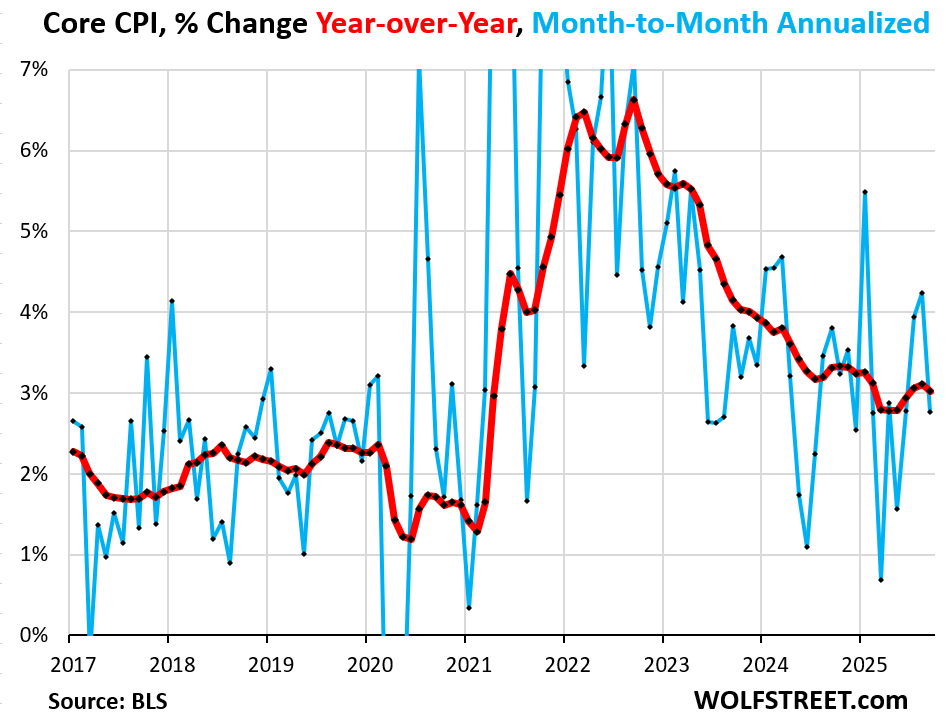
“Core” CPI, which excludes food and energy components to track underlying inflation, clearly showed the massive push-down from the OER outlier.
It rose by only 0.23% (2.8% annualized) in September from August (blue) which caused the year-over-year increase to decelerate to +3.0% (red).
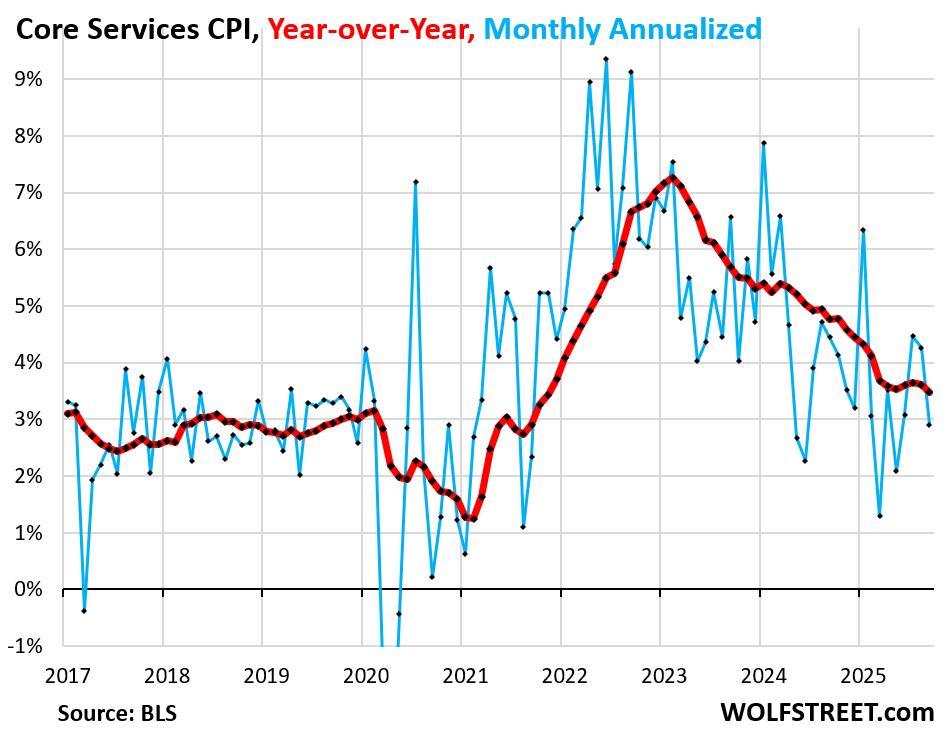
Core services CPI, where OER weighs about 44%, was heavily impacted by the OER outlier: It rose by only 0.24% in September from August (+2.9% annualized).
Core services are about 60% of the overall CPI. They include many of the essentials that consumers cannot do without – housing (OER!), medical care, health insurance, auto insurance, tenant’s insurance, subscriptions; telephone, internet, and wireless services; lodging, rental cars, airline fares, education, movies, sports events, club memberships, water, sewer, trash collection, motor vehicle maintenance and repair, etc.
But with 44% of it gone haywire in some way, it doesn’t really indicate anything for September.
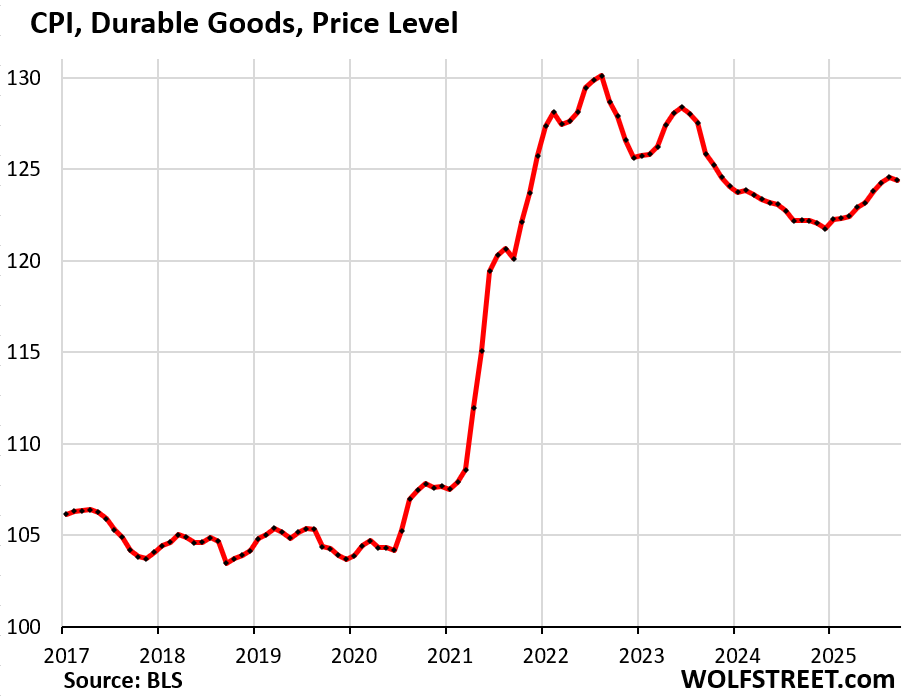
The CPI for durable goods dipped in September by 0.13%, and year-over-year, decelerated to +1.8%.
| Major durable goods categories | MoM | YoY |
| Durable goods overall | -0.1% | 1.8% |
| New vehicles | 0.2% | 0.8% |
| Used vehicles | -0.4% | 5.1% |
| Household furnishings (furniture, appliances, floor coverings, tools) | 0.2% | 3.0% |
| Sporting goods (bicycles, equipment, etc.) | 1.0% | 0.0% |
| Information technology (computers, smartphones, etc.) | -0.8% | -5.1% |
The chart below shows the price level, not the percentage change, of the durable goods. The index had spiked by 25% during the pandemic and then prices came down some from those highs, starting in mid-2022. The index is dominated by new and used vehicles. Used vehicle prices had spiked by 55% from mid-2020 to mid-2022, then declined. But 13 months ago, in August last year, used vehicle prices started zigzagging higher again on tight supplies.
Given how messed up the core services CPI is due to the outlier situation of OER, it doesn’t make much sense to delve into services inflation further at this point.
I will post a special and detailed analysis on food inflation and on energy inflation later today. Lots of interesting stuff happening there. Stay tuned.
Enjoy reading WOLF STREET and want to support it? You can donate. I appreciate it immensely. Click on the mug to find out how:

![]()
WOLF STREET FEATURE: Daily Market Insights by Chris Vermeulen, Chief Investment Officer, TheTechnicalTraders.com.
First Appeared on
Source link

