Nanobody-based recombinant antivenom for cobra, mamba and rinkhals bites
Construction of an immune VHH-displaying phage library
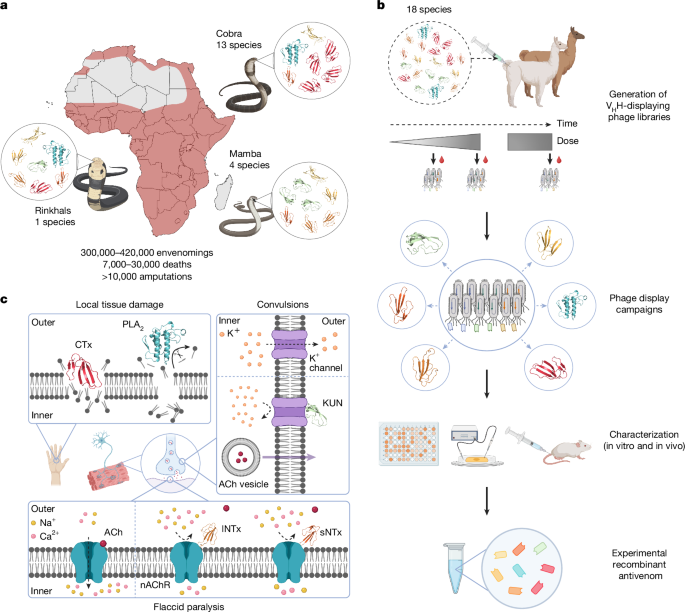
Immune VHH-displaying phage libraries were constructed at the VIB nanobody core (Brussels, Belgium) as described20. To generate VHH-displaying phage libraries, 1 alpaca and 1 llama were injected subcutaneously at bi-weekly intervals across 8 time points with increasing doses of venom mixtures from the 18 most medically relevant elapid snakes in sub-Saharan Africa: D. angusticeps, D. jamesoni, D. polylepis, D. viridis, N. anchietae, N. annulifera, N. ashei, N. haje, N. katiensis, N. melanoleuca, N. mossambica, N. nigricincta, N. nigricollis, N. nivea, N. nubiae, N. pallida, N. senegalensis and H. haemachatus. Following the initial series of injections, 3 additional booster injections were administered at 52, 54 and 60 weeks after the first immunization (Supplementary Table 2 summarizes the detailed immunization schedule). For library generation, blood samples were collected on days 5 and 8 following the first set of 4 injections. The two blood samples from each animal were pooled separately and individual libraries were prepared for each animal. A total of 6 VHH-displaying phage libraries (1 library per time point and animal) was prepared by pooling the total RNA samples after days 46 and 49 (library A), 102 and 105 (library B) and days 5 and 8 following the final booster injections (library C).
Purification and biotinylation of the venom fractions and toxins
Cardiotoxin (P01468) from N. pallida, α-cobratoxin (P01391) from N. kaouthia, α-short-chain neurotoxin (P01426) from N. pallida, and whole venoms from the above-mentioned 18 elapid snakes were purchased in lyophilized form from Latoxan (catalogue numbers and origin of the specimens can be found in Supplementary Table 1). Venom fractions containing short-chain neurotoxins (sNTx), long-chain neurotoxins (lNTx), cytotoxins (CTx), Og XI, AgTx, PLA2 and dendrotoxins (DTx) were isolated from the whole venoms using RP-HPLC (Agilent 1200) with a C18 column (250 × 4.6 mm, 5 μm particle; Teknokroma). 1 mg of venom solubilized in 100 μl solution A (MilliQ water supplemented with 0.1% trifluoroacetic acid (TFA)) was applied to the column and elution was performed at a rate of 1 ml min − 1 using solution A and a gradient towards solution B (acetonitrile supplemented with 0.1% TFA): 0% B for 15 min, 0–15% B over 15 min, 15–45% B over 60 min, 45–70% B over 10 min, and 70% B over 9 min, as described69. Fractions were collected and the solvent evaporated using a vacuum centrifuge. The venom fractions purified via RP-HPLC and toxins bought from Latoxan were dissolved in phosphate buffered saline (PBS: 137 mM NaCl, 3 mM KCl, 8 mM Na2HPO4·2H2O, 1.4 mM KH2PO4, pH 7.4) and biotinylated by amine coupling using a 1:1 to 1:3 molar ratio of venom fraction or toxin to EZ-Link NHS-PEG4-Biotin reagent (Thermo Scientific, A39259), as described34. Free biotin was removed using 2 or 4 kDa MWCO ultracentrifugation membranes (Vivacon 500, VN01H91 and Amicon Ultra-4, UFC8000324, respectively) in accordance with the manufacturers’ guidelines. Following purification, the degree of biotinylation was analysed by matrix-assisted laser desorption/ionization time-of-flight (MALDI-TOF) mass spectrometry using ProteoMass Protein MALDI-MS Calibration Kit (Sigma-Aldrich, MSCAL3) and an Ultraflex II TOF/TOF spectrometer (Bruker Daltonics), as described70.
Proteomics analysis of the selected venom fractions
From each venom fraction, 5 µg was diluted in 50 mM ammonium bicarbonate to a total volume of 25 µl. The samples were reduced and alkylated by 10 mM TCEP and 40 mM chloroacetamide before digestion with either GluC or trypsin in an enzyme-to-protein ratio of 1:100. Samples were incubated overnight at 37 °C, after which the digestion was stopped by addition of 2% TFA for a final concentration of 1%. The samples were desalted with SOLAµ SPE plate (HRP, Thermo) C18 columns, following the same procedure as described71. Dried peptides were reconstituted in 12 µl 2% acetonitrile, 1% TFA, and an estimated 500 ng of peptides was used for mass spectrometry analysis.
Peptides were loaded onto a 2 cm C18 trap column (ThermoFisher 164946), connected in-line to a 15 cm C18 reverse-phase analytical column (Thermo EasySpray ES904) using 100% solvent A (0.1% formic acid in water) at 750 bar, using the Thermo EasyLC 1200 HPLC system, and the column oven operating at 35 °C. Peptides were eluted over a 35 min gradient ranging from 6 to 60% of solvent B (80% acetonitrile, 0.1% formic acid) at 250 nl min−1, and the Q-Exactive instrument (Thermo Fisher Scientific) was run in a DD-MS2 top10 method. Full mass spectra were collected at a resolution of 70,000, with an AGC target of 3 × 10⁶ or maximum injection time of 20 ms and a scan range of 300–1,750 m/z. The MS2 spectra were obtained at a resolution of 17,500, with an AGC target value of 1 × 10⁶ or maximum injection time of 60 ms, a normalized collision energy of 25 and an intensity threshold of 1.7 × 10⁴. Dynamic exclusion was set to 60 s, and ions with a charge state <2 or unknown were excluded.
The raw data from all fractions were analysed with Proteome Discoverer v.2.4. The data were searched against all snake venom proteins (retrieved from Uniprot, 2,263 sequences, accessed 9 November 2021). The trypsin-digested fractions were searched with tryptic specificity, while the GluC-digested fractions were searched with GluC specificity, with two maximum missed cleavages allowed for both proteases. Minimum and maximum peptide lengths were set to 7 and 40, respectively. Precursor mass tolerance was 10 ppm, and fragment mass tolerance was 0.02 Da. Methionine oxidation (+15.995 Da) was set as dynamic modification, while initiator methionine loss (−131.040 Da), acetylation (+42.011 Da), or the combination of methionine loss and acetylation (−89.030 Da) were included as dynamic modifications for the protein terminus. Cysteine carbamidomethylation (+57.021 Da) was added as a static modification. Peptide-spectrum matching was performed with Sequest HT, and false discovery rate (FDR) control with Percolator (0.01 strict and 0.05 relaxed target FDR). FDR was also controlled at the peptide and protein levels with the same target FDRs. Proteins were quantified based on the unique and razor peptides, using the Minora Feature Detector and the Precursor Ions Quantifier nodes with default settings, normalizing abundance to the total peptide amount in each mass spectrometry run and scaling abundance values on the average of all runs.
Clustering toxins on the basis of sequence identity
A sequence similarity network (SSN) was made with the Enzyme Function Initiative-Enzyme Similarity Tool (EFI-EST)72,73. A fasta file containing the UniProt sequences of each discovered toxin from the whole venom of the included 18 elapid snakes was used by the tool to perform an all-by-all BLAST to obtain similarities between sequence pairs. Clustering of toxins with a minimum sequence identity of 70% was subsequently performed by using an alignment score threshold during SSN Finalization that corresponds to 70% identity in the ‘percent identity vs alignment score box plot’ in the Dataset Analysis tab. The obtained SSN was visualized with Cytoscape.
Solution-based phage display selections
VHH-displaying phage libraries were incubated with biotinylated venom fractions or toxins for 2 h at ambient temperature, with end-over-end rotation (Supplementary Table 3 summarizes the final concentration of target toxins and the libraries used in each selection round). Streptavidin coated Dynabeads (M-280, Fisher Scientific, 10465723) were blocked in PBS containing 3% non-fat dried milk powder for 1 h with end-over-end rotation, before addition to the target toxins mixed with the phage library. In each selection round, a background control was included where no antigen was mixed with the phage library. Subsequently, a KingFisher Flex system (Thermo Scientific, 711-82573) was used to wash the beads 3 times with PBST (PBS + 0.1% Tween) and 3 times with PBS, before eluting the bound phages in 120 µl of 0.1 mg ml−1 trypsin (Sigma-Aldrich, T9201-500MG) in phage elution buffer (50 mM Tris, 1 mM CaCl2, pH 8.0). The eluted phages were amplified using the M13KO7 helper phage and concentrated by polyethylene glycol precipitation.
Subcloning, screening, and sequencing of VHHs
Phagemids from the chosen selection outputs (Supplementary Table 3) were purified using the GeneJET Plasmid MiniPrep Kit (Thermo Fisher, K0503) according to the manufacturer’s protocol. The VHH-encoding genes were subcloned into the pBDS100 expression vector using the PstI and Eco91I restriction enzymes (New England Biolabs). Following transformation into the E. coli strain BL21 (DE3) (New England Biolabs), at least 184 individual colonies were picked from each chosen selection output and used for the expression of soluble VHHs. Auto-induction medium74 was used to induce VHH expression for 16 h at 30 °C. Thereafter, periplasmic cell extracts, containing soluble expressed VHHs, were used for primary screenings in a previously described expression-normalized DELFIA20 using 25 nM of target toxin. Clones with a signal intensity ten times higher than the background (no addition of biotinylated target), were cherry-picked and went through a second round of screening in the expression-normalized DELFIA, against multiple target toxins. For the cross-reactive clones, a dose–response experiment was performed, where the Flag-tagged VHHs in the periplasmic extracts were captured onto the wells coated with 2.5 µg ml−1 Flag antibody clone M2 (F3165, Sigma-Aldrich); however, instead of a single concentration, a serial dilution of target toxins (1:1,000 nM) was added. Clones displaying a signal intensity 50 times over the negative control, and/or a low EC50 in the dose–response curves, were Sanger sequenced (Eurofins Genomics sequencing service) using the M13Rev primer (CAGGAAACAGCTATGAC). The VHH frameworks and the complementarity determining regions (CDRs) were annotated using CLC Main Workbench (Qiagen) and the VHHs with unique CDR sequences were produced for in vitro and in vivo assays.
Production of VHHs for in vitro and in vivo experiments
For expression of VHHs at scales up to 100 ml, the periplasmic extracts containing VHHs were produced as described in the screening section and then purified using Ni-resin (Sigma-Aldrich, P6611) via gravity flow. For larger-scale expressions (>250 ml), BL21 (DE3) cells, containing the plasmid encoding a unique VHH, were cultivated as described20. Thereafter, the VHH-containing supernatants were purified using immobilized metal ion affinity chromatography with a 2 ml column volume of Ni-NTA resin (HIS-select Nickel Affinity Gel, Sigma-Aldrich, P6611) equilibrated with PBS supplemented with 200 mM NaCl and 20 mM imidazole, pH 8.0. Elution was performed with PBS containing 200 mM NaCl and 135 mM imidazole, pH 8.0, followed by an overnight dialysis in SnakeSkin Dialysis Tubings (10 kDa MWCO, ThermoFisher Scientific, 68100) against PBS. Subsequently, VHHs were concentrated using Amicon Ultra-15 centrifugal filters (3 kDa MWCO, Fisher Scientific, 10781543).
Kinetic analysis of VHHs using BLI
The binding of VHHs to the venom fractions and toxins was analysed using BLI (Octet-BLI; Octet RED 96, ForteBio). Biotinylated venom fractions and toxins at a concentration of 0.5 µg ml−1 were captured to a target spectral shift of 0.8 nm on a streptavidin-coated BLI biosensor (Sartorius, 18-5020). A biosensor without antigen was included as a reference. VHHs were prepared in running buffer (10 mM HEPES, 150 mM NaCl, 3 mM EDTA, 50 mM MES hydrate, and 0.05% P20 (MES-HEPES), pH 7.2). The toxin-loaded biosensors were dipped into four different VHH concentrations (7.5, 30, 120, 480 nM) and a control without any VHH. VHH association was measured for 600 sec, followed by measuring VHH dissociation in running buffer for 600 sec. Biosensors were regenerated by dipping into the regeneration buffer (10 mM Glycine, 4 M sodium chloride, pH 2.0) between each round, 5 times, for 10 sec each. For analysis, the reference BLI biosensor background was subtracted, a global model assuming a 1:1 interaction was used for fitting of the data, and calculations of kinetic parameters were all made in Octet Analysis Studio 12.2.2.26 (ForteBio).
Patch clamp electrophysiology
Automated planar whole-cell patch clamp experiments were performed as described20. All experiments were performed on a Qube 384 automated patch clamp platform (Sophion Bioscience) with 384-channel, 10X mode patch chips (10 patch holes/site, site resistance 0.2 ± 0.04 MΩ). We used a human rhabdomyosarcoma cell line (American Type Culture Collection, ATCC) endogenously expressing muscle type nAChRs ((α1)2β1γδ) and 70 µM acetylcholine for receptor activation. We first determined the IC80 for the included toxins or venom fractions (sNTX-1, sNTx-3, sNTx-6, lNTx-3, lNTx-5 and lNTx-7) and used this concentration to evaluate the neutralization effect of the corresponding VHHs. The VHHs were used at molar ratios of 9:1 to 1:27 between toxin and VHH. Finally, the inhibitory effect of the toxins on the elicited acetylcholine current was normalized to the full acetylcholine response and averaged in each group (n = 8). The data were analysed with Sophion Analyzer v.6.6.70 (Sophion Bioscience) and GraphPad Prism 10 software.
In vitro neutralization of cell cytotoxicity
A cell viability assay was performed as described34. In brief, N/TERT keratinocytes were seeded at 4,000 cells per well in 100 µl cell culture medium and incubated overnight under standard conditions. After determining the IC50 of each venom, the cells were subjected to a venom concentration of 2 × IC50, either in the absence or presence of a 1:5 molar ratio of CTx or PLA2 to VHH based on the CTx or PLA2 contents of each venom29, followed by a 24 h incubation step. Thereafter, the CellTiter-Glo luminescent cell viability assay (Promega) was performed in triplicate according to the manufacturer’s protocol. A maximal cell death control was included, where the cell culture medium was supplemented with 0.01% Tween 20 to disrupt the cells. In addition, a maximum cell viability control was included, with cell culture medium supplemented with PBS, as well as a VHH control, where cells were incubated with the highest tested VHH concentration without venom, to confirm that the VHHs alone do not affect cell viability. The data were visualized with GraphPad Prism 10 software.
In vitro neutralization of PLA2 enzymatic activity
Venom concentration inducing half of the maximum PLA2 enzymatic activity (EC50) was determined as described29. For inhibitory dose–response curves, VHHs were diluted to 16 µM, followed by a twofold serial dilution in 10 steps. 50 µl of snake venom at a concentration of 4 × EC50 was mixed with the serial dilutions of the VHHs and then incubated at room temperature for 30 min. The enzymatic reaction was started by adding 100 µl of 0.5 mM NOBA into the mixture. Final concentrations of the individual components in the enzymatic activity assays were 0.25 mM NOBA, and a twofold serial dilution of the VHHs with the highest concentration set at 4 µM. After adding NOBA to the wells, plates were shaken at 300 rpm for 2 min, and then incubated at 37 °C for 40 min. Finally, the plates were centrifuged at 4,000g at 4 °C for 3 min, and absorbance was measured at 25 °C at 405 nm using a Multimode Microplate Reader (VICTOR Nivo, HH35000500). The experiments were performed in duplicate and the absorbance averages were determined after subtracting a blank control containing no venom. The data were analysed using the Victor Nivo Control software v.5.1.0 and Graphpad Prism 10 software with a nonlinear fit using ‘Sigmoidal, 4PL, X is concentration’.
Co-crystallization of VHHs and toxins
Lyophilized toxins and vacuum-dried venom fractions were reconstituted at 10 mg ml−1 in 5 mM Tris and 20 mM NaCl at pH 8.0. The toxins or venom fractions were then added to the VHHs at a threefold molar excess (VHH1 a-CTx: cardiotoxin (P01468), VHH5 a-sNTx: α-short-chain neurotoxin (P01426)) and incubated overnight at 4 °C. The VHH:toxin complexes were purified using size-exclusion chromatography (Superdex 75 10/300GL column, Cytiva) on an NGC Quest 10 Plus Chromatography system (Bio-Rad) maintained at 4 °C, with the reconstitution buffer serving as the mobile phase. Before crystal screening, the VHH–toxin complexes were concentrated to 15.0 mg ml−1 using 3.0 kDa MWCO ultracentrifugation filters (UFC500324, Merck).
Crystallization trials were performed at 21 °C via the sitting drop vapour diffusion method. Drops (0.3 µl) were set up at reservoir:protein ratios of 2:1, 1:1, or 1:2 in a 96-well drop format on SWISSCI MRC 2 well crystallization plates (JENA) using LMB, BCS, Index, and Structure screening solutions (Hampton Research). The wells were sealed with crystal clear tape and equilibrated against 50 µl of reservoir solution. The VHH1 a-CTx co-crystal formed in 0.2 M ammonium acetate, 0.1 M sodium acetate, pH 4.6, 30% w/v PEG4000. The VHH5 a-sNTx co-crystal formed in 0.2 M sodium chloride, 0.1 M sodium acetate, pH 4.6, 30% v/v 2-methyl-2,4-pentanediol (MPD). The developed co-crystals were collected using mounted CryoLoops (Hampton Research) with cryoprotection performed by adding glycerol to a neighbour drop with no crystals to a final concentration of 25%. The loop edge was kept in contact with the cryo solution for approximately 5 s to equilibrate before flash freezing the co-crystal in liquid nitrogen and shipping to the beamline for remote data collection. Data collection and refinement statistics are shown in Supplementary Tables 10 and 11. The final structural models and corresponding structure factors have been deposited in the Protein Data Bank (PDB) under accession codes 9RIT and 9RIU.
Data collection and structure determination
X-ray diffraction data for the VHH1 a-CTx and VHH5 a-sNTx co-crystals were obtained at the Biomax (MAX IV synchrotron facility, Lund, Sweden) beamline. Complete datasets were collected over a 360° rotation for the VHH1 a-CTx and VHH5 a-sNTx co-crystals. The data processing was performed with XDSAPP375,76,77, and the data are summarized in Supplementary Tables 10 and 11. Structures of the VHHs in complex with their respective toxins were determined by molecular replacement with Phaser-MR78 using an AlphaFold 3 model for both the VHH and the target toxin as a search model. Model building and refinement were performed with Phenix.refine77 and Coot79.
The structures were evaluated using MolProbity with final statistics presented in Supplementary Tables 10 and 11. Molecular graphics were presented with PyMOL Molecular Graphics System (v.2.2r7pre, Schrödinger, LLC). Coordinates and structure factors have been submitted to the PDB database with the accession codes 9RIT and 9RIU.
Cryo-EM collection and processing
Cryo grids of VHH20 a-PLA2 in complex with PLA2-3 were imaged at 190,000x nominal magnification using a Falcon 4i camera on a Glacios microscope at 200 kV. Automated image collection was performed using EPU from ThermoFisher. Images were aligned, dose-weighted, and Contrast Transfer Function (CTF)-corrected in the CryoSPARC Live software platform, with automated image collection also performed using Smart EPU software (ThermoFisher). Data processing was carried out in CryoSPARC v.4.5.380. Blob particle picking was performed on all micrographs with a minimum particle diameter of 60 Å and a maximum of 90 Å. Particles extracted at 256 pixels box size were used to perform 2D classification, which were then used to generate a 3D reference model from ab initio refinement, followed by heterogeneous refinement and 3D classifications to obtain a good class that was further non-uniform heterogeneous refined. Gold-standard Fourier shell correlation resolution was calculated to be 5.4 Å. Owing to the small size of the complex and the low resolution of the map, we could not build a model, but could dock it in the AlphaFold 3 predicted complex as an indicator of whether the predicted interface is plausible.
Generation of in silico predictions of VHH:toxin complexes
For VHH:toxin complexes that did not yield protein co-crystals, protein sequences were submitted as input to AlphaFold 3 for structure prediction81. Multiple predictions were generated using randomized seeds for each VHH:toxin complex. The model exhibiting the highest confidence scores (per-residue confidence estimate (pLDDT), predicted template modelling (pTM), and interface predicted template modelling (ipTM)) were selected for further analysis. Molecular visualization and graphic preparation were presented with PyMOL Molecular Graphics System (v.2.2r7pre, Schrödinger, LLC).
In vivo neutralization of venom-induced lethality
LD50 determinations and lethality neutralization experiments were conducted using groups of mice of both sexes weighing 18–20 g. At IBt-UNAM, the CD1 mouse strain was used in the experiments performed for designing the recombinant antivenom, LD50 determinations, and rescue experiments. In experiments performed at the University of Northern Colorado, the NSA mouse strain was used for the pre-incubation assays. Time of death after administration of 3 × LD50 of venoms was recorded in both strains to secure homogeneous results. All mice were kept under 12 h light and dark cycles with food and water ad libitum, ambient temperature between 18 and 24 °C and relative humidity of approximately 60%. LD50s were determined for selected toxins (lNTx-7 and sNTx-3) and all the target venoms using the intravenous route (Supplementary Table 6) as described20. In the case of venoms selected for rescue assays, LD50s were also determined using the subcutaneous route (Supplementary Table 6).
Recombinant antivenom design experiments
To evaluate the neutralizing efficacy of the VHHs and design a recombinant antivenom, neutralization of selected individual toxins and selected whole venoms was performed in pre-incubation experiments (Extended Data Fig. 4 and Supplementary Table 7), as described20. The mice were observed during the first 3 h and then approximately every 6 h for signs of envenoming. The percentage of survival was determined 24 h after the injection and plotted as Kaplan–Meier survival curves using GraphPad Prism v.10.2.
Pre-incubation experiments
For pre-incubation experiments of whole venoms, 3 × LD50 of each venom (Supplementary Table 6) were mixed with 3.6 mg (117 µl) of recombinant antivenom (Supplementary Table 8) in a total volume of 200 µl per mouse. This was then pre-incubated at 37 °C for 30 min before intravenous injection into groups of five mice. To compare the performance of the recombinant antivenom with a current plasma-derived commercial antivenom, five venoms were also tested for neutralization with the F(ab’)2 polyclonal antivenom Inoserp PAN-AFRICA (lot 5IT11003; expiration date November 2018) (INOSAN BioPharma), which is currently recommended for the treatment of envenomings caused by eight elapid and five viperid snakes from Africa. The antivenom was pre-incubated with the venom at 37 °C for 30 min, using the volume that neutralizes a minimum of 3 × LD50 of venom from N. nigricollis and D. polylepis, according to the manufacturer’s product insert. This antivenom is also recommended for the treatment of bites by the elapid snakes D. viridis, D. angusticeps, D. jamesoni, N. haje, N. pallida, N. melanoleuca, N. nivea and N. katiensis. All mice were observed during the first 5 h and then approximately every 6 h for appearance of envenoming signs (Supplementary Table 9). The percentage of survival was determined 24 h after the injection and plotted as Kaplan–Meier survival curves using GraphPad Prism v.10.2.
Rescue experiments
The venoms of 11 elapid snakes (D. angusticeps, D. jamesoni, D. polylepis, D. viridis, N. annulifera, N. haje, N. melanoleuca, N. nivea, N. nubiae, N. senegalensis and H. haemachatus) were selected for their neutralization in rescue experiments. These were designed to better represent actual envenoming, where the venom is injected first (subcutaneously) and then the recombinant antivenom is administered using the intravenous route. In these experiments, 3 × LD50 of each of the selected venoms (Supplementary Table 6) were injected in a final volume of 40 µl PBS. The recombinant antivenom was injected 5 min later using the intravenous route in a total volume of 300 µl PBS. Since the recombinant antivenom was designed considering the LD50 of each venom determined through intravenous administration, the dose of the recombinant antivenom used was adjusted based on the ratio between LD50s determined through subcutaneous and intravenous injection for each venom. The mice were observed during the first 5 h and then approximately every 6 h for the appearance of envenoming signs. The percentage of survival was determined 24 h after the injection and plotted as Kaplan–Meier survival curves using GraphPad Prism v.10.2.
To compare the performance of the recombinant antivenom with a current plasma-derived commercial antivenom, rescue experiments were performed for some species (D. jamesoni, D. viridis, N. haje, N. melanoleuca and H. haemachatus) using Inoserp PAN-AFRICA (lot 5IT11003; expiration date November 2018) (INOSAN BioPharma). Similar to the pre-incubation experiments, the antivenom dose was the volume that, according to the manufacturer, neutralizes a minimum of 3 × LD50 of venom adjusted based on the ratio between the LD50 determined by intravenous or subcutaneous injection.
Owing to the low availability of commercial antivenom, a vial from an expired batch of Inoserp PAN-AFRICA was used for all experiments.
In vivo neutralization of venom-induced dermonecrosis
For dermonecrosis experiments, groups (n ≥ 5) of male Swiss (CD1) mice (29–31 g) were used. Animals had ad libitum access to CRM-irradiated food and filtered water. Prior to venom injection, mice were weighed and given 5 mg kg−1 subcutaneous morphine. The dorsal flanks of mice were shaved to monitor lesion progression.
Prevention of venom-induced dermonecrosis
For venom challenges, mice were injected intradermally in the ventral abdominal region, with venoms from N. nigricollis (24 µg per mouse), N. mossambica (39 µg per mouse) and H. haemachatus (26 µg per mouse) dissolved in 50 µl PBS. This dose corresponds to 1 minimum necrotizing dose (MND)—that is, the dose that induces an area of dermonecrosis of 5 mm in diameter, 72 h after injection38. In pre-incubation models, 1 MND of venom from each of the 3 snakes was pre-incubated with 1.09 mg of a mixture of VHH1 a-CTx (450 µg per mouse), VHH4 a-CTx (450 µg per mouse) and VHH20 a-PLA2 (190 µg per mouse) at 37 °C for 30 min before intradermal injection. In the first rescue model, 1 MND dose of venom in 10 µl was injected intradermally, followed by 1.09 mg of VHHs in 40 µl at the same region after 15 min. In a second rescue model, 1 MND dose of venom was injected intradermally in a 50 µl volume, followed after 15 min by intravenous administration of 3.6 mg of recombinant antivenom (Supplementary Table 8) in 200 µl. For the control groups the same volume of PBS was administered instead of VHHs. As a comparison, a group of mice received 1 MND of N. nigricollis venom followed by 4.2 mg of Inoserp PAN-AFRICA antivenom (INOSAN Biopharma).
Mice were monitored continuously for the first 6 h post-injection, with additional checks every 3 h up to 12 h and then 3 times daily up to 72 h in pre-incubation and intradermal rescue models and up to 48 h in intravenous rescue studies. At the end of each experiment, animals were humanely euthanized via inhalational CO2. Lesions at injection sites were dissected, measured in two directions with digital callipers, and photographed with a camera and light ring.
Statistical analysis
To evaluate the significance of outcomes from these experiments, a Welch’s t-test was used to compare mean lesion sizes between control and treatment groups, following confirmation that data met parametric assumptions. Normality was verified using the Shapiro–Wilk test, while ROUT tests were performed to identify any outliers within the data. Comparisons were made against the negative control (PBS only). All analyses were conducted using GraphPad Prism (v.10.3.1), with statistical significance set at α = 0.05.
Ethics declarations
For systemic envenoming experiments, all animals and in vivo methodologies used were approved by the bioethics committee of the Institute of Biotechnology, Universidad Nacional Autónoma de México (IBt-UNAM) under project 410 or the University of Northern Colorado Institutional Animal Care and Use Committee (UNC-IACUC), the Department of Biological Sciences under project 2208D-SM-SMLBirds. For dermonecrosis experiments, ethical approvals were obtained from the Animal Welfare and Ethics Review Boards of Liverpool School of Tropical Medicine and The University of Liverpool, and work was performed under UK Home Office Project Licences P58464F90 and PP2669304 in accordance with the UK Animal (Scientific Procedures) Act 1986.
Reporting summary
Further information on research design is available in the Nature Portfolio Reporting Summary linked to this article.
First Appeared on
Source link

