Tracking flu cases in the US through maps and charts
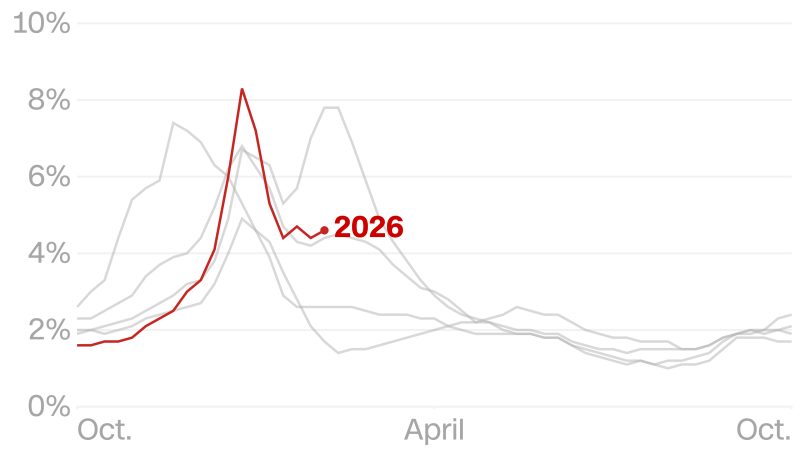
The current flu season has seen the highest rate of doctor’s visits for flu-like symptoms since the US Centers for Disease Control and Prevention began collecting data through a national surveillance network in 1997.
As the season progresses, CNN is tracking these case rates and hospitalizations across the country. This page will update each week as the CDC releases new data.
The rate of doctor’s visits for flu-like illness is based on reported symptoms that include a fever plus a cough or sore throat. The CDC estimates that, on average, around 8% of the US population gets sick from the flu each season.
Children are more likely to get sick from the flu than adults. However, adults 65 years and older and children younger than two are at higher risk of developing complications from the flu.
The CDC monitors flu-like illness activity across states and jurisdictions. Weekly activity levels are based on the rate of doctor’s visits for flu-like illness.
Hundreds of thousands of people in the US are hospitalized with the flu every year. Throughout each flu season, the cumulative hospitalization rate tracks the number of laboratory-confirmed flu hospitalizations per 100,000 people.
About this story: Data on this page is collected from the CDC’s Weekly US Influenza Surveillance Report and the agency’s Flu View interactive. The data are preliminary and may change over time as more reports are received.
First Appeared on
Source link

